.jpg)

1. Background
In athletes, training load is one of the most important metrics for improving performance (1, 2) and preventing injuries (3, 4). While various types of training exist, sprint training is particularly important in sports where running speed impacts performance. Training load variables are generally defined by intensity and volume: Although distance is the primary volume variable in sprint training, there are several possible intensity variables, with running speed being the most widely used. In the past, running speed was calculated using distance and time data; however, in recent years, instantaneous changes in speed have been measured with technologies such as the Global Positioning System (GPS) (5-9) or laser gun devices (10, 11). Global Positioning System is primarily used at the professional level in ball sports, such as football (5) and rugby (6), to measure training loads for teams or individuals. However, the use of GPS technology depends on the economic resources of teams or individuals. Although laser guns are easy to use, affordable, and provide immediate feedback, they can only measure sprint running in a straight line. Additionally, speed performance itself is not always a repeatable measure, as it is sensitive to environmental factors such as temperature and wind, as well as the physical condition of the athlete.
Another measure of sprint running intensity is subjective effort (SE). Subjective effort is widely used by track athletes because it has no cost and is not affected by changes in environmental or physical conditions. Several studies have reported on the relationship between SE and performance in submaximal sprint running (12-15). For instance, Ito et al. examined changes in actual performance across three movements (sprint running, vertical jumping, and handball throwing) at five levels of SE (100%, 80%, 60%, 40%, and 20%) (13). They reported similar linear relationships between SE and actual performance in all movements. Additionally, they found that performance levels were higher than the SE, with the actual performance level of a sprint at 40% SE being 77% of maximal sprint effort. Kakehata et al. investigated the relationship between SE and kinematics or kinetics during a 50 m sprint (14). They found that vertical ground reaction impulse in the first half of the ground contact period was significantly higher at submaximal SE levels than at maximal sprint running. Although previous studies have focused on changes in running kinetics or kinematics associated with variations in SE during sprint running (10-13), there is limited knowledge about inter-individual or intra-individual variability in sprint running performance at different SE levels. According to Coyne et al., the first recommendation for making subjective indicators available for measuring training load is to verify the validity and reliability of the scale (16). Therefore, if performance controlled by SE is stable, SE could be considered a reliable indicator of sprint running intensity.
Several studies have reported on the reliability of subjective measures of exercise intensity, such as the rating of perceived exertion (RPE) (17-21). Stamford examined the validity and reliability of RPE under various conditions, including walking, jogging, cycling, and stepping (21). He found that RPE responses were highly reproducible and showed strong correlations with heart rate. Scott. Scott et al. investigated the criterion validity and test–retest reliability of the CR10 and CR100 scales for self-reported sRPE in team sport athletes performing high-intensity, intermittent exercise (20). They found that self-reported RPE might not be suitable for detecting small changes in exercise intensity during brief intermittent running bouts. These findings suggest that exercise intensity based on an athlete’s SE level can be used in training. However, while indicators like RPE are effective in sports that require relatively long exercise durations, there are few indicators of subjective exercise intensity that apply to high-intensity exercises such as sprint running, which places a significant load on neuromuscular function. If SE proves reliable, it could be used to monitor running distance for each SE level during sprint training and could help improve performance and prevent injuries.
2. Objectives
The purpose of this study was to examine the intra-individual and inter-individual variability of sprint running performance at different SE levels. We hypothesized that sprinting at higher SE levels would result in less variability both within and between individuals. We also compared changes in the kinematic characteristics (step frequency and stride length) of sprint running across different SE levels.
3. Methods
3.1. Participants
Eighteen male collegiate sprinters participated in this study. Ten of the participants were short-distance sprinters (100 m, 200 m, or 110 mH), and eight were long-distance sprinters (400 m or 400 mH). The characteristics of the participants are summarized in Table 1. Athletes who specialized in short-distance events (100 m, 200 m, 400 m, 110 mH, or 400 mH) and regularly participated in sprint training at least twice a week were included. Athletes unable to sprint maximally due to injury or illness were excluded.
| Variables | All | SS (n = 10) | LS (n = 8) | Significance |
|---|---|---|---|---|
| Age (y) b | 20 (19 - 21) | 19.5 (19 - 20.75) | 21 (19.75 - 21) | n.s. |
| Height (cm) | 175.67 (173.12 - 178.21) | 176.20 (172.17 - 180.23) | 175.00 (171.08 - 178.92) | n.s. |
| Weight (kg) | 68.44 (65.70 - 71.19) | 70.40 (66.78 - 74.02) | 66.00 (61.51 - 70.49) | n.s. |
| Personal best time of 100m (s) | 11.09 (10.98 - 11.21) | 11.01 (10.85 - 11.18) | 11.19 (11.02 - 11.36) | n.s. |
| Years of T&F experience (y) b | 8.5 (7 - 9) | 7 (6.25 - 8.75) | 9 (8.75 - 9) | n.s. |
The Characteristics of the Participants a
3.2. Experiments
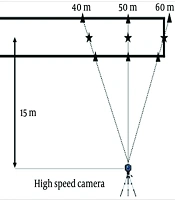
To clarify the intra- and inter-individual variability of SE, we measured participants' 60 m sprint running performance at four SE levels (60%, 80%, 90%, and 100%) repeatedly over 5 days (4 sprints × 5 days = 20 sprints). We recorded the 60 m sprint time and the average speed between 40 and 50 m using an optical high-speed camera set to a frame rate of 240 Hz. The experimental procedures are presented in Figure 1.

Experimental set up for measuring 60 m sprint variables
Briefly, the camera was positioned 15 m perpendicular to the center of the lane at the 50 m mark. Markers with sticks were placed at the intersections of the lines extending from the camera to the center of the lane and the lines at either side of the lane at three points (40 m, 50 m, and 60 m). Participants were instructed to start using the “three-point start” method, supporting their body with one hand and both legs at the starting point. The starting moment was defined as the frame before the participant’s hand left the ground in the captured video. The frame in which the center of the participant’s pelvis passed the center of both markers placed at either side of the lane was defined as the passage of each of the three points (40 m, 50 m, and 60 m).
Additionally, the number of steps in each trial was counted to examine changes in running motion (step frequency and stride length) associated with changes in SE. The number of steps was defined as the number of touchdowns between the start and the 60 m markers. If the 60 m markers were crossed with an incomplete step, the final step was calculated in decimal points using the frame at the moment the subject last touched the ground before passing 60 m (A), the frame at the moment the subject passed 60 m (B), and the frame at the moment the subject touched the ground after passing 60 m (C) (Time between A and B/Time between A and C). We used the video analysis software Kinovea-0.8.15, Joan Charmant & Contrib, to measure sprint time.
The experimental protocol was as follows: First, participants randomly determined the order of the four trials by drawing lots. They performed one 60 m sprint run at 60%, 80%, 90%, and 100% SE in the order determined by the above procedure. Before the start of each trial, participants were instructed by the researcher to run in the center of the lane, maintain a constant SE throughout the 60 m, and not decelerate until after passing the 60 m mark. Familiarization trials were conducted only upon participant request. The experiments were repeated over 5 days following the same process. Environmental conditions or fatigue were not measured, as they were not expected to significantly affect the data, which were measured in a random order. After the final day of measurements, participants completed a questionnaire about their personal best times for 100 m and their years of athletic experience. Responses to this questionnaire were used to analyze associations with the intra-individual variability of SE.
3.3. Statistical Analysis
The coefficient of variation (CV) of the participants' 5-day performance (60 m sprint time (60T) and 40 - 50 m interval average speed (SP) was calculated as a measure of intra-individual variability of SE. Coefficient of variation was determined by dividing the standard deviation by the mean (CV = SD/mean).
The Shapiro-Wilk test was used to assess the normality of the data. When normality was confirmed, repeated measures analysis of variance (ANOVA) was applied to compare 60T, SP, and the CVs of 60T and SP across SE levels. The Bonferroni method was used for post hoc, between-group comparisons. If the data did not follow a normal distribution, the Friedman Repeated Measures ANOVA by Ranks was employed.
Data were analyzed using EZR Version 1.61. Probability values less than 0.05 were considered statistically significant (P < 0.05), and values less than 0.1 were considered marginally significant. Sample size calculations were performed using GPower version 3.1. The results of this study are expressed as mean ± 95% confidence interval (CI), unless otherwise stated. This study was approved by the ethics committee of Ritsumeikan University, Kusatsu, Japan (BKC-LSMH-2022-056).
4. Results
4.1. Sample Size Calculation
Because the main objective of the present study was to compare the variability of sprint performances across four SE levels, a repeated measures ANOVA was used for sample size calculations. A theoretical moderate effect size of 0.25 was assumed, with the α error probability set at 0.05 and statistical power (1−β) set at 0.8. The correlation among repeated measures was estimated to be 0.7 based on preliminary experiments. We calculated that a sample size of 15 participants was needed to compare four within-participant factors within one group. To account for potential dropouts during the experimental procedures, we recruited 18 participants. Table 1 summarizes the participants’ age, height, weight, event type (short or long-distance sprinter), personal best time for 100 m, and years of Track & Field experience. No significant differences were found between event groups for any of the variables.
4.2. Relationship Between SE and Sprint Performance
The main results of this study are summarized in Table 2. A repeated measures ANOVA revealed significant differences between SE groups for 60T (P < 0.05). Post hoc tests indicated significant differences between all SE group comparisons. Similarly, a repeated measures ANOVA revealed significant differences between SE groups for SP (P < 0.05), with post hoc tests also showing significant differences between all SE group comparisons.
| Variables | 60% | 80% | 90% | 100% | P-Value a |
|---|---|---|---|---|---|
| 60 m sprint time (s) | 8.33 | 7.93 | 7.77 | 7.66 | < 0.05 |
| 95%CI | 8.20 - 8.46 | 7.84 - 8.02 | 7.70 - 7.84 | 7.61 - 7.71 | |
| CV between individuals (%) | 3.25 | 2.31 | 2.06 | 1.54 | |
| 40 – 50 m average speed (m/s) | 8.21 | 8.73 | 8.98 | 9.16 | < 0.05 |
| 95%CI | 8.05 - 8.37 | 8.60 - 8.86 | 8.86 - 9.10 | 9.07 - 9.25 | |
| CV between individuals (%) | 4.25 | 3.18 | 2.77 | 2.12 | |
| Average speed ratio to maximal sprint at each submaximal sprint (%) | 89.72 | 95.50 | 98.11 | - | < 0.05 |
| 95%CI | 88.10 - 91.35 | 94.42 - 96.58 | 97.55 - 98.67 | - | |
| CV for 60 m sprint time (%) | 2.22 | 1.95 | 1.42 | 1.40 | < 0.05 |
| 95%CI | 1.87 - 2.57 | 1.63 - 2.27 | 1.19 - 1.64 | 1.10 - 1.71 | |
| CV for 40 - 50 m average speed (%) | 3.04 | 2.69 | 2.06 | 2.20 | < 0.05 |
| 95%CI | 2.49 - 3.59 | 2.27 - 3.11 | 1.67 - 2.45 | 1.77 - 2.63 | |
| Average step frequency (step/s) | 3.64 | 3.91 | 4.06 | 4.21 | < 0.05 |
| 95%CI | 3.55 - 3.73 | 3.81 - 4.01 | 3.97 - 4.15 | 4.13 - 4.29 | |
| Average stride length (m/step) | 1.98 | 1.94 | 1.91 | 1.86 | < 0.05 |
| 95%CI | 1.95 - 2.02 | 1.90 - 1.98 | 1.87 - 1.94 | 1.83 - 1.90 |
Summary of all Results According to Percentage of Subjective Effort in Sprint Running
4.3. Relationship Between Subjective Effort and Coefficient of Variation
The inter-individual variation in 60T at each SE level tended to decrease as SE increased (60% SE: 3.25%, 80% SE: 2.31%, 90% SE: 2.06%, 100% SE: 1.54%). A similar trend was observed in SP (60% SE: 4.25%, 80% SE: 3.18%, 90% SE: 2.77%, 100% SE: 2.12%).
Regarding 60T, there was a significant difference in intra-individual variability (CV) across the five trials between the four SE levels (Figure 2 P < 0.05). Post hoc tests revealed significant differences between 60% SE (2.22 ± 0.35%) and 90% SE (1.42 ± 0.22%), 60% SE and 100% SE (1.40 ± 0.30%), 80% SE (1.95 ± 0.32%) and 90% SE, and 80% SE and 100% SE (all P < 0.05), indicating that CV was significantly higher at lower SE levels. No significant differences were found between 60% SE and 80% SE or between 90% SE and 100% SE.
; according to percentage of subjective effort (SE) in sprint running. A, CV for 60-m sprint time; B, CV for average speed between 40 and 50 m.")
Changes in intra-individual variation (coefficient of variation (CV); according to percentage of subjective effort (SE) in sprint running. A, CV for 60-m sprint time; B, CV for average speed between 40 and 50 m.
For SP, there was also a significant difference in intra-individual variability (CV) across the five trials between the four SE levels (Figure 2 P < 0.05). Post hoc tests showed that the CV at 60%SE (3.04 ± 0.55%) was significantly greater than at 90% SE (2.06 ± 0.39%) and 100% SE (2.20 ± 0.43%) (P < 0.05). No significant differences were found between the other SE levels.
A repeated measures ANOVA (2 × 4) was conducted to examine the interaction between disciplines (short-distance sprint vs. long-distance sprint) and SE on intra-individual variation, but no significant differences were found.
4.4. Change in Sprint Variables with Change in Subjective Effort
A significant difference was found when comparing the average step frequencies throughout the 60 m sprint across each SE level using a repeated measures ANOVA (P < 0.05). Post hoc tests revealed significant differences between all SE group comparisons (Figure 3A), with higher SE levels corresponding to higher step frequencies.
 in sprint running. There were significant differences between all comparisons of different SE groups. As SE increased, stride length decreased and step frequency increased.")
Changes in biomechanical variables; A, Stride length; B, Step frequency according to percentage of subjective effort (SE) in sprint running. There were significant differences between all comparisons of different SE groups. As SE increased, stride length decreased and step frequency increased.
A significant difference was also found when comparing the average stride length throughout the 60 m sprint across SE levels using repeated measures ANOVA (P < 0.05). Post hoc tests indicated significant differences among all SE group comparisons (Figure 3B), with higher SE levels corresponding to shorter stride lengths.
5. Discussion
This study aimed to examine the intra- and inter-individual variability of SE in submaximal sprint running. We hypothesized that sprinting at higher SE levels would result in less variability both within and between individuals. Overall, the results of this study support our hypothesis.
5.1. Relationship Between Subjective Effort and Coefficient of Variation
In terms of inter-individual variability, as hypothesized, we found that at higher SE levels, the CV was smaller. These results align with the findings of a previous study (22). Muraki et al. reported that the inter-individual variability of running speed tended to decrease as the SE level increased to 90% or more (22); our study shows that this trend persists across a wider range of SE levels. Therefore, when coaches use SE to adjust sprint intensity, the association between lower SE levels and higher inter-individual variability should be taken into account.
We also observed smaller intra-individual variability in sprint performance at higher SE levels, as hypothesized. The CV for 60T was smaller at higher SE levels, with statistically significant differences observed for all comparisons except 60% vs. 80% and 90% vs. 100%. The CV for SP was also smaller at higher SE levels, with significant differences when comparing SP at 60% SE with that at 90% and 100%. These results suggest that there is more intra-individual variation when SE is below 80%. The question of whether the reliability of perceived exertion varies with exercise intensity is critical for the practical use of this measurement. However, there are limited reports on the relationship between exercise intensity and variability in perceived exertion.
Although we observed lower variability in performance at higher SE levels, the variability was consistently small across all SE levels. Intra-individual variability in SP ranged from 2.06% to 3.04%. Coffey et al. examined changes in various indicators before and after a repeated sprint running protocol and found that the CV for visual analog scale scores for muscle soreness was 49.2%, while the CV for subjective well-being measures was 5.9% (23). Mann et al. studied inter-individual variability in RPE during running at 70% VO2max and reported that the CV for RPE in trained participants was 12% (24). Scott et al. assessed the test-retest reliability of the CR10 and CR100 sRPE scales in an intermittent running test (20) and found that the CVs for both methods were over 30%. Therefore, the inter- and intra-individual variability in SE levels during sprint running recorded in this study is comparatively small.
5.2. Relationship Between Subjective Effort and Sprint Performance
In this study, we found several common associations between sprinters' SE and actual performance. First, in submaximal sprinting, the ratio of actual running speed to maximal sprinting was higher than the prescribed SE: On average, participants' speed was 89.72% for 60% SE, 95.50% for 80% SE, and 98.11% for 90% SE. In other words, a 10% difference in SE results in only a (2 - 3) % difference in actual running speed.
Second, our results suggest that biomechanical variables change as SE increases. At higher SE levels, sprinters increase their running speed by shortening their stride length and increasing their step frequency. Although this seems counterintuitive when considering the basic principle that speed equals stride length multiplied by step frequency, similar findings have been reported in previous studies (12, 22, 25). Hasebe et al. investigated performance and kinematic differences between overground and treadmill running using SE (30%, 50%, and 70%) (12) and found that subjects adjusted their speed by step frequency rather than stride length during overground running. Hunter et al. explored the negative interaction between step length and step frequency (25). They found that vertical takeoff velocity was the main source of this negative interaction. As running speed decreases, ground contact time increases, leading to increased vertical velocity and longer flight time, which results in longer stride length and reduced step frequency.
Several limitations of this study should be noted. First, all participants belonged to the same university Track & Field club. Participants specializing in the same event may have similar relationships between SE and actual performance because they train together regularly. However, our data showed no significant differences in the relationships between SE and CV for short-distance and long-distance sprinters. While event specialization may affect inter-individual variability, it is unlikely to impact intra-individual variability, so this limitation probably did not affect our main findings.
Second, we used the CV of sprint performance over 5 days as a measure of variability, but a longer study period would increase the robustness of our results. Nevertheless, the relationship between SE and CV in this study was statistically significant, indicating that our procedures appropriately assessed the reliability of individual performance. Third, we were unable to account for environmental factors (e.g., wind and temperature) during the experiments. However, since running at all SE levels was measured on the same day in random order, this limitation likely had minimal impact on SE comparisons.
Fourth, we did not analyze the effect of trial order or individual differences. Further research is needed to determine whether individual characteristics influence SE variability. However, in this study, performance level was not associated with variability in SE. Finally, since the participants were Track & Field sprinters, these findings may not be generalizable to athletes from other sports. Future research is needed to examine SE-related variations in sprint performance across athletes from different sports.
Despite these methodological limitations, we have provided valuable insights into the feasibility of using SE during sprint running. The results of this study suggest that athletes and coaches may be able to utilize SE to prevent injuries during sprint running. Athletes can monitor their training load and avoid excessive strain by recording their SE and running distance during daily sprint training.
Although SE during sprint running is a useful indicator of exercise intensity, further research is needed to establish its effectiveness in preventing injuries and improving performance across various sports. Sports such as swimming, cycling, and skating, which are similar to track and field as record-setting sports, may also benefit from the use of subjective effort as a training tool. It is essential to clarify the relationship between training load measured via SE and its impact on performance and injury risk. Additionally, it is necessary to investigate whether measuring running intensity using SE is equally reliable for different subjects (e.g., women, athletes from team sports) and under various conditions (e.g., different distances, ground surfaces).
5.3. Conclusions
Track & Field coaches sometimes attempt to control training loads appropriately by referring to athletes' SE. The findings of this study suggest that this coaching method is reliable: The CV of sprint performance at all SE levels above 60% was below 5%, and running speed at 90% SE was as stable as at maximal sprint effort.
While SE is useful for sprinters, the results of this study highlight several considerations for athletes and coaches when adjusting running exercise intensity based on SE. First, performance tends to become slightly unstable as SE decreases, indicating that SE is more effective at higher running intensities. Second, changes in SE also result in changes in running behavior: Sprinters tend to emphasize higher step frequency at high SE levels and longer stride lengths at low SE levels. Since high running speed is achieved through both high step frequency and long stride length, performance may be enhanced by appropriately adjusting SE to maintain longer stride lengths at higher SE levels.
