


1. Background
With the trend of an aging society, osteoporosis and fractures have become major public health problems worldwide (1). Among patients with osteoporosis, more than 40% of women and 20% of men may experience osteoporotic fractures in their lifetime (2). The decrease in bone mass is a phenomenon of the normal aging process, influenced by factors such as gender, race, and heredity (3). Many studies have shown that certain daily life behaviors, such as smoking, diet, and exercise, can affect the loss of bone mineral density (BMD) in the elderly, thereby impacting the occurrence and development of osteoporosis (4, 5). Recent studies have found that long-term sedentary behavior (SB) and lack of physical activity (PA) can lead to rapid bone loss by reducing the gravitational load on bones (6). However, current research on daily SB and PA does not consistently align with the influence of PA on osteoporosis.
Moderate and vigorous physical activity (MVPA) has also been found to alter the body composition and muscle strength of osteoporosis patients, thereby improving their physical function and reducing their risk of falls and fractures (7, 8). Many studies have confirmed the influence of body weight, lean body mass, fat mass, and muscle strength on BMD (9). Due to the stimulating effect of larger body weight on the osteogenic response, it can promote the growth of bone tissue. Many studies have shown that individuals with greater weight also have larger lean body mass, which significantly reduces their risk of osteoporosis. Conversely, low body weight or muscle weight reduction and the accompanying decrease in muscle strength can affect BMD and overall movement stability, greatly increasing the risk of falls, which is also a factor affecting the bone health of the elderly (10). Additionally, compared to men, the overall bone health of women is related to various factors such as protein intake, calcium intake, estrogen metabolism, and the presence of other diseases (11).
To sum up, to maintain healthy bones and avoid fractures induced by osteoporosis, we should not only rely on regular monitoring of bone tissue but also comprehensively incorporate PA participation and body composition management into the evaluation system.
2. Objectives
As the relationship between PA, body composition, and osteoporosis has not been completely clarified, this study primarily explores the factors affecting BMD in obese women by observing the correlation between SB, PA, and body composition, as well as whole-body and regional BMD in obese middle-aged and elderly women. We hypothesized that MVPA might correlate with BMD through the mediation of fat-free mass (FFM) or body weight.
3. Methods
3.1. Participants
A total of 155 subjects were recruited for this study, of which 112 were eligible, with an average age of 64.1 ± 5.4 years. The inclusion criteria were as follows: (1) Postmenopausal women; (2) aged 50 - 80 years; (3) body fat percentage ≥ 30%; (4) understanding the entire process of the experiment, voluntarily cooperating, and signing the informed consent form. Subjects who had been taking BMD-improving drugs for the past two years or who had undergone hip or knee replacement surgery, or had any comorbidities affecting BMD, body composition, and PA measurements in the past year, were excluded. This study adheres to the principles of the Helsinki Declaration, and ethical approval for all experimental procedures involving human subjects was granted by the China Institute of Sport Science’s Ethics Board (approval number: CISSIRD-201806).
3.2. Measurements
3.2.1. Anthropometric Profile
Body weight and height were measured using a height and weight meter (RGz-120, Changzhou, China). The Body Mass Index (BMI) was calculated using the formula:
According to the WHO Asian-BMI classification, all subjects in this study are categorized as class I obesity (25 < BMI < 30).
3.2.2. Bone Mineral Density and Body Composition
Dual-energy X-ray absorptiometry (DEXA) (GE Lunar Prodigy, USA) was used to quantify BMD of the whole body, lumbar spine, and proximal femur. The proximal femoral area BMD test includes three areas: The femoral neck, Ward’s triangle, and the greater trochanter. The DEXA testing instrument was calibrated daily before use. Subjects were required to remove metal objects and hard nonmetallic substances to ensure that dual-energy X-rays were not affected by other substances. Body composition data were captured. The BMD and body composition test required subjects to lie in the supine position with their arms positioned alongside their bodies, and the overall process took about 30 minutes. The prevalence of osteopenia and osteoporosis was assessed based on t-values for the whole-body region. According to WHO criteria (12), a t-value ≥ -1.0 was classified as normal bone mass; a t-value between -1.0 and -2.5 was classified as osteopenia; a t-value ≤ -2.5 was classified as osteoporosis.
3.2.3. Sedentary Behavior and Physical Activity Measurement
The daily PA of the participants was collected using a triaxial accelerometer (Actigraph GT3X-BT, USA) over seven free-living days. The accelerometer was worn by participants on their right hip. Participant data were included in the analyses if accelerometers were worn for at least 600 minutes per day on a minimum of 4 days. The intensity of PA is defined using acceleration count thresholds in international standards (13), where PA values < 100 counts per minute (cpm) are classified as SB, 100 - 1951 cpm as light physical activity (LPA), and > 1952 cpm as MVPA. The number of sustained periods of SB and PA were derived and divided by the number of valid days to calculate the average time per day.
3.3. Statistical Analysis
SPSS 26.0 statistical software was used to analyze the data. Data were reported as Mean ± SD. The participants were categorized into two groups according to the t-value of their whole body. After conducting a normal distribution test on all data, the difference between the two groups was determined by conducting an independent sample t-test. The correlations between sedentary time, PA duration, body composition, and BMD were analyzed using Pearson linear correlation. Multivariable linear regression models adjusted for age were used to examine the association of PA variables and body composition variables with whole-body BMD.
4. Results
4.1. Participant Anthropometric and Bone Mineral Density Characteristics
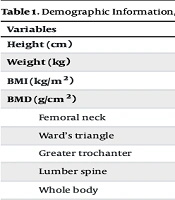
In this study, data that completed the anthropometric, BMD, body composition, and PA level measurements were regarded as valid, resulting in a final sample size of 112 (normal group: N = 63 and osteopenia group: N = 49) (Table 1).
| Variables | Normal (N = 63) | Osteopenia (N = 49) | All (N = 112) |
|---|---|---|---|
| Height (cm) | 157.3 ± 4.9 | 156.9 ± 5.6 | 157.1 ± 5.2 |
| Weight (kg) | 64.6 ± 8.7 | 60.2 ± 7.6 b | 62.7 ± 8.5 |
| BMI (kg/m2) | 26.1 ± 3.3 | 24.4 ± 2.6 b | 25.4 ± 3.1 |
| BMD (g/cm2) | |||
| Femoral neck | 0.86 ± 0.079 | 0.72 ± 0.059 b | 0.80 ± 0.099 |
| Ward’s triangle | 0.69 ± 0.10 | 0.54 ± 0.056 b | 0.63 ± 0.11 |
| Greater trochanter | 0.77 ± 0.072 | 0.63 ± 0.056 b | 0.71 ± 0.098 |
| Lumber spine | 1.07 ± 0.17 | 0.91 ± 0.096 b | 1.00 ± 0.16 |
| Whole body | 0.96 ± 0.079 | 0.79 ± 0.056 b | 0.89 ± 0.11 |
| t-score | |||
| Femoral neck | -0.54 ± 0.68 | -1.75 ± 0.49 b | -1.07 ± 0.85 |
| Ward’s triangle | -1.25 ± 0.68 | -2.27 ± 0.38 b | -1.69 ± 0.76 |
| Greater trochanter | 0.14 ± 0.66 | -1.19 ± 0.50 b | -0.44 ± 0.89 |
| Lumber spine | -0.40 ± 1.38 | -1.69 ± 0.83 b | -0.97 ± 1.33 |
| Whole body | -0.09 ± 0.61 | -1.44 ± 0.39 b | -0.68 ± 0.85 |
Abbreviations: BMI, Body Mass Index; BMD, bone mineral density.
a Values are expressed as Mean ± SD.
b A P ≤ 0.01 is considered statistically significant.
By grouping subjects according to the t-score of the whole body, no significant difference P > 0.05) in height was observed between the normal group and the osteopenia group. The body weight and BMI of the osteopenia group were lower than those in the normal group (all P < 0.01). The osteopenia group presented lower BMD of the femoral neck, Ward’s triangle, trochanter, lumbar spine, and whole body compared to the normal group (all P < 0.01). Additionally, the osteopenia group exhibited lower t-scores for the femoral neck, Ward’s triangle, trochanter, lumbar spine, and whole body compared to the normal group (all P < 0.01).
4.2. Body Composition Data Comparison Between Normal and Osteopenia Subjects
The comparison of body composition data is shown in Table 2. The normal group presented significantly higher fat mass, FFM, and body fat percentage than the osteopenia group (P < 0.01, P < 0.05, P < 0.05).
a Values are expressed as Mean ± SD.
b A P ≤ 0.01 is considered statistically significant.
4.3. Sedentary and Physical Activity Time Comparison Between Normal and Osteopenia Subjects
The comparison of sedentary and PA data is shown in Table 3. By comparing SB and PA time between the two groups, no significant difference was found between the normal group and the osteopenia group in the time of SB, SB breaks, and the time of LPA and MVPA (all P > 0.05).
| Variables | Normal (N = 63) | Osteopenia (N = 49) |
|---|---|---|
| Wear time (min/d) | 791.5 ± 122.4 | 753.4 ± 116.2 |
| Sedentary time (h/wk) | 55.3 ± 11.7 | 55.2 ± 12.0 |
| Breaks in SB | 92.2 ± 26.3 | 92.4 ± 25.9 |
| Light PA (min/wk) | 1795.6 ± 477.9 | 1704.1 ± 534.7 |
| MVPA (min/wk) | 187.9 ± 110.4 | 212.4 ± 150.2 |
Abbreviations: SB, sedentary behavior; PA, physical activity; MVPA, moderate to vigorous physical activity.
aValues are expressed as Mean ± SD.
4.4. Relationship Between Sedentary Behavior, Physical Activity, and Body Composition
Table 4 shows that the negative correlation between the sedentary time of obese middle-aged and elderly women and body weight, fat mass, and body fat percentage was of minimal magnitude (all P < 0.05), but no significant correlation was found between sedentary time and FFM (P > 0.05). The number of sedentary breaks was negatively correlated with body weight, fat mass, and FFM to a very low degree (all P < 0.05). No significant correlation was found between the duration of LPA and body weight, fat mass, and body fat percentage (all P > 0.05). The negative correlation between the duration of MVPA and fat mass, and body fat percentage was of minimal magnitude (all P < 0.05), but no significant correlation was found between the duration of MVPA and body weight, and FFM (all P > 0.05).
| Variables | Weight | Fat Mass | FFM | Body Fat Percentage |
|---|---|---|---|---|
| Sedentary time (h/wk) | ||||
| R | -0.227 | -0.238 | -0.157 | -0.216 |
| P | 0.016 | 0.012 | 0.098 | 0.022 |
| Breaks in SB | ||||
| R | -0.241 | -0.225 | -0.205 | -0.173 |
| P | 0.01 | 0.017 | 0.03 | 0.068 |
| LPA (min/wk) | ||||
| R | -0.004 | -0.072 | 0.093 | -0.151 |
| P | 0.971 | 0.453 | 0.331 | 0.111 |
| MVPA (min/wk) | ||||
| R | -0.173 | -0.247 | -0.027 | -0.293 |
| P | 0.068 | 0.009 | 0.779 | 0.002 |
Abbreviations: FFM, fat-free mass; SB, sedentary behavior; LPA, light physical activity; MVPA, moderate to vigorous physical activity.
4.5. Relationship Between Sedentary Behavior, Physical Activity, and Bone Mineral Density
It can be seen from Table 5 that there was no significant correlation between sedentary time, SB breaks, the time of LPA, the time of MVPA, and whole-body BMD, as well as BMD of the femoral neck, Ward’s triangle, greater trochanter, and lumbar spine (all P > 0.05).
| Variables | BMD of Proximal Femur | BMD of Lumber Spine | BMD of Whole Body | ||
|---|---|---|---|---|---|
| Femoral Neck | Ward’s Triangle | Greater Trochanter | |||
| Sedentary time (h/wk) | |||||
| R | -0.068 | -0.074 | -0.116 | -0.140 | -0.114 |
| P | 0.481 | 0.446 | 0.224 | 0.147 | 0.244 |
| Breaks in SB | |||||
| R | -0.058 | -0.072 | -0.149 | -0.137 | -0.116 |
| P | 0.547 | 0.457 | 0.116 | 0.155 | 0.235 |
| LPA (min/wk) | |||||
| R | -0.006 | -0.046 | 0.058 | 0.017 | 0.065 |
| P | 0.951 | 0.636 | 0.546 | 0.863 | 0.508 |
| MVPA (min/wk) | |||||
| R | 0.063 | -0.006 | 0.036 | 0.001 | 0.060 |
| P | 0.512 | 0.948 | 0.706 | 0.990 | 0.539 |
Abbreviations: BMD, bone mineral density; SB, sedentary behavior; MVPA, moderate to vigorous physical activity.
In multivariable linear regression analysis, no significant association was found between whole-body BMD and all PA variables (Table 6).
| Variables | β (95% CI) | P-Value |
|---|---|---|
| Sedentary time (h/wk) | -0.000002 (-0.00003 - 0.000026) | 0.887 |
| Breaks in SB | -0.000023 (-0.001 - 0.001) | 0.954 |
| LPA (min/wk) | -0.000006 (-0.00005 - 0.000034) | 0.769 |
| MVPA (min/wk) | -0.00001 (-0.00017 - 0.00015) | 0.902 |
Abbreviations: SB, sedentary behavior; LPA, light physical activity; MVPA, moderate to vigorous physical activity.
4.6. Relationship Between Body Composition and Bone Mineral Density
Table 7 shows that there is a positive correlation between body weight and femoral neck BMD (R = 0.332, P < 0.01), Ward’s triangle BMD (R = 0.302, P < 0.01), greater trochanter BMD (R = 0.383, P < 0.01), and whole-body BMD (R = 0.325, P < 0.01). A moderate positive correlation was found between body weight and lumbar spine BMD (R = 0.530, P < 0.01). There was a positive correlation between FFM and femoral neck BMD (R = 0.351, P < 0.01), Ward’s triangle BMD (R = 0.306, P < 0.01), greater trochanter BMD (R = 0.347, P < 0.01), and whole-body BMD (R = 0.309, P < 0.01) to a low degree. A positive correlation was found between FFM and lumbar spine BMD (R = 0.521, P < 0.01) to a moderate degree. A very low positive correlation was found between fat mass (FM) and femoral neck BMD (R = 0.259, P < 0.01), Ward’s triangle BMD (R = 0.247, P < 0.01), and whole-body BMD (R = 0.278, P < 0.01). A positive correlation was found between FM and BMD in the greater trochanter (R = 0.342, P < 0.01) and BMD in the lumbar spine (R = 0.447, P < 0.01). Only a positive correlation was found between body fat percentage and BMD in the greater trochanter region (R = 0.238, P < 0.05) and lumbar spine to a very low degree (R = 0.299, P < 0.01).
| Variables | BMD of Proximal Femur | BMD of Lumber Spine | BMD of Whole Body | ||
|---|---|---|---|---|---|
| Femoral Neck | Ward’s Triangle | Greater Trochanter | |||
| Body weight (kg) | |||||
| R | 0.332 | 0.302 | 0.383 | 0.530 | 0.325 |
| P | 0.0001 | 0.001 | 0.0001 | 0.0001 | 0.001 |
| Fat mass (kg) | |||||
| R | 0.259 | 0.247 | 0.342 | 0.447 | 0.278 |
| P | 0.006 | 0.01 | 0.0001 | 0.0001 | 0.004 |
| Fat free mass (kg) | |||||
| R | 0.351 | 0.306 | 0.347 | 0.521 | 0.309 |
| P | 0.0001 | 0.001 | 0.0001 | 0.0001 | 0.001 |
| Body fat percentage (%) | |||||
| R | 0.150 | 0.153 | 0.238 | 0.299 | 0.187 |
| P | 0.117 | 0.114 | 0.011 | 0.002 | 0.054 |
Abbreviation: BMD, bone mineral density.
In multivariable linear regression analysis, a significant association remained between whole-body BMD and body weight [β = 0.003, 95% CI (0.001; 0.006), P = 0.005], FM [β = 0.005, 95% CI (0.001; 0.008), P = 0.008], and FFM [β = 0.006, 95% CI (0.001; 0.011), P = 0.023] (Table 8).
| Variables | β (95% CI) | P-Value |
|---|---|---|
| Body weight (kg) | 0.003 (0.001 - 0.006) | 0.005 |
| Fat mass (kg) | 0.005 (0.001 - 0.008) | 0.008 |
| Fat free mass (kg) | 0.006 (0.001 - 0.011) | 0.023 |
5. Discussion
The BMD is a critical indicator for measuring the extent of osteoporosis. This study primarily employed DEXA to scan the BMD of middle-aged and elderly class I obese women and investigated the relationship between BMD, body composition, and PA. Baseline data from this study revealed that among the two groups of obese middle-aged and elderly women, the lumbar spine presented the highest BMD, while Ward’s triangle presented the lowest BMD. The t-score in Ward’s triangle was the lowest, whereas the t-score in the greater trochanter was the highest, which is consistent with the findings of some other studies (14, 15). Although it is indicated that the prevalence of osteoporosis in postmenopausal women aged 50 to 80 can be as high as approximately 20% (16), none of the subjects were found to have osteoporosis among the 112 obese middle-aged and elderly women aged 50 to 80 in this study (t-score less than -2.5).
In the past two decades, many studies have focused on the impact of body weight on bone tissue. A large number of epidemiological studies and randomized controlled trials have confirmed that regardless of gender or age, the larger the body weight or BMI, the higher the level of BMD (17, 18). In this study, it was found that the body weight of elderly women with reduced bone mass was significantly lower than that of those with normal bone mass, which is consistent with previous studies. Body weight is composed of different body components, and different body components are associated with BMD to varying degrees. This study found that in obese middle-aged and elderly women, FFM was more strongly correlated with proximal femur BMD, lumbar spine BMD, and whole-body BMD than FM was. This is similar to many studies, which suggest that the relationship between FFM and BMD is stronger than that between fat mass. Winters and Snow (19) found that FFM is the strongest predictor of BMD at the proximal femur, explaining approximately 10% of the variability in BMD. In contrast, Dytfeld et al. (20) demonstrated that FM is more strongly associated with BMD at the femoral neck in postmenopausal women with osteoporosis than FFM. It is evident that the extent of the relationship between body composition and BMD varies among different populations. However, higher FFM or lower body fat content is associated with a significantly lower risk of osteoporosis (21). In this study, since all participants were class I obese women, osteoporosis was not observed. The primary reason for this is their relatively high body weight, followed by their higher fat mass. Although obesity prevents the development of osteoporosis, it is noteworthy that it may significantly increase their risk of cardiovascular diseases (22) and type 2 diabetes (23).
Extensive research has demonstrated a close relationship between PA and body fat mass, with daily PA preventing excessive accumulation of body fat (24). This study collected data on participants’ PA using accelerometers and found that there were no significant differences in sedentary duration, LPA, and MVPA between the normal group and the osteopenia group. However, significant differences were found in body weight, body fat mass, and FFM between the two groups. Additionally, the analysis of the correlation between body composition and PA revealed a very low correlation between daily PA habits and body composition. Based on the above research results, we can also infer that the daily PA levels of middle-aged and elderly obese women are similar, despite significant differences in body weight and body fat. Since they all belong to the obese population, we can indirectly speculate that the differences in their PA levels are not sufficient to cause significant changes in body composition. Consequently, this is also not enough to stimulate bone health through PA. This is consistent with guidelines on PA for weight loss proposed by authoritative institutions such as the American College of Sports Medicine (ACSM) and findings from previous research (25-27). These studies have all highlighted the importance of considering the intensity and volume of exercise for weight loss and fat reduction in different populations.
Previous studies have found that low BMD is one of the main causes of fractures in middle-aged and elderly women, making various strategies to stimulate bone tissue particularly important, as they can significantly reduce the risk of fractures caused by osteoporosis. Although BMD can be improved through certain pharmacological means, PA has been verified to favorably influence the maintenance of bone mass and delay the progression of osteoporosis. The PA refers to any body movement caused by skeletal muscle contraction that leads to energy consumption, including occupational, transportation, daily life PA, and leisure time sports exercise. Studies on the use of various forms, contents, and intensities of PA for the prevention and treatment of osteoporosis have been reported. After reviewing 59 related studies, Pinheiro et al. (28) indicated that PA impacts the BMD of the lumbar spine, but no significant effect was found on the BMD of the femoral neck, and some high-intensity and compound training or resistance training seem to be more effective in stimulating bone density. Varahra et al.’s study also found that high-intensity comprehensive training is more effective in intervening in osteoporosis than other exercise methods (8). Zheng et al. found that after a year of maintaining a 60-minute exercise session, 3 - 4 times a week in postmenopausal women, a training form that combines aerobic endurance, resistance, and impact exercises can effectively improve bone mass in postmenopausal women, while the control group did not effectively stimulate bone tissue due to insufficient total intensity of daily activity (29). Many systematic reviews have clearly suggested that progressive resistance training or activities that combine resistance training with a certain load on body weight, such as walking and Tai Chi, which produce lighter loads on body weight, improved the lumbar spine and femoral neck BMD more effectively than those that produce lighter loads (30, 31).
At the same time, some studies have also shown that long-term excessive SB (such as sitting for a long time without moving) can lead to a decrease in bone mass by reducing the gravitational effect on bones (32, 33). Therefore, certain conditions must be met to achieve a sufficient stimulus to the bone tissue. Moreover, findings from previous reviews suggest that only high-intensity exercise (> 80% 1RM, > 4 × bodyweight GRF) appears to improve structural parameters of bone strength (34). In this study, there was no significant correlation between SB, LPA, and MVPA in obese middle-aged and older women with BMD of the proximal femur, lumbar spine, and whole body. This may be due to the fact that most daily physical activities in obese middle-aged and older women are SBs and low-intensity physical activities, with medium to high-intensity PA lasting about 2.5 - 3 hours per week (average 20 - 30 minutes/day), and the forms of PA are not uniform. In addition, most of their physical activities may tend to be daily exercise forms (such as walking and housework), with few occurrences of impact or resistance exercises. However, the positive effects of daily PA on bone density have been reported by several studies. For example, a cohort study including more than 6,000 postmenopausal women aged 50 to 79 found that PA positively improved bone health, and when the response of bones to load increased, bones became stronger and the risk of fractures decreased (35). In summary, the results of this study and related research indirectly reflect that PA has a certain relationship with the effect on BMD, which is related to the form of exercises, the type of exercises, and the intensity of exercises; the dose-response relationship between exercise and osteoporosis still needs further in-depth research (36).
5.1. Conclusions
Body composition indicators such as body weight, FFM, and FM play significant roles in influencing the BMD of obese middle-aged and elderly women. The SB, LPA, and MVPA observed in this study did not show a significant correlation with BMD across various regions and the whole body. Daily physical activities in obese middle-aged and elderly women did not significantly stimulate BMD improvements through the regulation of body composition. The patterns and effects of regular exercise on BMD in obese middle-aged and elderly populations need to be investigated in the future, especially focusing on different resistance training and intensities of PA interventions. This could help in understanding how structured physical activities might positively impact BMD in this specific obese population.
