1. Background
Kicking performance is the most studied technical action in soccer (1), and a growing body of research has been dedicated to studying penalty kick performance (2). Information regarding the “number of kicks” and “number of kicks on target”, usually provided by notational analysis, are important indicators of success in high level competition (3), and it illustrates the need to understand and train such motor skills. Previous studies examined the differences in kicking kinematics utilizing a stationary ball and compared dominant versus non-dominant limbs (4), gender (5, 6), soccer cleats (7), kicking techniques (8, 9), skill levels (10) and age (11) using a penalty shoot-out format or distances less than 11 meters from the goal plane. Despite the extensive literature regarding kicking, studies related to the characteristics of free kicks are significantly less (12); despite such free kicks being an important opportunity for scoring in a match (13), with indexes of 6% to 12%, as previously reported (14).
However, in the last FIFA U-17 World Cup UAE 2013, only three out of the 172 goals were scored from free kicks (15), indicating that, at this level, success in this kind of situation may be more complex. The strength impressed on the ball when kicking, foot-ball contact, wind direction and velocity, body segments kinematics (16), location on the field where the kick is performed, target aimed at when kicking (17); and ball flight characteristics have been pointed out as elements that influence the performance of free kicks (18).
As previously highlighted, lower limbs kinematics are closely related to success in kicking, especially where the transferal of high velocity to the ball is concerned (1). High ball velocities are associated with thigh peak angular velocity, foot velocity relative to the knee, peak knee velocity relative to the hip (19), peak knee extension velocity (20), last step length of the kick approach (21), distance between the support foot and the ball (22), the foot-ball contact surface area (4, 5), and foot velocity (10).
The players’ nationality is an aspect that might also be relevant to performance in kicking. Dellal et al. (23) demonstrated that different European soccer leagues exhibit different physical demands and technical performances in matches. However, it has not been reported yet whether there is any evidence of the influence of nationality on the kinematics of soccer-related skills. According to data published by FIFA (www.fifa.com), the Brazilian U-17 national team’s goal average is higher than Japan’s (15), although college players from both nationalities show similar ball velocities in their kicking performances (21.62 - 24.27 m.s-1 and 25.8 - 28.4 m.s-1, respectively (24-27)).
The analysis of the results in the literature regarding the performances of players from different countries is difficult because of the differences in the methods used for data collection (23) and in the kinematic variables chosen to represent phenomena related to the performance. For example, for Brazilian players, kicking kinematics have already been described for hip flexion, knee extension, and ankle dorsi-flexion angular velocity at foot-ball contact (25, 26). For Japanese players, the kinematic variables have already described thigh and shank angular velocity, as well as the knee peak angular moment (27). In addition, the studies focused on the performance of kicking in the Brazilian team sports players mentioned above were conducted with futsal players (25, 26), while studies on the Japanese population in soccer are more common (27, 28).
There is no report in the literature describing and comparing kicking kinematics between soccer players of different nationalities, at an age close to their transition to the professional level. Brazil and Japan have internationally recognized free-kick specialists, such Juninho and Keisuke Honda (13). There is also a recent interest in talent identification in soccer, thus, understanding the movement pattern in situations directly related to matches (29), such as free kicks, can help to detect athletes’ level of performance (17). Detailed characterization of kicking kinematics can also be useful to coaches as regards programing and directing their technical training. Additionally, Dellal et al. (23) showed that a direct comparison of technical performance between different leagues in different countries could be important in determining whether performance is general to all leagues or if each country has its own specific level of performance. Also, such analysis may contribute to understanding one’s adversary, during the preparation period prior to competing in international competitions. In the present study, we chose to simultaneously analyze the kick kinematics of Brazilian and Japanese players given their differences in culture (e.g. training methods and talent development models) and traditions (e.g. the results obtained in international competitions) in a soccer context, in order to further our understanding regarding kicking in soccer, as well as helping to understand these two nationalities located at opposite sides of the world.
2. Objectives
Thus, the aim of the present study was to investigate the lower limbs kinematical patterns between top level Brazilian and Japanese U-17 soccer players using side-foot kick in free kick simulation, using graphical analysis.
3. Patients and Methods
3.1. Subjects
Fourteen young U-17 top level soccer players participated in this study, and were distributed in two groups. The GA group (n = 7; identified as GA1 - GA7) consisted of Brazilian high-level youth players. The GB group (n = 7; identified as GB1 - GB7) consisted of Japanese high-level youth players. All the participants were right foot dominant. The Brazilian and Japanese players had a mean time of experience in playing soccer of 9.71 ± 1.11 and 9 ± 2 years, respectively. This information (i.e. lateral preference and time of experience in playing soccer) were self-reported by the players, before the experiment. All athletes were previously informed regarding the experiment procedures and volunteered to be part of this study. All practices were organized in keeping with the university’s institutional review board for human subjects (human research ethics committee of the Institute of Biosciences, São Paulo State University, Brazil) and were conducted in keeping with the declaration of Helsinki (protocol number#3075 of 29/06/2004). The players and their parents or guardians were informed regarding the experiment procedures and risks, and both provided a written informed consent authorizing the athletes’ participation in the study.
3.2. Experimental Design
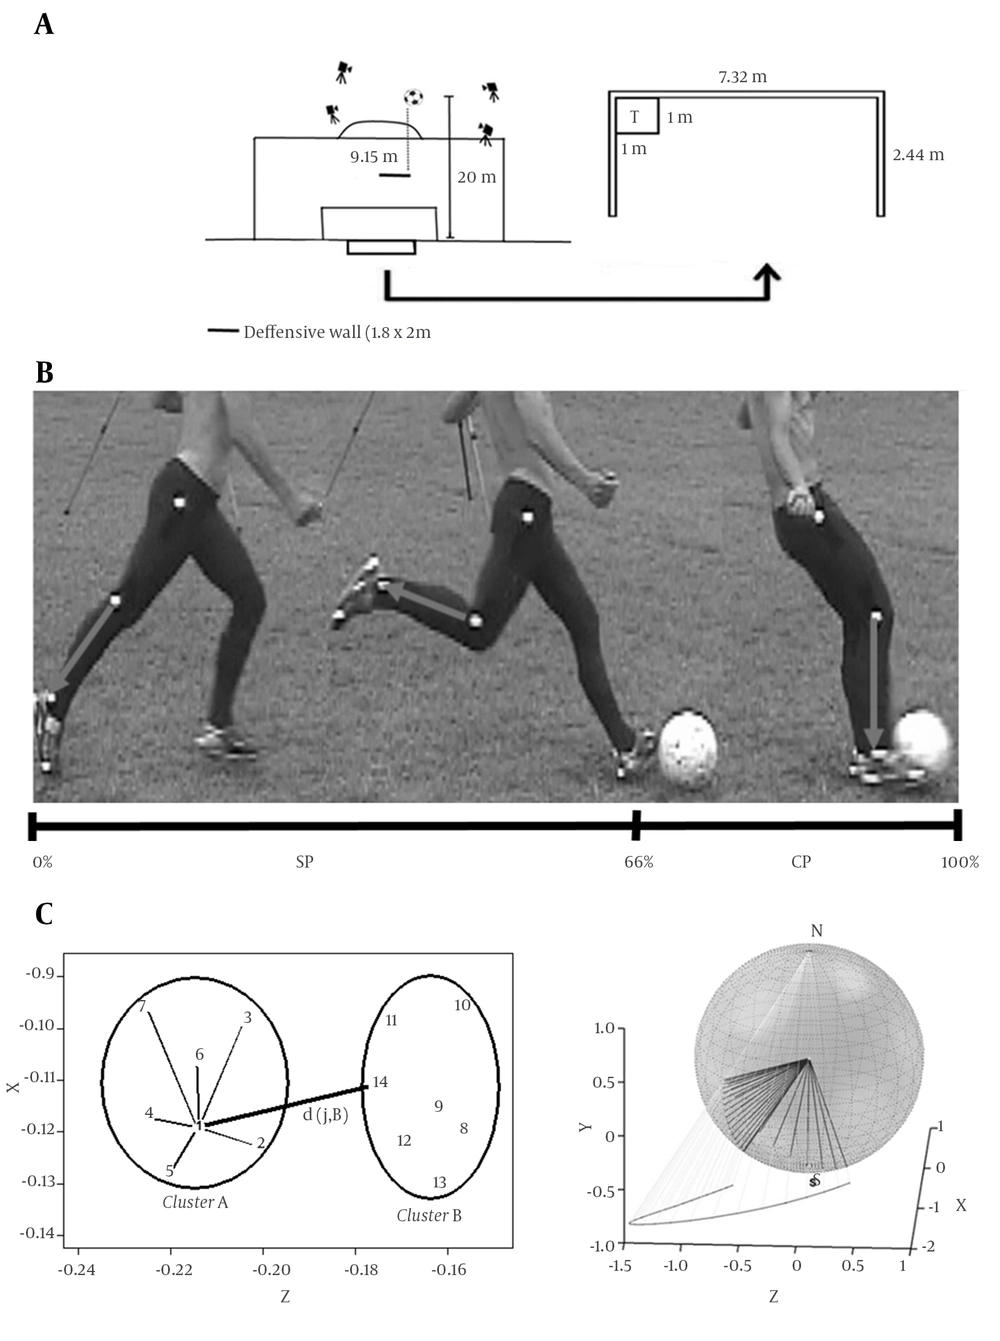
The experiment consisted of three series of five kicks (n = 15) of a stationary ball placed 20 m from the goal and perpendicular to the left goalpost. The participants were asked to perform the kicks aimed at a 1 × 1 m target set in the upper left side of the goal. The task was constrained by a 1.8 m high and 2 m long defensive wall placed 9.15 m from the ball (Figure 1A). We chose to put the target on the right side of the goal in order to make the task more difficult and guarantee that the participants had to kick the ball over the defensive wall. According to Alcock’s (17) findings, free kicks in soccer aimed at the edge of the goal tend to result in a goal or forces a difficult save by the goalkeeper. The participants were instructed to “perform the task using the medial side of their kicking foot (i.e. side-foot kick) aiming the center of the target”; however, the length and distance of the approaching steps were not restricted (i.e. self-selected by the subject) to avoid influencing the movement pattern (26). The participants rested between trials and series, ranging from 1 minute and 30 seconds to two minutes.
A, Experimental design; B, Kicking cycle and stereographic projection of the shank segment during a kick. C, Calculations of s(j) at t(i) example; Black line, normalized 3D shank movement; Gray line, projection of the shank movement in the “zx” plane, tangent to the South pole in the unit sphere; N, North pole; S, South pole.
3.3. Data Collection
The kicking and support thigh, shank and foot were determined by the estimate of the hip, knee and ankle centers through 10 passive markers, with 25 mm diameter, on the following anatomical landmarks: great trochanter, lateral femoral epicondyle, lateral malleolus, lateral calcaneus tuberosity, and fifth metatarsal head.
The experiment was recorded by four digital cameras (JVC GR-DVL9800u®; NTSC), with sample rate of 120 Hz and 1.250 second shutter speed. These cameras were properly calibrated (i.e. a calibration frame) and the reference system adopted was oriented as follows: horizontal axis (Y) positive towards the goal, lateral axis (X) positive to the right, and vertical axis (Z) positive upwards, obtained as the cross product between the unit vectors representing X and Y directions (30).
The DVIDEOW software (31) was used for (i) the camera synchronization using beeps (32), (ii) semi-automatic measurement of the markers, (iii) calibration and (iv) 3D reconstruction of the image sequences by Direct Linear Transformation method (6, 25, 26). To confirm that the cameras were synchronized correctly, we checked common events (i.e. corresponding picture frame’s) in the sequences of images from each camera (e.g. take-off of kicking foot previous to contact with the ball, contact of the support foot on the ground and foot-ball contact. To evaluate experimental errors, an accuracy test was performed based on previous research using the same software (16, 25, 26). The accuracy obtained for the reconstruction method was 0.0056 m. The player accuracy during the task was determined by the relative frequency that the ball reached the target for all attempts (26).
Before all analysis, and in an S-PLUS 4.5 environment (TIBCO Software Inc., USA) the 3D data were smoothed using the robust locally weighted regression method, LOESS quadratic fit function (25, 26, 33). The smoothing parameter was set to 0.7 after residual analysis. The following unit vectors calculated from the filtered markers’ coordinates represents how thigh, leg and foot segments were obtained:


In which || ||2 = Euclidean vector norm, LFE¯ = marker of the lateral femoral epicondyle, GFT¯ = marker of the greater femoral trochanter, MF¯ = marker of the lateral malleolus of the fibula, CA¯ = marker of the calcaneus, and TEFM¯ = marker of the toe-distal end of fifth metatarsal.
Thus, the stereographic projection (16, 30), of each unit vector representing the body segments was calculated by centering an imaginary unit sphere proximally at each of the segments. This kind of movement representation allows the identification of a kinematic pattern related to the lower limb segments. It creates an imaginary line from the north pole of a sphere that passes through the unit vector and hull, and reaches the X-Z plane tangent to the spheres’ south pole. The projection is bijective, meaning that for each location in the sphere there is only one point, which represents its projection in the plane (Figure 1B) (16, 30, 34).
For purposes of analyses, the kicking cycle was normalized and divided in two phases. The first was the support phase (SP, 0% - 65 % of the kicking cycle), characterized by the toe-off of the kicking limb through the total support foot contact on the ground. The second was the contact phase (CP, 66% - 100% of the kicking cycle), which stands for the first instant of total support foot contact on the ground to the end of the kicking foot contact with the ball (25, 26) (see for instance Figure 1B). From the data set of each participant, mean curves were taken for all three body segments and considered as the individual kinematic movement pattern for kicking.
In order to identify possible differences in the movement of the kinematic pattern between groups (GA and GB), the PAM clustering method (Partition Around Medoid) (35) was applied to the segments’ projection mean curves, initially setting the number of groups in two (Brazilian and Japanese players). With this procedure, we aimed to identify the point or interval, if any, during the kicking cycle in which the segment kinematics of each group might present any separation. The silhouette coefficient (SC) was calculated as follows, in order to determine the degree of separation between the groups’ set of kicking trials, as proposed by Kaufman and Rousseeuw (35) (see for instance (36)). The SC is obtained using the Equation 4 (see also Moura, Martins and Cunha (3)).
Let A and B be the determined set of clusters, j represents the number of data points as a function of time (t(i)) in the cluster A, and let a(j) be the mean distance between j and all the other data points in A. Let d(j,B) be the distance between j and each of the data points in the cluster B. The minimum value of d(j,B) is denominated b(j), and is the distance between j and the neighbor cluster (see for instance Figure 1C). See Equation 4:

Where s(j) is the silhouette coefficient of j each instant of time t(i). SC(i) is then the mean of s(j) for all data points j.
3.4. Statistical Analysis
To check whether there was a difference between the groups or between the stages of the kick in the analyzed segments we used a comparison of the confidence intervals of the medians represented in the boxplot of the SC values in each phase. The boxplots indicate separation between two groups if the median of SC is greater than 0.5 (3, 35) and, two medians are significantly different at the 5% significance level if their intervals do not overlap (25, 26, 37). All analyses were performed in an S-PLUS 4.5 environment (36), for both support and kicking leg.
The accuracy of the task performance is presented as a percentage and was compared between groups using paired Student’s t-test, after confirming the normal distribution of the data using the Shapiro-Wilk test. These tests were performed using the Statistical Package for the Social Sciences version 17 (SPSS Inc., USA), and P < 0.05 was adopted as significance level.
4. Results
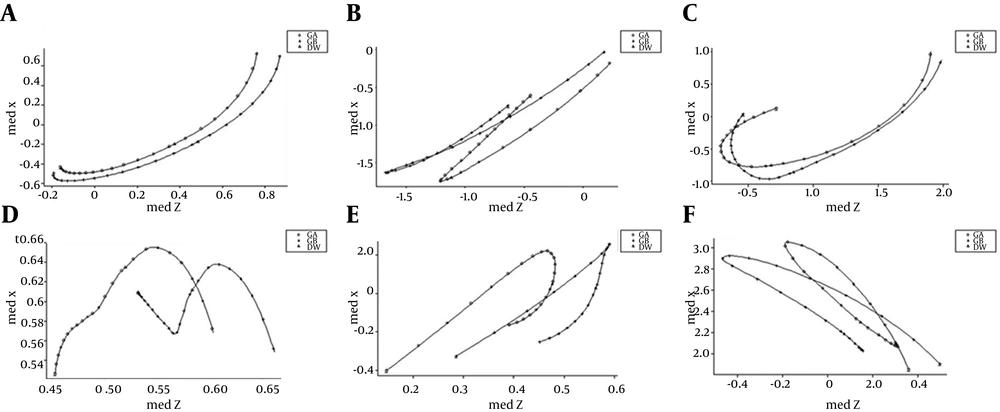
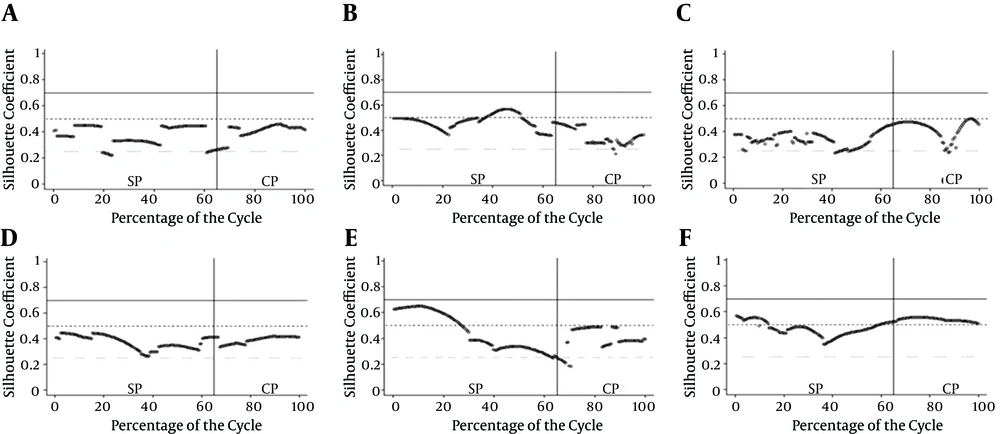
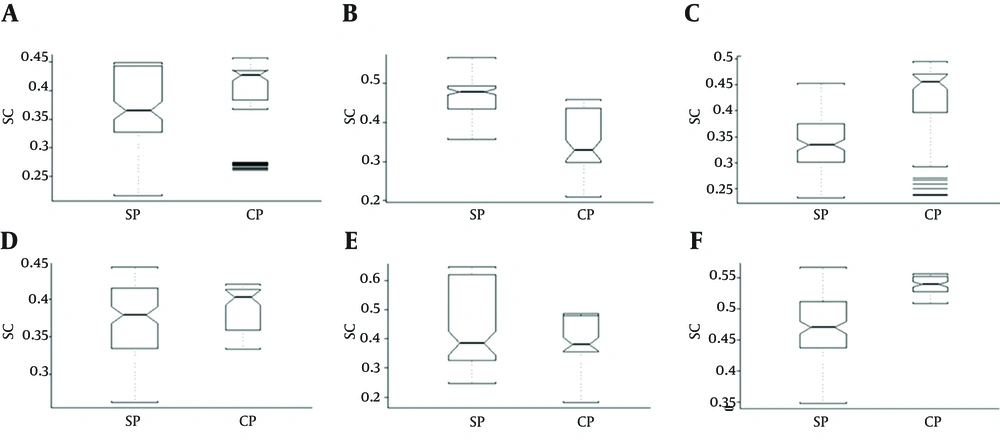
The mean curves (i.e. stereographical projection) of the support limb and kicking limb cycles for the GA and GB body segments are shown in Figure 2. Figure 3 represents the SC values for the body segments during the entire kicking cycle for both lower limbs. Figure 4 shows the boxplots of the SC values for thigh, shank and foot of the kicking and supporting limbs.
For the kicking limb, the kinematic patterns of all three segments analyzed proved to be similar between groups. The comparison of the confidence intervals corresponds to this assumption, presenting values under 0.5 of SC (Figure 4A - C). However, when we analyze the kicking cycle in Figure 3B, there is an interval of the cycle where the shank motion is different between GA and GB. This difference or separation between the shank curves is confirmed by the SC values obtained throughout the movement cycle. The difference between groups occurred between 37.5% and 52% of the cycle (Figure 3B), corresponding to the support phase during kicking.
The lower limb body segments showed similar kinematic patterns for the supporting leg in the boxplot comparison of the SC confidence intervals, reported to be under 0.5 for SP and CP (Figure 4D - E). However, when the entire kicking cycle is analyzed, two significant differences were found. The first difference was the shank motion from the beginning to 25% of the cycle (Figure 3E). The second was the foot motion from 65 to 100% of the cycle (Figure 3F), which presented a SC higher than 0.5, indicating the separation between groups at CP (Figure 4F).
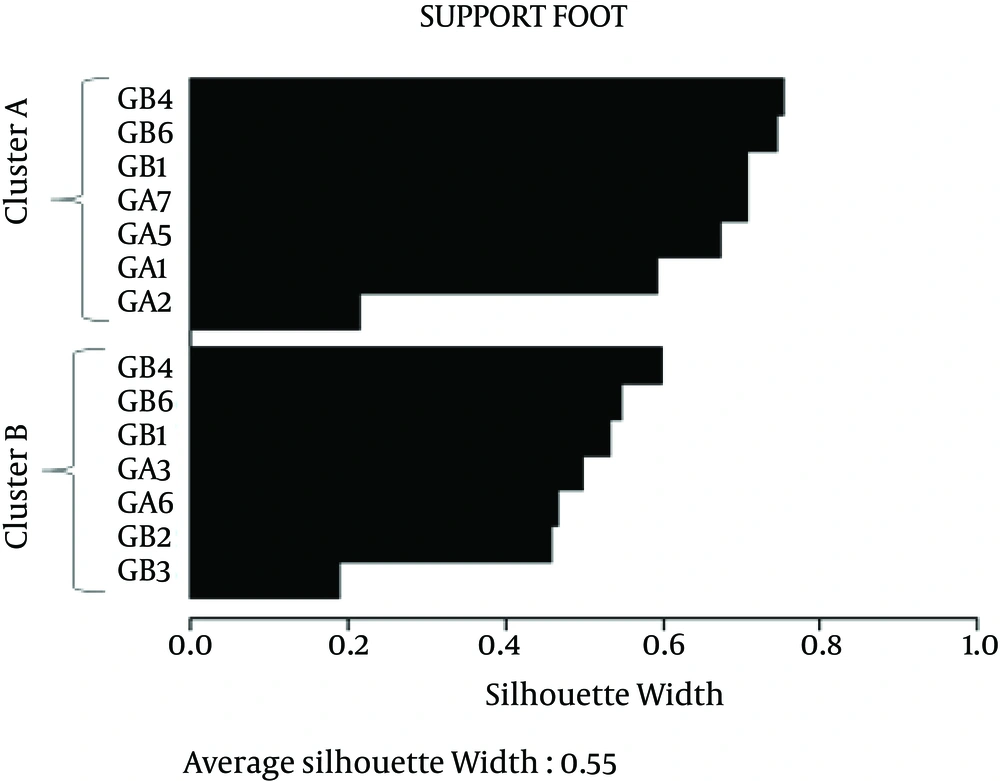
Our results indicated some differences in the support limb kinematics during contact phase between Brazilian and Japanese (Figure 3F and 4F) players. However, the cluster analysis applied to our data classified the participants GA3, GA4, GA6, GB2, GB3, GB5 and GB7 players at the same group, and participants GA1, GA2, GA5, GA7, GB1, GB4 and GB6 in another group. Thus, the possible differences found at this point for the support foot (i.e. 70% of the kicking cycle), is not due to differences between nationalities, but the discovery of similar movements between GA and GB members (Figure 5). For the other body segments, the classification obtained for SC above 0.5 also did not separate the participants by their nationality (i.e. there was no separation between the pre-established groups, but there was discovey of similar movements between members), as occurred in the above cited case. For the task accuracy results, GA and GB did not present significant differences (P = 0.88) in their percentage of accuracy (GA: mean = 10.48, s = 14.33%; GB: mean = 9.52, s = 6.51%).
5. Discussion
The main results of the present study showed that the kinematic patterns for all the body segments analyzed as regards to the support and kicking limbs are similar between Brazilian and Japanese players over the course of kicking cycle. The end-point task was also similar, given that both groups showed the same percentage of accuracy in the task, which confirms the temporal invariance between the patterns of movements performed by the two groups analyzed (26).
The movement control in kicking a stationary ball occurs in a closed-circuit fashion (26, 38), which characterizes this kick style as a well-defined movement. However, when the individual curves for the segment motion are visually analyzed, there is some variability between trials, mainly for the support foot. Studies in the literature report that kicking presents the highest variability in its performance compared to other motor actions in soccer (39, 40), and is due to the complexity inherent to its execution. The necessity of slight adjustments, identified through visual feedback (25), during the performance may contribute to this variability observed between trials.
The side-foot kicking technique is characterized by precision in driving the ball with lower ball velocity. Most soccer players choose the side-foot kick to perform penalties and free kicks near the penalty area (8, 9, 41). The stereographic projections of the thigh, shank and foot movements in the present study (i.e. Figure 2A - F) are similar to those presented in the past, in studies that compared side-foot kicking performance between groups using cluster analysis (16, 42, 43). However, the SC adopted as a threshold to separate groups used in these studies was a confidence interval ≤ 0.4, which is not as high as the threshold of 0.5 set for the present study. Thus, the SC confidence intervals found in the literature are between 0.35 and 0.48, and in cases in which the SC was found to be higher than 0.4, studies reported differences in kinematic patterns between groups. The present study based the SC threshold on Kaufman and Rousseeuw (35), and indicates a reasonable separation structure in SC above 0.5 (see also Moura, Martins and Cunha (3)).
According to previous studies (44), the characteristics of foot/ball impact appears to be a significant factor in kicking performance (see also (6)). The correlation coefficient between foot speed and ball speed can be assumed as an indirect measure of foot-to-ball impact quality during the kick movement (27). Kawamoto et al. (10) found a value of r = 0.94 in experienced players. In this sense, students at the university level from Brazil, even in a futsal context, demonstrated values (r = 0.76) (25, 26) higher than those of Japanese university soccer players (r = 0.57) (27). Inversely, the Brazilians showed slower foot speed (15.58 - 17.61 m.s-1) (24, 25) than Japanese (18.4 – 27.1 m.s-1) (27, 44). However, this comparison should be viewed with caution because futsal and soccer have important differences, such as the playing surface, footwear used, size and weight of the ball and the dimensions of the target (i.e. the goal), but to our knowledge, these were some of the few studies that have investigated the kicking ability of players in both countries.
The present results show that, apparently, the differences in the initiation, physical structure and training model between Japan and Brazil does not reflect in the performance of motor patterns, such as kicking among U-17 soccer players. By this age, soccer players probably already present mature and solid movement patterns and various reasons can explain this. The frequency in which kicking is practiced is high because of the demand for that action during a match. This is a motor pattern taught at a very early age (4 - 6 years old) (40) and takes relatively few weeks of practice to result in a structured proximal-distal limb coordination (45). The participants recruited for the present study had a mean time of 9 years of experience, which explains the general consistency in execution of the kick. The lack of information regarding kinematic patterns during the performance of kicking by high level Brazilian and Japanese soccer players limits our understanding whether the characteristics found in the present study persist as a function of age and skill level.
Besides kicking skills, some other factors may influence the performance of Brazilian and Japanese teams in soccer. Japanese professional players present low height and body mass compared to European players and, also considering tactical experience, such factors may be a limiting factor to success in competitions (46). We also verified that high-level Brazilian players possess higher height (179.5 and 175.0 cm) (47, 48), body mass (77.8 and 70.5 kg) (47, 48), body fat percentage (12.15 and 9.02%) (48, 49), maximum oxygen uptake (63.2 and 55.8 mL.kg-1.min-1) (48, 50), 20 m sprint performance (2.39 and 3.02 s) (46, 51) and quadriceps isokinetic peak torque at 180°/s (234.94 and 150 N.m) (46, 52) compared to high-level Japanese players, respectively. Studies suggest that kicking performance is associated with the anaerobic pathway (53), body mass (54) and knee extension velocity of the kicking limb (20), and the literature reports that these variables are different between Brazilian and Japanese players. However, when kicking kinematics are observed, as in the present study, there is no evidence of differences between these groups.
It is also important to consider that the performance of technical skills during matches are not only the result of one individual, but are a result of collective skills, such as team tactical capacities (55). Thus, the main limitation of the present study is the experimental condition for the execution of the kick, which leads to the analysis of a closed motor skill. This may likely have contributed to the absence of differences between the kinematic patterns of movement between groups. During practice, generally, coaches dedicate a lot of time trying to refine kicking in a closed form, simulating specific situations such as penalties and free kicks. However, it has been suggested that the analyses of kicking kinematics should also use contexts involving real match demands, such as with protocols using rolling balls (25, 26, 38, 39).
The present study simultaneously showed the kinematics features of Brazilian and Japanese U-17 players in a soccer context. Although both present some differences in culture (i.e. training methods and talent development models) and traditions (i.e. the results obtained in international competitions) in soccer, when kicking kinematics are observed, the present study concludes that the lower limb kinematic patterns, in both support and ball contact phases, during free kicks adopting the side-foot kick style is similar between Brazilian and Japanese U-17 soccer players. Additionally, the present article adopted a graphical methodology for analyzing the performance of the kick (i.e. movement patterns) and cluster analysis to group the data, which represents methods little explored in performance analysis within the context of soccer. In practical terms, and during the process of teaching, learning and training, soccer coaches of teams that have Japanese and Brazilian players should not differentiate the training sessions of kicking to correct or improve the kinematic pattern of movement, since they present similar performance (i.e. suggesting that the pattern of kick motion in soccer is general for these nationalities).
Further, a limitation to our study is that the method adopted (i.e. graphical analysis) comprises the direct comparison of the results of a stereographic projection with the findings of other studies, whose comparisons is primarily visual. Future research should investigate the development of the kick performance by Brazilian and Japanese soccer populations (i.e. in different age groups in children up to the professional level) during competitions (i.e. match-related performance) and in an experimental context (i.e. field tests), and should include other variables not assessed in the present investigation, such as ball speed, foot speeds, angular joint speeds, and two-dimensional accuracy, since reference values are not available in scientific literature for these.
