1. Background
Scientific research has supported the association between leanness and running performance (1-5). Theoretically, a small body mass is advantageous for distance running in terms of energy economics, ground reaction forces, and heat accumulation (6). To enhance performance is one of the important reasons for dieting among adolescent athletes (7). In addition, the social comparisons across targets and attributes are more common in girls than boys (8) and female athletes in leanness sports often experience weight-related pressure from leaner teammates or other athletes (9), which may drive them to compete for leanness (10). Moreover, school-age girls commonly receive messages regarding body image, including appeals promoting thinness by mass media (11), and the effects of internalization of the thin-ideal images are stronger in girls than boys (12). Therefore, the performance and success of thin runners potentially promote attitudes emphasising leanness among adolescent female runners, and it is possible that excessive thinness is becoming more prevalent. To this point, however, no systematic study providing evidence as to the prevalence and trend of thinness among young female runners in comparison to male counterparts has been conducted.
2. Objectives
The aims of the present study were to use the 26 years of data from the directory of participants in the All-Japan high school Ekiden (road relay race) championship (hereafter referred to as “Championship”) to retrospectively evaluate secular trends in height, weight, and body mass index (BMI) and the prevalence of thinness among adolescent runners in Japan and to compare the trends between males and females. We hypothesized that the prevalence of excessive thinness has increased among adolescent female runners, but not male runners in Japan.
3. Methods
3.1. The Competition Analysed
The Championship is an annual national road relay running competition. The study period was chosen to incorporate the data for the Championships since female competitions began in 1989. Runners from the champion high school from each of the 47 prefectures of Japan participate in the race. Consequently, the participants in this race are representative of adolescent runners from the entirety of Japan. Boys and girls team competitions occur separately, with the male and female teams running 42.195 km in 7 legs (10 km, 3 km, 8.1075 km, 8.0875 km, 3 km, 5 km, and 5 km) and 21.0975 km in 5 legs (6 km, 4.0975 km, 3 km, 3 km, and 5 km), respectively. Each male and female team consists of 7 and 5 regulars registered for the 7 and 5 legs with up to 3 reserves, respectively. Each registered runner competes 1 leg of the total distance.
3.2. Data Collection
Height and weight were obtained from a directory of Championship participants, which has been made available annually from 1990 to 2015 in a supplement to the January issue of “Gekkan Rikujo Kyougi (Track and Field Monthly),” a highly popular running magazine (13). This magazine has been declared an official publication of the Japan Industrial Track and Field Association, the Inter-University Athletic Union of Japan, the All Japan High School Athletic Federation (track and field), and the Nippon Junior High School Physical Culture Association (track and field). The data were collected by the publisher using a questionnaire sent to representative high schools before the Championship. Of the 9,984 girls listed as registered participants in the 24 Championships between 1989 and 2014, data on height and weight were available for 9,881 female participants (99.0%). These participants include girls in their 1st - 3rd years of high school (15 - 18 years of age). In total, 72 foreign runners (0.73%) were identified by name. The heights and weights of 12,768 male runners (85 foreign runners, 0.67%) who participated in the boys’ team competitions over the same period were used for comparisons with the trends in height, weight, and BMI among female runners.
3.3. Statistical Analysis
We divided these 9,881 girls and 12,768 boys into 26 groups based on their race year and investigated the secular trends in height, weight, and BMI over the 26-year study period. BMI was calculated using the formula [weight (kg)]/[height (m)]2. We then calculated the means of these indices for runners by high school grade for each year. The BMIs of the runners were compared to those in the general population. We calculated the mean BMI by using the mean values of height and weight of the 1st, 2nd, and 3rd grades of high school boys and girls reported in the Annual Report of School Health Statistics Research (14) as representative of the general population. These data were compiled from students attending thousands of schools chosen through multi-stage sampling. The significance of the secular trends in weight, height, and BMI by race year (regarded as a continuous variable) was assessed separately by the grade using linear regression analyses. When unstandardized regression coefficients differed significantly from 0, corresponding 95% confidence intervals (CIs) were calculated and values less or greater than 0 for the upper or lower bounds of 95% CIs indicated statistically significant linear trends of decrease or increase by year, respectively. When unstandardized regression coefficients were significantly negative, we calculated the differences in the mean BMIs between 1989 and 2014 to determine the magnitudes of the decrease in BMI during the 26-year study period.
The directory yielded the grades of runners but not their ages. The ages of high school students in the 1st, 2nd, and 3rd grades are supposed to be 15 - 16, 16 - 17, and 17 - 18 years, respectively. Therefore, we assumed that the mean ages of the runners for the 3 grades were 15.5, 16.5, and 17.5 years, respectively. To evaluate the prevalence of thinness, we divided the participants for each grade into 4 groups according to a sex-specific and age-adjusted classification for adolescents proposed by Cole et al. (15) as follows: for girls, 1) not thin: BMI ≥ 17.69, 18.09, and 18.38 kg/m2 for age 15.5, 16.5, and 17.5, respectively; 2) mild thinness: 16.22 ≤ BMI < 17.69 kg/m2, 16.62 ≤ BMI < 18.09 kg/m2, and 16.89 ≤ BMI < 18.38 kg/m2 for age 15.5, 16.5, and 17.5, respectively; 3) moderate thinness: 15.25 ≤ BMI < 16.22 kg/m2, 15.63 ≤ BMI < 16.62 kg/m2, and 15.90 ≤ BMI < 16.89 kg/m2 for age 15.5, 16.5, and 17.5, respectively; and 4) severe thinness: BMI < 15.25, 15.63, and 15.90 kg/m2 for age 15.5, 16.5, and 17.5, respectively; for boys, 1) not thin: BMI ≥ 17.26, 17.80, and 18.28 kg/m2 for age 15.5, 16.5, and 17.5, respectively; 2) mild thinness: 15.82 ≤ BMI < 17.26 kg/m2, 16.34 ≤ BMI < 17.80 kg/m2, and 16.80 ≤ BMI < 18.28 kg/m2 for age 15.5, 16.5, and 17.5, respectively; 3) moderate thinness: 14.86 ≤ BMI < 15.82 kg/m2, 15.36 ≤ BMI < 16.34 kg/m2, and 15.81 ≤ BMI < 16.80 kg/m2 for age 15.5, 16.5, and 17.5, respectively; and 4) severe thinness: BMI < 14.86, 15.36, and 15.81 kg/m2 for age 15.5, 16.5, and 17.5, respectively. These values in the criteria were from an international survey that included nationally representative data from large growth studies conducted in 6 countries, including Singapore, Hong Kong, Brazil, the Netherlands, Great Britain, and the U.S. We then calculated the percentages of participants in each thinness category among the total participants in each year. Logistic regression analysis was used to assess the secular trends in the prevalence of each thinness category (treated as the binary outcome) by grade, with the race year being treated as a continuous variable. Odds ratios (ORs) with corresponding 95% CIs were calculated, and a value greater than 1.0 for the lower bound of a 95% CI indicated a statistically significant increase of the prevalence by year.
We had a set of height and weight data measured among 45 female race participants within a few months before or after the Championships held between 2001 and 2011. Paired t-tests were performed to examine the difference between the self-reported data in the magazines and the measured. A correlation analysis was also conducted to measure the relationship between them.
All statistical analyses were performed using SPSS® 15.0J for Windows (IBM, Japan). P < 0.05 was considered statistically significant. The study was approved by the ethical committee of the Faculty of Sports and Health Studies, Hosei University (No. 201302-1).
4. Results
4.1. Secular Trends
The mean BMIs among female runners were consistently lower than those among girls in general (Figure 1). The BMIs of female runners in the 1st, 2nd, and 3rd grades significantly declined over the 26-year period for all age groups, as indicated by the negative coefficients (95% CI) of -0.033 (-0.039 to -0.028), -0.034 (-0.039 to -0.029), and -0.034 (-0.039 to -0.028) (all P < 0.001), respectively (Figure 1), whereas the mean BMI significantly decreased only in the 1st grade high school girls of the general population (coefficient: -0.009, 95% CI: -0.014 to -0.004, P = 0.002). The magnitudes of the decrease in the mean BMIs among female runners during the 26-year study period were -0.79 kg/m2, -0.82 kg/m2, and -0.89 kg/m2 for the 1st, 2nd, and 3rd grades, respectively, while that of the 1st grade high school girls of the general population was only -0.18 kg/m2. Similar trends were observed in the mean weight of the female runners, as noted by the significantly negative coefficients (95% CI) of -0.093 (-0.112 to -0.074), -0.095 (-0.112 to -0.078), and -0.096 (-0.114 to -0.078) (all P < 0.001) for the 1st, 2nd, and 3rd grades, respectively, whereas the mean height was stable during the period, as denoted by the regression coefficients of -0.017 (P = 0.16), -0.017 (P = 0.11), and -0.019 (P = 0.98), respectively, for the 3 grades.
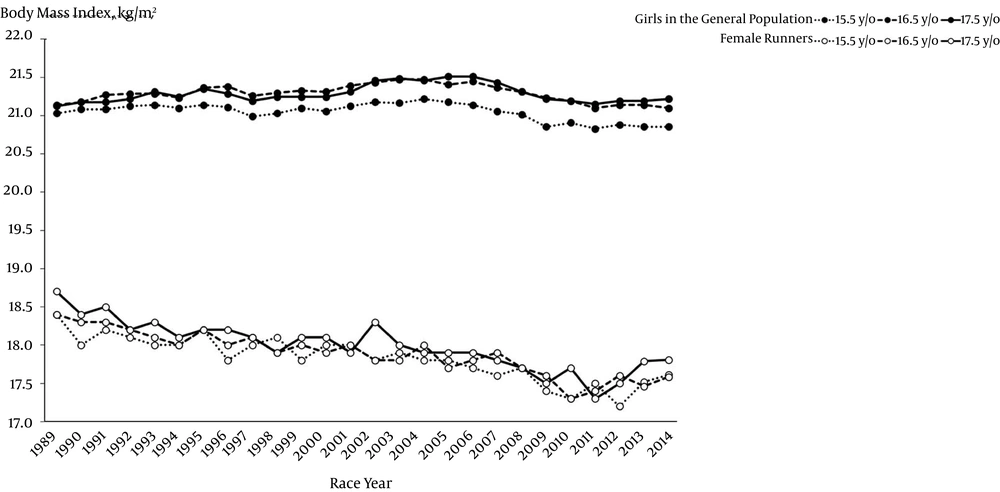
Figure 1.
Trends of the Mean Body Mass Indices of Adolescent Female Runners Participating in the All-Japan High School Ekiden Championships (Open Circles), as Compared to High School Girls from the General Population (Closed Circles) (y/o, years old)
Similarly to the female runners, the trends in height, weight, and BMI among the male participants of the 3 grades significantly declined. Linear regression analysis revealed significantly negative coefficients (95% CI) of -0.033 (-0.038 to -0.027), -0.030 (-0.034 to -0.026), and -0.032 (-0.036 to -0.029) (all P < 0.001) for BMI for male runners in the 1st, 2nd, and 3rd grades, respectively (Figure 2), while the corresponding values for weight were -0.106 (-0.129 to -0.083), -0.088 (-0.109 to -0.080), and -0.094 (-0.109 to -0.080) (all P < 0.001), respectively, for the 3 grades. Conversely, the changes in height over the study period were not significant, as noted by the coefficients of -0.021 (P = 0.10), -0.004 (P = 0.68), and 0.0003 (P = 0.97), for male runners in the 1st, 2nd, and 3rd grades, respectively. The changes of the decrease in the mean BMIs among male runners between 1989 and 2014 were -0.85 kg/m2, -0.94 kg/m2, and -0.90 kg/m2 for the 3 grades, respectively. On the other hand, the mean BMIs among high school boys of the general population did not change in the 1st and 2nd grades (P = 0.99 and 0.50, respectively) and significantly increased in the 3rd grade (coefficient: 0.010, 95% CI: 0.002 to 0.018, P = 0.02).
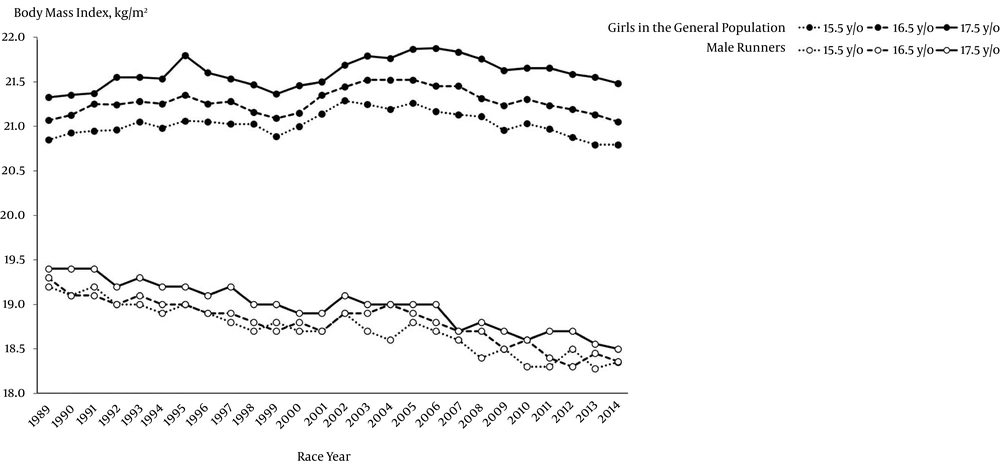
Figure 2.
Trends of the Mean Weight of Adolescent Male Runners Participating in the All-Japan High School Ekiden Championships (Open Circles), as Compared to High School Boys from the General Population (Closed Circles) (y/o: years old)
4.2. Thinness Prevalence
The prevalence of mild and moderate thinness increased after the 1st competition among the female runners in all age groups (Table 1). The trends were significant with values greater than 1.0 for the lower bounds of the 95% CIs for the yearly change. The trends of increases in the prevalence of severe thinness were also significant excluding that for the 1st-grade female runners. On the contrary, the majority of the male runners were not regarded as thin, and only 17 of the 12,768 (0.13%) male runners were categorized as severely thin throughout the study period (Table 2). The trends of increased prevalence were significant for only mild and moderate thinness.
Table 1.
| % of Female High School Runners in Each Thinness Category | OR | P Value | 95%CI | ||||||||||||||||||||||||||
|---|---|---|---|---|---|---|---|---|---|---|---|---|---|---|---|---|---|---|---|---|---|---|---|---|---|---|---|---|---|
| 1989 | 1990 | 1991 | 1992 | 1993 | 1994 | 1995 | 1996 | 1997 | 1998 | 1999 | 2000 | 2001 | 2002 | 2003 | 2004 | 2005 | 2006 | 2007 | 2008 | 2009 | 2010 | 2011 | 2012 | 2013 | 2014 | ||||
| 1st grade (15.5 years) | |||||||||||||||||||||||||||||
| Not thin | 66.9 | 61.5 | 67.5 | 57.8 | 55.5 | 60.0 | 64.8 | 54.5 | 62.4 | 58.3 | 47.3 | 60.9 | 60.0 | 51.0 | 58.5 | 49.5 | 47.7 | 47.2 | 46.4 | 47.6 | 38.5 | 28.0 | 35.6 | 33.6 | 40.4 | 43.3 | 0.95 | < 0.001 | 0.94 - 0.96 |
| Mild thinness | 30.5 | 31.2 | 26.3 | 35.6 | 40.0 | 29.3 | 28.6 | 41.6 | 31.2 | 35.6 | 45.5 | 33.6 | 34.5 | 43.3 | 36.1 | 43.2 | 42.0 | 45.5 | 43.6 | 41.3 | 45.2 | 57.6 | 53.3 | 42.2 | 47.5 | 47.4 | 1.04 | < 0.001 | 1.03 - 1.05 |
| Moderate thinness | 2.5 | 5.5 | 5.3 | 5.6 | 3.6 | 9.3 | 4.8 | 3.0 | 4.3 | 3.8 | 6.4 | 4.5 | 3.6 | 4.8 | 4.8 | 4.5 | 8.0 | 6.5 | 7.3 | 9.8 | 14.4 | 13.6 | 9.6 | 23.3 | 9.9 | 7.2 | 1.06 | < 0.001 | 1.04 - 1.08 |
| Severe thinness | 0 | 1.8 | 0.9 | 1.1 | 0.9 | 1.3 | 1.9 | 1.0 | 2.2 | 2.3 | 0.9 | 0.9 | 1.8 | 1.0 | 0.7 | 2.7 | 2.3 | 0.8 | 2.7 | 1.4 | 1.9 | 0.8 | 1.5 | 0.9 | 2.1 | 2.1 | 1.02 | 0.36 | 0.98 - 1.06 |
| N (total) | 118 | 109 | 114 | 90 | 110 | 75 | 105 | 101 | 93 | 132 | 110 | 110 | 110 | 104 | 147 | 111 | 88 | 123 | 110 | 143 | 104 | 118 | 135 | 116 | 141 | 97 | |||
| 2nd Grade (16.5 Years) | |||||||||||||||||||||||||||||
| Not thin | 65.6 | 52.8 | 58.9 | 48.6 | 49.7 | 38.9 | 52.4 | 49.6 | 45.8 | 40.6 | 47.0 | 38.3 | 44.0 | 41.0 | 36.9 | 41.4 | 33.3 | 40.2 | 37.7 | 32.9 | 29.7 | 26.5 | 23.3 | 32.4 | 23.6 | 26.4 | 0.95 | < 0.001 | 0.94 - 0.96 |
| Mild thinness | 28.7 | 38.6 | 31.8 | 43.9 | 37.3 | 53.2 | 38.9 | 38.9 | 45.1 | 44.4 | 41.0 | 48.2 | 49.6 | 49.3 | 50.3 | 48.1 | 51.0 | 47.5 | 46.4 | 51.2 | 53.6 | 41.6 | 49.6 | 46.8 | 48.5 | 53.5 | 1.02 | < 0.001 | 1.02 - 1.03 |
| Moderate thinness | 5.7 | 7.9 | 8.5 | 7.4 | 10.6 | 7.1 | 7.9 | 9.2 | 7.2 | 10.6 | 8.2 | 12.1 | 4.3 | 7.5 | 11.5 | 6.8 | 12.4 | 8.2 | 12.6 | 13.4 | 13.8 | 28.3 | 24.0 | 18.7 | 22.4 | 18.6 | 1.06 | < 0.001 | 1.04 - 1.07 |
| Severe thinness | 0 | 0.8 | 0.8 | 0 | 2.5 | 0.8 | 0.8 | 2.3 | 2.0 | 4.4 | 3.7 | 1.4 | 2.1 | 2.2 | 1.3 | 3.8 | 3.3 | 4.1 | 3.3 | 2.4 | 2.9 | 3.5 | 3.1 | 2.2 | 5.5 | 1.6 | 1.05 | 0.001 | 1.02 - 1.08 |
| N (total) | 122 | 127 | 129 | 148 | 161 | 126 | 126 | 131 | 153 | 160 | 134 | 141 | 141 | 134 | 157 | 133 | 153 | 122 | 151 | 164 | 138 | 113 | 129 | 139 | 165 | 129 | |||
| 3rd Grade (17.5 Years) | |||||||||||||||||||||||||||||
| Not thin | 56.7 | 50.4 | 53.6 | 37.8 | 43.6 | 39.8 | 40.0 | 42.9 | 41.0 | 31.9 | 41.3 | 36.0 | 32.0 | 46.4 | 31.0 | 30.2 | 30.9 | 30.5 | 31.4 | 26.0 | 19.7 | 26.0 | 14.9 | 22.0 | 26.6 | 31.4 | 0.95 | < 0.001 | 0.94 - 0.96 |
| Mild thinness | 38.1 | 42.6 | 37.3 | 48.7 | 46.1 | 43.0 | 49.3 | 39.7 | 41.7 | 48.1 | 38.9 | 47.2 | 49.2 | 42.0 | 54.4 | 50.0 | 48.8 | 54.2 | 44.8 | 47.3 | 54.7 | 49.6 | 49.5 | 47.5 | 49.7 | 44.5 | 1.01 | 0.006 | 1.00 - 1.02 |
| Moderate thinness | 5.2 | 7.0 | 8.2 | 10.9 | 10.3 | 13.3 | 9.3 | 15.1 | 15.3 | 15.6 | 16.7 | 12.8 | 15.6 | 9.4 | 11.4 | 17.2 | 17.9 | 11.5 | 20.0 | 21.9 | 21.4 | 19.1 | 27.7 | 27.1 | 21.7 | 19.0 | 1.05 | < 0.001 | 1.04 - 1.06 |
| Severe thinness | 0 | 0 | 0.9 | 2.5 | 0 | 3.9 | 1.4 | 2.4 | 2.1 | 4.4 | 3.2 | 4.0 | 3.3 | 2.2 | 3.2 | 2.6 | 2.4 | 3.8 | 3.8 | 4.8 | 4.3 | 5.3 | 7.9 | 3.4 | 2.1 | 5.1 | 1.06 | < 0.001 | 1.03 - 1.09 |
| N (total) | 97 | 115 | 110 | 119 | 165 | 128 | 140 | 126 | 144 | 160 | 126 | 125 | 122 | 138 | 158 | 116 | 123 | 131 | 105 | 146 | 117 | 131 | 101 | 118 | 143 | 137 | |||
aNote: Not thin; Body mass index (BMI) ≥ 17.69 kg/m2, mild thinness; 16.22 ≤ BMI < 17.69 kg/m2, moderate thinness; 15.25 ≤ BMI < 16.22 kg/m2, and severe thinness; BMI <15.25 kg/m2 for 1st grade (15.5 years), not thin; BMI ≥ 18.09 kg/m2, mild thinness; 16.62 ≤ BMI < 18.09 kg/m2, moderate thinness; 15.63 ≤ BMI < 16.62 kg/m2, and severe thinness; BMI < 15.63 kg/m2 for 2nd grade (16.5 years), not thin; BMI ≥ 18.38 kg/m2, mild thinness; 16.89 ≤ BMI < 18.38 kg/m2, moderate thinness; 15.90 ≤ BMI < 16.89 kg/m2, and severe thinness; BMI < 15.90 kg/m2 for 3rd grade (17.5 years).
bOdds ratios (ORs) with 95% confidence intervals (CIs) was calculated for each thinness categories per year change in time.
Table 2.
| % of Male High School Runners in Each Thinness Category | OR | P Value | 95%CI | ||||||||||||||||||||||||||
|---|---|---|---|---|---|---|---|---|---|---|---|---|---|---|---|---|---|---|---|---|---|---|---|---|---|---|---|---|---|
| 1989 | 1990 | 1991 | 1992 | 1993 | 1994 | 1995 | 1996 | 1997 | 1998 | 1999 | 2000 | 2001 | 2002 | 2003 | 2004 | 2005 | 2006 | 2007 | 2008 | 2009 | 2010 | 2011 | 2012 | 2013 | 2014 | ||||
| 1st grade (15.5 years) | |||||||||||||||||||||||||||||
| Not thin | 99.2 | 98.0 | 96.7 | 97.6 | 93.9 | 92.9 | 97.4 | 93.7 | 92.9 | 87.6 | 91.1 | 93.1 | 90.5 | 93.3 | 92.6 | 91.1 | 87.1 | 92.7 | 88.6 | 86.9 | 90.1 | 83.9 | 88.1 | 83.5 | 86.0 | 77.5 | 0.93 | 0.001 | 0.91 - 0.95 |
| Mild thinness | 0.8 | 2.0 | 3.3 | 2.4 | 6.1 | 7.1 | 1.3 | 6.3 | 6.1 | 11.2 | 8.9 | 5.9 | 9.5 | 6.7 | 7.4 | 8.9 | 10.8 | 6.3 | 9.5 | 12.1 | 9.9 | 14.0 | 11.9 | 16.5 | 14.0 | 18.6 | 1.07 | 0.001 | 1.05 - 1.10 |
| Moderate thinness | 0 | 0 | 0 | 0 | 0 | 0 | 1.3 | 0 | 0 | 1.1 | 0 | 1.0 | 0 | 0 | 0 | 0 | 2.1 | 1.0 | 1.9 | 1.0 | 0 | 1.1 | 0 | 0 | 0 | 3.9 | 1.11 | 0.01 | 1.02 - 1.21 |
| Severe thinness | 0 | 0 | 0 | 0 | 0 | 0 | 0 | 0 | 1.0 | 0 | 0 | 0 | 0 | 0 | 0 | 0 | 0 | 0 | 0 | 0 | 0 | 1.1 | 0 | 0 | 0 | 0 | 1.04 | 0.72 | 0.86 - 1.25 |
| N (total) | 122 | 98 | 91 | 83 | 99 | 112 | 78 | 79 | 99 | 89 | 123 | 102 | 84 | 89 | 81 | 101 | 93 | 96 | 105 | 99 | 121 | 93 | 109 | 85 | 93 | 102 | |||
| 2nd grade (16.5 years) | |||||||||||||||||||||||||||||
| Not thin | 92.2 | 87.4 | 89.6 | 87.5 | 87.1 | 90.0 | 86.2 | 85.2 | 86.7 | 86.5 | 82.6 | 81.9 | 87.6 | 84.7 | 84.0 | 88.8 | 85.7 | 81.2 | 80.7 | 81.9 | 78.4 | 80.0 | 75.6 | 66.5 | 73.9 | 71.5 | 0.95 | < 0.001 | 0.94 - 0.96 |
| Mild thinness | 7.3 | 12.0 | 9.8 | 12.5 | 12.3 | 9.6 | 13.8 | 13.0 | 12.7 | 12.8 | 16.9 | 17.5 | 11.8 | 15.3 | 15.3 | 9.6 | 14.3 | 15.8 | 18.1 | 16.3 | 21.1 | 18.8 | 21.3 | 31.3 | 24.8 | 24.8 | 1.05 | < 0.001 | 1.04 - 1.06 |
| Moderate thinness | 0.5 | 0.6 | 0 | 0 | 0.6 | 0 | 0 | 1.8 | 0.6 | 0.6 | 0.5 | 0.6 | 0.6 | 0 | 0.6 | 1.5 | 0 | 3.0 | 1.2 | 1.8 | 0.5 | 1.2 | 1.9 | 2.2 | 0.7 | 3.3 | 1.09 | 0.002 | 1.04 - 1.14 |
| Severe thinness | 0 | 0 | 0.5 | 0 | 0 | 0.5 | 0 | 0 | 0 | 0 | 0 | 0 | 0 | 0 | 0 | 0 | 0 | 0 | 0 | 0 | 0 | 0 | 1.3 | 0 | 0.7 | 0.5 | 1.08 | 0.19 | 0.96 - 1.21 |
| N (total) | 206 | 167 | 183 | 168 | 163 | 219 | 152 | 169 | 166 | 156 | 195 | 171 | 161 | 157 | 163 | 197 | 161 | 165 | 171 | 166 | 218 | 170 | 160 | 179 | 153 | 214 | |||
| 3rd grade (17.5 years) | |||||||||||||||||||||||||||||
| Not thin | 89.2 | 89.8 | 89.3 | 81.9 | 83.2 | 85.0 | 83.8 | 82.4 | 78.3 | 79.4 | 77.9 | 77.4 | 77.2 | 80.3 | 78.1 | 76.9 | 82.4 | 78.0 | 66.0 | 72.5 | 68.9 | 62.8 | 64.7 | 70.6 | 59.6 | 62.4 | 0.94 | < 0.001 | 0.94 - 0.95 |
| Mild thinness | 10.8 | 9.7 | 10.2 | 16.7 | 15.9 | 14.2 | 14.6 | 16.3 | 19.7 | 19.2 | 22.1 | 20.5 | 21.4 | 19.3 | 20.9 | 22.3 | 16.2 | 21.1 | 31.4 | 26.5 | 28.6 | 34.8 | 33.8 | 28.4 | 36.9 | 33.1 | 1.06 | < 0.001 | 1.05 - 1.07 |
| Moderate thinness | 0 | 0.5 | 0.5 | 0.9 | 1.0 | 0.8 | 1.7 | 0.9 | 2.0 | 0.9 | 0 | 2.1 | 0.9 | 0.4 | 0.5 | 0.7 | 1.5 | 0.5 | 2.6 | 1.0 | 2.1 | 2.4 | 1.5 | 1.0 | 3.0 | 4.2 | 1.07 | < 0.001 | 1.03 - 1.10 |
| Severe thinness | 0 | 0 | 0 | 0.5 | 0 | 0 | 0 | 0.5 | 0 | 0.5 | 0 | 0 | 0.5 | 0 | 0.5 | 0 | 0 | 0.5 | 0 | 0 | 0.4 | 0 | 0 | 0 | 0.5 | 0.4 | 1.04 | 0.40 | 0.95 - 1.14 |
| N (total) | 249 | 206 | 196 | 221 | 208 | 240 | 240 | 221 | 198 | 214 | 262 | 195 | 215 | 223 | 201 | 273 | 204 | 209 | 194 | 204 | 241 | 207 | 201 | 204 | 203 | 263 | |||
aNote: not thin; body mass index (BMI) ≥ 17.26 kg/m2, mild thinness; 15.82 ≤ BMI < 17.26 kg/m2, moderate thinness; 14.86 ≤ BMI < 15.82 kg/m2, and severe thinness; BMI < 14.86 kg/m2 for 1st grade (15.5 years), not thin; BMI ≥ 17.80 kg/m2, mild thinness; 16.34 ≤ BMI < 17.80 kg/m2, moderate thinness; 15.36 ≤ BMI < 16.34 kg/m2, and severe thinness; BMI < 15.36 kg/m2 for 2nd grade (16.5 years), not thin; BMI ≥ 18.28 kg/m2, mild thinness; 16.80 ≤ BMI < 18.28 kg/m2, moderate thinness; 15.81 ≤ BMI < 16.80 kg/m2, and severe thinness; BMI < 15.81 kg/m2 for 3rd grade (17.5 years).
bOdds ratios (ORs) with 95% confidence intervals (CIs) was calculated for each thinness categories per year change in time.
4.3. Self-Reported vs. Measured Data
The self-reported weights were underestimated among the selected 45 female participants, but the mean difference was small (self-reported vs. measured: 44.8 kg vs. 45.3 kg, P < 0.01) with the large correlation coefficient (r = 0.98, P < 0.01). There was no significant difference between the self-reported and measured heights (P = 0.30).
5. Discussion
5.1. Secular Trend in Thinness
The present study illustrated that BMIs have significantly declined in Japanese adolescent male and, especially, female runners who raced in the Championship over the past 26 years. To our knowledge, no study has reported the secular trends of the anthropometric variables of a large number of adolescent distance runners as performed in our study. Cross-sectional studies on relatively small numbers of Caucasian female adolescent runners (16, 17) reported substantially larger BMIs than those of female Japanese adolescent runners (19.1 kg/m2 in sub-elite distance runners; 20.6 kg/m2 in competitive cross-country runners, respectively). Takimoto et al. (18) analysed nationwide data and reported a recent trend toward lower BMIs among Japanese girls aged 15 - 19 years. However, the values and the changes they observed were substantially larger and smaller, respectively (20.92 kg/m2 in 1976 - 1980 to 20.58 kg/m2 in 1996 - 2000, i.e., -0.34 kg/m2 over 20 years) than those of the female runners analysed in the present study. These findings accord with the trends of girls in the general population in our study; thus, it is suggested the female participants in the Championship have been growing thinner at a faster rate than girls in general.
Consistent with this finding, the prevalence of moderately or severely thin female runners has increased significantly. Takimoto et al. (18) also reported the high and increasing prevalence of thinness among women aged 15 - 19 (12.4% in 1976 - 1980; 18.3% in 1996 - 2000). However, the values they reported might be overestimated because they analysed using a BMI of 18.5 kg/m2 as the cutoff for thinness. If the cut offs specified for children and adolescents had been applied to evaluating thinness in their study as we did, the prevalence among girls in general would have been estimated less than the reported. This would further illustrate prevailing thinness among the female participants in the Championship. These findings contrasted with the trends of BMI and the corresponding rates of thinness among the male runners.
5.2. Sociocultural Background for Thinness
Athletes in leanness sports face pressure to achieve an ideal body shape (19). Coaches might expect that creating a team of thinner runners is a rational strategy for winning the competition and both girl and boy athletes perceive pressure to lose weight from coaches (7). However, our study showed that excessive thinness is increasing in prevalence among Japanese adolescent female runners relative to the findings in male runners. Girls are more susceptible to societal pressures to be slim than boys (8, 11, 12) and engaged in weight-loss practice more frequently (20, 21). A study of Japanese adolescents (21) showed that the desire for thinness was markedly higher in girls than boys (79% vs. 20% in 17-year-olds, respectively). Interestingly, the study period coincided with the time during which many Japanese elite female distance runners emerged internationally and won international competitions while the achievements of Japanese elite male runners have been relatively constant as before the period. Because the media influence to be slimmer is larger in girls than boys (22), girl runners would readily get the thin-ideal image from such higher calibre and exclusively thin runners. Thus, it might be that over recent decades female runners were under a greater amount of sociocultural pressure to become thinner in order to win than were their male counterparts.
5.3. Adverse Effects of Thinness
The association between leanness and running performance has been reported among trained or recreational male and female runners of middle distance to marathon (1-5). To the contrary, no significant relationships were observed in elite male distance runners (23) and in elite 3000 m steeplechase and 5000 m runners (24). More recently, Arrese et al. (25) found that running times in some distances were positively associated with only skinfold thicknesses in the lower limb, but not with the sum of skinfolds of trunk and extremities among top-class male and female runners. A study of sub-elite adolescent runners (16) indicated that there was no significant relationship between % body fat and running time of 800- and 1500-m events among both boys and girls.
Reducing weight alone does not ensure better running performance. For example, Marc et al. (26) analysed running speed and BMI in 100 of the best marathoners from 1996 to 2011 and demonstrated that running speeds declined as the BMI became larger or smaller than 19.8 kg/m2 and 18.2 kg/m2 for male and female marathoners, respectively. The cross-sectional studies do not provide definite information about a cause-and-effect relationship between leanness and running performance. However, there is no longitudinal evidence suggesting that already lean runners can enhance their performance by losing additional weight. Competitive athletes can lose both fat and skeletal muscle mass when they lose weight (27, 28). Glycogen depletion (29), dehydration (29), and iron deficiency anaemia (30) can also occur in association with weight reduction under chronic energy restriction. Low BMI is also a risk factor for low bone mineral density (17) and stress fracture in adolescent runners (31). Thus, attempting to become extremely thin or even thinner against the normal growth of the body during adolescence would incur the risk of damaging performance (32).
Athletes who are dieting to become thinner may develop disordered eating and even more serious eating disorders (33). The prevalence of eating disorders is reported to be higher among elite male and female athletes in leanness sports than in non-leanness sports (19, 34, 35). A study of high school athletes (36) indicated that a higher proportion of females compared to males were diagnosed as eating disorders. Disordered eating is associated with menstrual dysfunction and low bone mineral density (37), as well as musculoskeletal injuries (38) in young female athletes. Tenforde et al. (31) reported lower BMI and late menarche were risk factors to prospective stress fracture in girls, whereas BMI was not related to prospective stress fracture in boys.
Even in the absence of clinical eating disorders, low energy availability may occur, and this variable is currently considered a key factor impairing both reproductive and skeletal health (39, 40). The prevalence of anorexia-type eating disorders has been estimated at 25.2 - 30.7/100,000 among Japanese teenage and young adult females (41), and that of disordered eating behaviors is reportedly 21% among Japanese collegiate female runners (42). The prevalence of disordered eating, eating disorders, or low energy availability among Japanese high school runners is unknown. Given the recent trend toward extreme thinness especially in female runners, however, we are concerned that numerous female high school runners are experiencing sustained low energy availability as well as incurring a greater risk of developing eating disorders.
5.4. Self-Reported Data
The present study was conducted using publicly available data, but the mode by which the reported height and weight were obtained was not available. Although self-reported weights of adolescent girls are likely lower than the measured with a mean difference between 1.0 and 2.1 kg, the correlations between self-reported and measured weights are high (0.84 - 0.98) (43). The relatively small difference (0.2 kg) and high correlation coefficient (0.963) between self-reported and measured weights were reported among Japanese women (44). Predictably, the difference between self-reported and measured weights was extremely small in our selected samples. Although a small underestimation of absolute weights was noted, it is unlikely that it would affect the trend across time substantially, as runners would be likely to underestimate their weights each year. Self-reported weight have been used for epidemiological studies (45, 46). There are anthropologic studies on using data from website (26, 47), sports magazines, compendia, or event programs (48). Given that self-reporting is the only source of weight information in this particular population, it is worthwhile to use these data to document the long-term trend and highlight the prevalence of thinness among competitive adolescent female runners.
Another limitation is that measuring changes in BMI alone is not adequate in understanding mechanisms underlying the increased prevalence of thinness. Surveys on body composition among adolescent runners are necessary.
The results of the present study suggest that the prevalence of excessive thinness among female high school runners has steadily increased over the past 26 years in Japan whereas severely thin male runners are scarce, making it likely that the risks for sustained low energy availability, amenorrhea, and osteoporosis, are increasing among female runners. To protect girls who participate in competitive distance running, additional research is needed, as is nutritional education and monitoring for disordered eating attitudes, beginning early during their athletic careers. Education for coaches to avoid putting pressure of losing weight on their athletes is also important.