1. Background
Marathon running (42.195 km) is one of the most popular sport events and has been included in the Olympic Games since 1896 (1). It is well known that runners from Eastern Africa mostly. Kenya and Ethiopia are the fastest in middle and long distance events including the marathon (1, 2). It has been previously demonstrated that the fastest runners from Kenya and Ethiopia originate from very specific altitudinous regions (3). In Kenya, most national and international athletes come from the former Rift Valley province, and belong to the Kalenjin ethnic group and Nandi sub-tribe in particular. In Ethiopia, most marathon runners are from the regions of Arsi and Shewa (4). Overall, Kenyan and Ethiopian runners are the youngest and the fastest in road-based half- and full marathons (5). A very recent study showed that Ethiopian men were faster than all other men in marathon running (2).
Pacing during a marathon is crucial to achieving a fast race time. It has been shown that sex, age and performance level of finishers influence pacing strategies in marathon running (6) where older and faster athletes, as well as women are better pacers than younger and slower ones, and malemarathoners (7). It has been reported that marathoners adopt a positive pacing strategy (i.e. they become slower during the race), but top runners show a lower variability of running speed during the race (8). However, although marathoners try to maintain even pacing during the race, running speed decreases in the second half (8). It has also been shown that slower finishing times were associated with greater slowing during the race (9), where especially men slowed down more than women (9, 10).
Although the above-mentioned studies enhanced our understanding of the effect sex, age and performance level on pacing, little is known about the role of nationality. Knowledge about the relationship between nationality and pacing would be of great practical value for coaches and trainers working with marathon runners in order to design optimal training and race strategies. The aim of the present study, therefore, was to examine the effect of nationality on pacing strategy of marathon runners. We adopted the research hypothesis that since fast marathon runners adopt a relatively more even pace (8) and Ethiopians and Kenyans are the fastest (2, 11), runners from East Africa would present a relatively more even pacing strategy compared to athletes from other nationalities.
2. Methods
2.1. Ethical Approval
The Institutional Review Board of Kanton St. Gallen, Switzerland approved all procedures used in the study with a waiver of the requirement for informed consent of the participants given the fact that the study involved the analysis of publicly available data. The study was conducted in accordance with recognised ethical standards and national/international laws.
2.2. Data Sampling
All runners who finished (women, n = 117,595; men, n = 180,487) in the ‘New York City Marathon’ between 2006 and 2016 were analysed. Inclusion criteria were that for each finisher there were complete data of all split times and changes between splits were less than 20%. The limit of 20% was applied to exclude cases that deviate from the “normal” sport pacing, e.g. those who abruptly decreased speed probably due to intolerable fatigue or an injury. Nationalities with > 1% of the total finishers were analysed in the present study. Ethiopians and Kenyans, who are the fastest runners in marathon, were included, too. The rest of the nationalities were classified as “other” (11,749 women and 25,527 men). Nine splits were analysed, among them the eight first were 5km each and the last one 2.195 km: 0 - 5 km, 5 - 10 km, 10 - 15 km, 15 - 20 km, 20 - 25 km, 25 - 30 km, 30 - 35 km, 35 - 40 km and 40 - 42 km. In addition, eight points of change of speed (Δspeed) were considered: 5 km, 10 km, 15 km, 20 km, 25 km, 30 km, 35 km and 40 km.
2.3. The Race
The ‘New York city Marathon’ presents relatively small changes in its elevation (www.tcsnycmarathon.org/sites/default/files/NYC Marathon Elevation Profile_2014.pdf). It starts at an elevation of 29.3 m, decreases by -8.0 m in the 0 - 5km split and by -9.1 m in the 5 - 10 km split, increases by +1.8 m in the 10 - 15 km split, decreases by -3.6 m in the 15 - 20 km split, increases by +30.7 m in the 20 - 25 km split, decreases by -39.0 m in the 25 - 30 km split, and then increases continuously in the 30 - 35 km (+6.1 m), 35 - 40 km (+13.7 m) and 40 - 42 km split (+3.7 m) to end at an elevation of 25.6 m.
2.4. Statistical Analysis
All statistical analyses were performed using the statistical packages IBM SPSS v.20.0 (SPSS, Chicago, USA) and GraphPad Prism v. 7.0 (GraphPad Software, San Diego, USA). All data were examined for normality using Kolmogorov-Smirnoff test of normality and visual inspection of normal Q-Q plots. Descriptive statistics (mean±standard deviation) were used for all variables. Race speed was calculated by dividing split distance (i.e. 5 km for all splits, except the last one which was 2.195 km) by time for each split (12). The men-to-women ratio was calculated for the total sample and each nationality. The association of sex with nationality, i.e. whether the men-to-women ratio varied by nationality, was examined using chi square (χ2) and Cramer’s phi (φ). A two-way analysis of variance (ANOVA), followed by a Bonferroni post-hoc analysis, examined the main effects of sex and nationality, and their interaction, on age and race time. Also, to study differences in age and race time by sex and nationality, and the interaction effects between these fixed variables, we used a mixed-effects regression model with finishers as random variable, whereas sex and nationality were assigned as fixed variables. Akaike information criterion (AIC) was used to select the final model. In addition, a between-within subjects ANOVA examined the split × nationality interaction on race speed and Δspeed. The magnitude of differences in the ANOVA was evaluated using eta squared (η2) as trivial (η2 < 0.01), small (0.01 ≤ η2 < 0.06), moderate (0.06 ≤ η2 < 0.14) and large (η2 ≥ 0.14) (13). We calculated percentage Δspeed at eight points of the race, e.g. Δspeed at 15 km as 100 × (speed in 15 - 20 km - speed in 10 - 15 km / speed in 10 - 15 km. We defined an end spurt as Δspeed at 40 km > 0% and examined the association of end spurt with nationality within each sex using χ2 and φ. Alpha level was set at 0.05.
3. Results
3.1. Distribution of Finishers by Nationality
Among the overall finishers the highest percentage of athletes is shown for participants of the United States of America (62% for women and 44% for men, respectively). Kenyan and Ethiopian runners, in return, show the lowest percentage, for Ethiopian and Kenyan women, as well as for Ethiopian men 0,03% each and for Kenyan men 0,04% (Table 1).
| Country | Women | Men |
|---|---|---|
| AUS | 2.16 | 1.70 |
| CAN | 3.48 | 2.34 |
| ESP | 0.80 | 2.64 |
| FRA | 3.95 | 8.20 |
| GBR | 3.41 | 4.26 |
| GER | 3.05 | 5.02 |
| ITA | 3.21 | 7.34 |
| JPN | 1.07 | 1.28 |
| MEX | 1.44 | 2.16 |
| NED | 2.45 | 3.69 |
| SUI | 1.18 | 1.75 |
| SWE | 1.31 | 1.71 |
| USA | 62.42 | 43.71 |
| KEN | 0.03 | 0.04 |
| ETH | 0.03 | 0.03 |
| Other | 10.02 | 14.17 |
3.2. Sex × Nationality Association
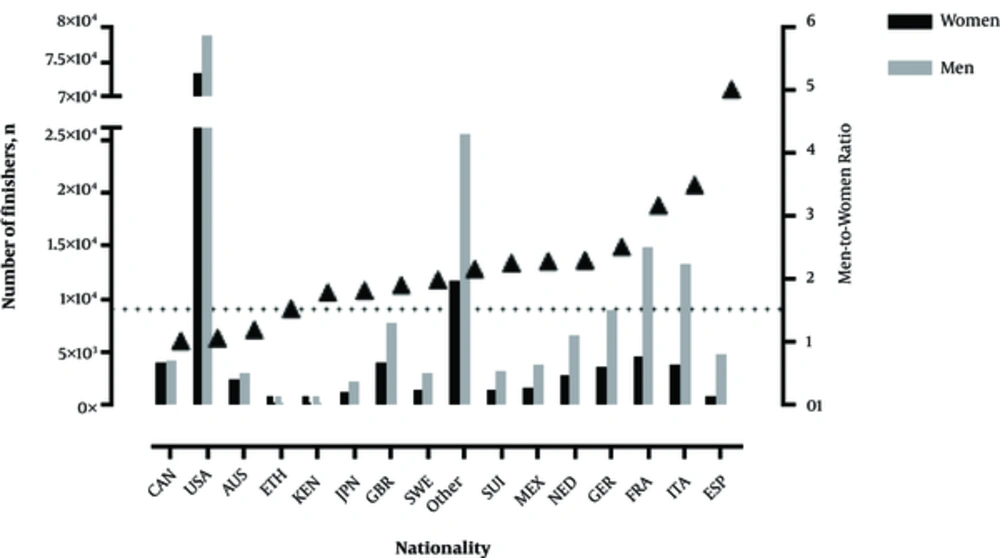
Fifteen nationalities (13 of them had > 1% of the total finishers plus Ethiopians and Kenyans) were analysed in the present study. The total men-to-women ratio was 1.53. A sex × nationality association was observed (χ2 = 13,187.6, P < 0.001, φ = 0.210) with the men-to-women ratio ranging from 1.03 (Canadians) to 5.03 (Spanish) (Figure 1).
3.3. Age by Nationality
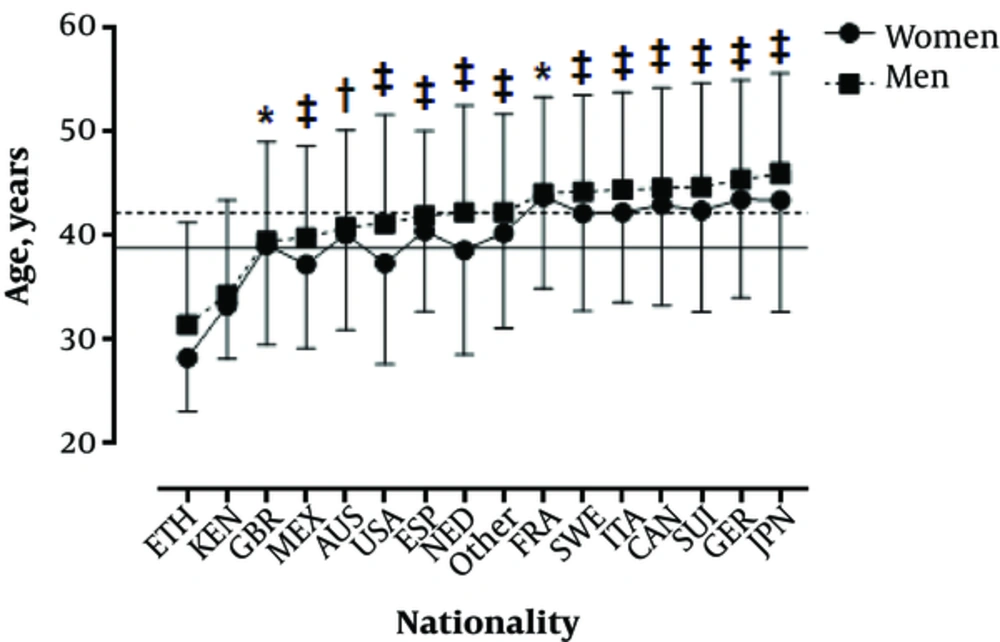
An insignificant main effect of sex on age was observed (P < 0.001, η2 < 0.001) with men being older than women (42.3 ± 10.1 versus 38.8 ± 9.8, respectively) (Figure 2, Table 2). A small main effect of nationality on age was shown (P < 0.001, η2 = 0.032) with Ethiopians being the youngest (30.2 ± 8.4 years) and Japanese the oldest (45.1 ± 10.9). A trivial sex×nationality interaction on age was found (P < 0.001, η2 = 0.003) with the sex difference in age ranging from 0.7% in French to 10.2% in US-Americans.
| Parameter | Estimate | SEE | P Value |
|---|---|---|---|
| Constant | 43.94 | 0.06 | < 0.001 |
| Nationality | -0.16 | 0.01 | < 0.001 |
| (Sex = women) | -1.01 | 0.11 | < 0.001 |
| (Sex = men) | * | * | |
| (Sex = women) × nationality | -0.20 | 0.01 | < 0.001 |
| (Sex = men) × nationality | * | * |
3.4. Race Time by Nationality
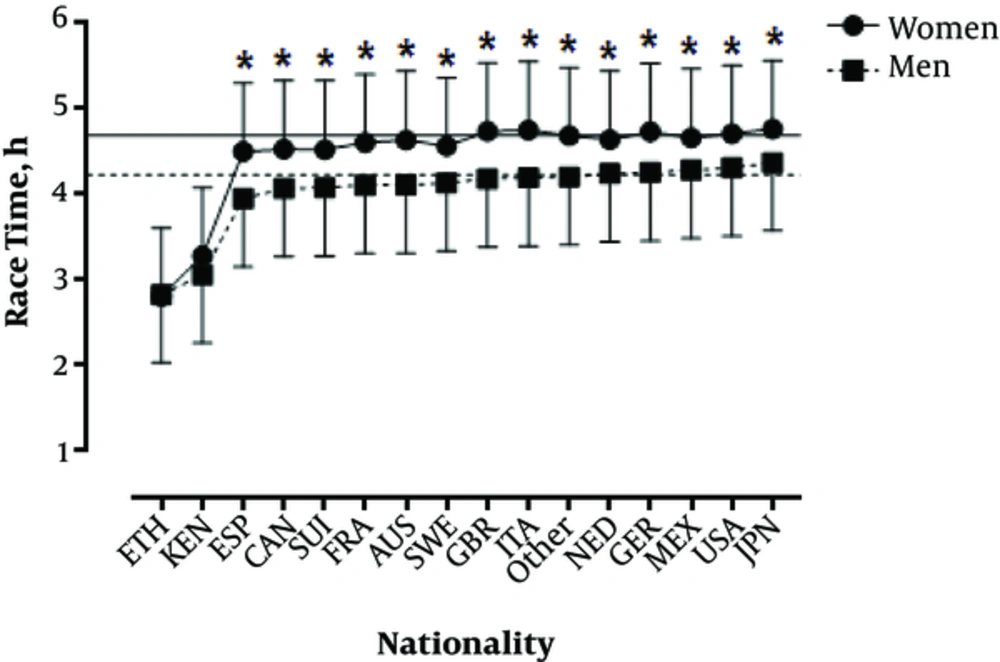
A trivial main effect of sex on race time was observed (P < 0.001, η2 = 0.003) with men being faster than women (4:14:05 ± 0:47:50 versus 4:41:22 ± 0:48:31 h:min:s, respectively) (Figure 3, Table 3). A trivial main effect of nationality on race time was shown (P < 0.001, η2 = 0.008) with Ethiopians (2:49:24 ± 0:49:17 h:min:s) and Kenyans (3:08:34 ± 1:05:46 h:min:s) being the fastest and Japanese the slowest (4:30:43 ± 0:54:37 h:min:s). A trivial sex × nationality interaction on race time was found (P < 0.001, η2 = 0.001) with the sex difference in race time ranging from 8.1% in Mexicans to 12.2% in Spanish.
| Parameter | Estimate | SEE | P Value |
|---|---|---|---|
| Constant | 14755.67 | 17.89 | < 0.001 |
| Nationality | 46.54 | 1.57 | < 0.001 |
| (Sex = women) | 1885.18 | 59.82 | < 0.001 |
| (Sex = men) | * | * | |
| (Sex = women) × nationality | -25.24 | 2.68 | < 0.001 |
| (Sex = men) × nationality | * | * |
3.5. Split × Nationality Interaction on Race Speed and Δspeed
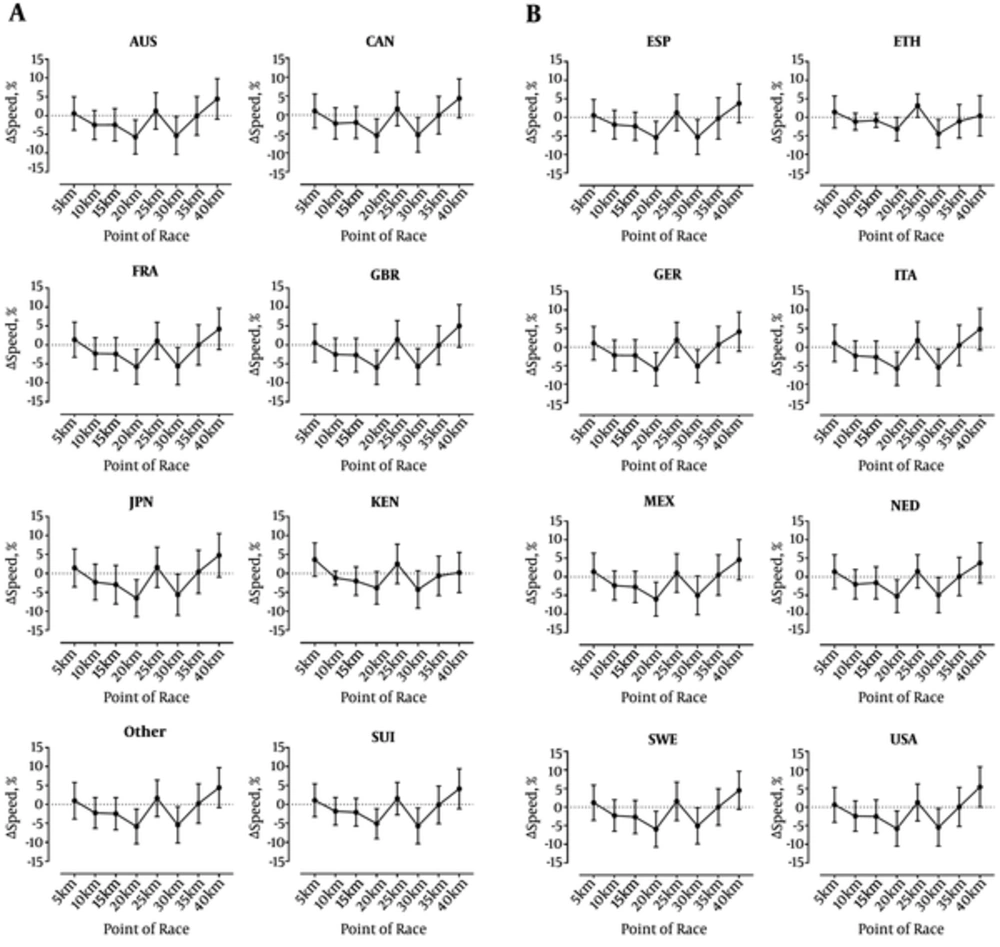
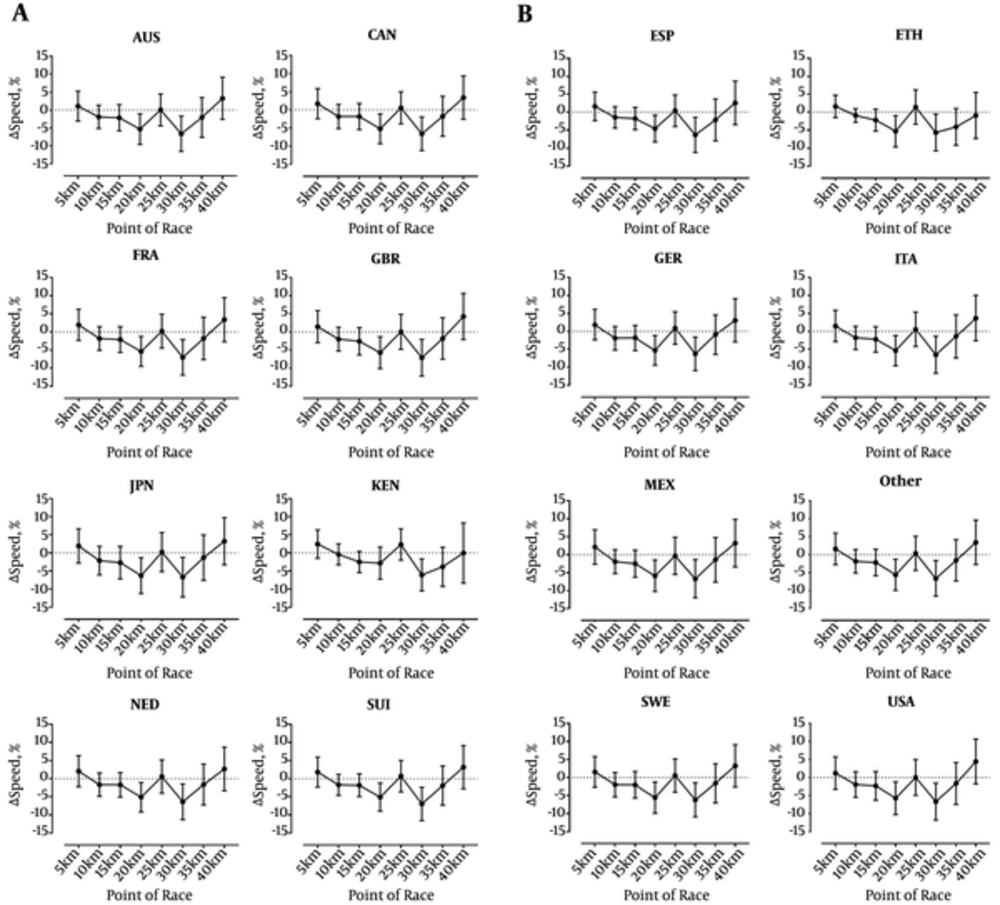
A trivial split×nationality interaction on race speed was observed in women (P < 0.001, η2 = 0.004) and men (P < 0.001, η2 = 0.005) (Tables 4 and 5) with Ethiopians and Kenyans showing a more even pacing (Figures 4 and 5). A split × nationality interaction on Δspeed was shown for both sexes (P < 0.001, η2 = 0.003; P < 0.001, η2 = 0.004, respectively) where athletes from Ethiopia and Kenya presented smaller changes of speed than the other nationalities.
| Nationality | Split, km | ||||||||
|---|---|---|---|---|---|---|---|---|---|
| 0 - 5 | 5 - 10 | 10 - 15 | 15 - 20 | 20 - 25 | 25 - 30 | 30 - 35 | 35 - 40 | 40 - 42 | |
| AUS | 10.05 ± 1.42 | 10.11 ± 1.51 | 9.86 ± 1.53 | 9.62 ± 1.57 | 9.09 ± 1.61 | 9.19 ± 1.66 | 8.70 ± 1.61 | 8.68 ± 1.59 | 9.04 ± 1.59 |
| CAN | 10.17 ± 1.49 | 10.29 ± 1.62 | 10.06 ± 1.63 | 9.87 ± 1.65 | 9.35 ± 1.69 | 9.49 ± 1.73 | 8.99 ± 1.69 | 8.97 ± 1.64 | 9.35 ± 1.66 |
| ESP | 10.27 ± 1.38 | 10.33 ± 1.46 | 10.12 ± 1.47 | 9.89 ± 1.52 | 9.37 ± 1.55 | 9.48 ± 1.64 | 8.98 ± 1.60 | 8.94 ± 1.58 | 9.26 ± 1.61 |
| ETH | 15.87 ± 2.36 | 16.08 ± 2.40 | 15.89 ± 2.37 | 15.76 ± 2.40 | 15.27 ± 2.36 | 15.76 ± 2.57 | 15.09 ± 2.60 | 14.89 ± 2.49 | 14.90 ± 2.41 |
| FRA | 9.98 ± 1.23 | 10.12 ± 1.32 | 9.89 ± 1.34 | 9.66 ± 1.37 | 9.11 ± 1.41 | 9.21 ± 1.49 | 8.70 ± 1.46 | 8.68 ± 1.43 | 9.04 ± 1.48 |
| GBR | 9.93 ± 1.55 | 9.99 ± 1.67 | 9.74 ± 1.69 | 9.49 ± 1.72 | 8.94 ± 1.74 | 9.06 ± 1.79 | 8.54 ± 1.72 | 8.51 ± 1.66 | 8.93 ± 1.75 |
| GER | 9.70 ± 1.24 | 9.80 ± 1.36 | 9.58 ± 1.35 | 9.37 ± 1.39 | 8.83 ± 1.44 | 8.99 ± 1.47 | 8.53 ± 1.44 | 8.57 ± 1.42 | 8.92 ± 1.47 |
| ITA | 9.81 ± 1.55 | 9.91 ± 1.65 | 9.69 ± 1.66 | 9.44 ± 1.73 | 8.90 ± 1.74 | 9.06 ± 1.81 | 8.56 ± 1.76 | 8.59 ± 1.72 | 8.99 ± 1.78 |
| JPN | 9.79 ± 1.44 | 9.94 ± 1.55 | 9.71 ± 1.57 | 9.43 ± 1.63 | 8.83 ± 1.68 | 8.96 ± 1.73 | 8.46 ± 1.68 | 8.48 ± 1.68 | 8.86 ± 1.71 |
| KEN | 14.20 ± 3.39 | 14.72 ± 3.51 | 14.57 ± 3.57 | 14.35 ± 3.80 | 13.87 ± 3.90 | 14.27 ± 4.15 | 13.71 ± 4.17 | 13.60 ± 4.13 | 13.54 ± 3.89 |
| MEX | 9.91 ± 1.33 | 10.05 ± 1.43 | 9.82 ± 1.43 | 9.56 ± 1.49 | 8.99 ± 1.52 | 9.08 ± 1.59 | 8.62 ± 1.53 | 8.65 ± 1.53 | 9.04 ± 1.58 |
| NED | 9.74 ± 1.09 | 9.88 ± 1.19 | 9.68 ± 1.19 | 9.52 ± 1.22 | 9.03 ± 1.26 | 9.16 ± 1.32 | 8.71 ± 1.30 | 8.70 ± 1.29 | 9.02 ± 1.34 |
| Other | 9.90 ± 1.47 | 10.00 ± 1.55 | 9.77 ± 1.56 | 9.54 ± 1.61 | 9.00 ± 1.65 | 9.14 ± 1.70 | 8.64 ± 1.66 | 8.64 ± 1.63 | 9.01 ± 1.66 |
| SUI | 10.10 ± 1.34 | 10.22 ± 1.47 | 10.03 ± 1.47 | 9.83 ± 1.51 | 9.34 ± 1.53 | 9.48 ± 1.62 | 8.94 ± 1.58 | 8.92 ± 1.53 | 9.27 ± 1.55 |
| SWE | 10.14 ± 1.42 | 10.26 ± 1.52 | 10.03 ± 1.53 | 9.77 ± 1.60 | 9.21 ± 1.65 | 9.34 ± 1.70 | 8.86 ± 1.65 | 8.85 ± 1.62 | 9.24 ± 1.66 |
| USA | 9.93 ± 1.46 | 9.99 ± 1.57 | 9.75 ± 1.59 | 9.51 ± 1.64 | 8.98 ± 1.69 | 9.08 ± 1.73 | 8.58 ± 1.68 | 8.57 ± 1.63 | 9.02 ± 1.66 |
| Total | 9.93 ± 1.45 | 10.01 ± 1.56 | 9.78 ± 1.57 | 9.54 ± 1.62 | 9.01 ± 1.66 | 9.12 ± 1.71 | 8.62 ± 1.66 | 8.61 ± 1.62 | 9.03 ± 1.65 |
aValues are expressed as mean ± SD.
| Nationality | Split, km | ||||||||
|---|---|---|---|---|---|---|---|---|---|
| 0 - 5 | 5 - 10 | 10 - 15 | 15 - 20 | 20 - 25 | 25 - 30 | 30 - 35 | 35 - 40 | 40 - 42 | |
| AUS | 11.37 ± 1.73 | 11.49 ± 1.77 | 11.28 ± 1.78 | 11.04 ± 1.83 | 10.47 ± 1.88 | 10.48 ± 1.98 | 9.79 ± 1.93 | 9.57 ± 1.85 | 9.85 ± 1.81 |
| CAN | 11.37 ± 1.79 | 11.57 ± 1.88 | 11.36 ± 1.90 | 11.16 ± 1.94 | 10.60 ± 1.99 | 10.67 ± 2.11 | 9.98 ± 2.07 | 9.78 ± 2.01 | 10.07 ± 1.98 |
| ESP | 11.60 ± 1.70 | 11.78 ± 1.73 | 11.61 ± 1.73 | 11.41 ± 1.76 | 10.90 ± 1.79 | 10.95 ± 1.93 | 10.26 ± 1.91 | 10.02 ± 1.87 | 10.25 ± 1.88 |
| ETH | 16.93 ± 3.34 | 17.21 ± 3.45 | 17.06 ± 3.47 | 16.74 ± 3.60 | 15.95 ± 3.75 | 16.24 ± 4.07 | 15.28 ± 3.86 | 14.64 ± 3.73 | 14.42 ± 3.59 |
| FRA | 11.26 ± 1.64 | 11.48 ± 1.70 | 11.27 ± 1.70 | 11.03 ± 1.72 | 10.45 ± 1.76 | 10.48 ± 1.87 | 9.75 ± 1.82 | 9.55 ± 1.74 | 9.85 ± 1.77 |
| GBR | 11.25 ± 1.76 | 11.41 ± 1.82 | 11.19 ± 1.84 | 10.91 ± 1.91 | 10.31 ± 1.97 | 10.32 ± 2.08 | 9.59 ± 2.02 | 9.39 ± 1.92 | 9.76 ± 1.94 |
| GER | 10.81 ± 1.64 | 11.01 ± 1.72 | 10.79 ± 1.73 | 10.60 ± 1.75 | 10.04 ± 1.80 | 10.13 ± 1.86 | 9.50 ± 1.82 | 9.38 ± 1.77 | 9.65 ± 1.81 |
| ITA | 11.14 ± 1.87 | 11.30 ± 1.91 | 11.10 ± 1.92 | 10.86 ± 1.98 | 10.29 ± 2.03 | 10.37 ± 2.16 | 9.68 ± 2.10 | 9.52 ± 2.03 | 9.84 ± 2.05 |
| JPN | 10.85 ± 1.91 | 11.05 ± 1.99 | 10.83 ± 2.04 | 10.55 ± 2.10 | 9.92 ± 2.19 | 9.95 ± 2.28 | 9.28 ± 2.22 | 9.13 ± 2.12 | 9.40 ± 2.16 |
| KEN | 15.55 ± 3.84 | 15.95 ± 4.00 | 15.92 ± 4.11 | 15.55 ± 4.10 | 15.21 ± 4.35 | 15.66 ± 4.81 | 14.71 ± 4.61 | 14.12 ± 4.42 | 13.85 ± 3.72 |
| MEX | 10.91 ± 1.78 | 11.14 ± 1.83 | 10.93 ± 1.83 | 10.67 ± 1.88 | 10.06 ± 1.92 | 10.04 ± 2.03 | 9.36 ± 1.96 | 9.20 ± 1.87 | 9.47 ± 1.88 |
| NED | 10.74 ± 1.42 | 10.95 ± 1.48 | 10.77 ± 1.47 | 10.59 ± 1.50 | 10.06 ± 1.54 | 10.12 ± 1.65 | 9.48 ± 1.61 | 9.31 ± 1.59 | 9.54 ± 1.61 |
| Other | 11.08 ± 1.77 | 11.26 ± 1.83 | 11.06 ± 1.84 | 10.83 ± 1.89 | 10.24 ± 1.95 | 10.29 ± 2.05 | 9.61 ± 2.01 | 9.44 ± 1.93 | 9.73 ± 1.93 |
| SUI | 11.31 ± 1.76 | 11.51 ± 1.82 | 11.32 ± 1.82 | 11.12 ± 1.84 | 10.56 ± 1.87 | 10.65 ± 1.99 | 9.91 ± 1.95 | 9.70 ± 1.90 | 9.98 ± 1.90 |
| SWE | 11.27 ± 1.84 | 11.45 ± 1.90 | 11.22 ± 1.93 | 11.00 ± 1.96 | 10.41 ± 2.01 | 10.47 ± 2.10 | 9.82 ± 2.04 | 9.64 ± 1.98 | 9.93 ± 1.99 |
| USA | 10.94 ± 1.81 | 11.08 ± 1.89 | 10.86 ± 1.92 | 10.62 ± 1.98 | 10.03 ± 2.05 | 10.04 ± 2.16 | 9.37 ± 2.09 | 9.19 ± 2.00 | 9.56 ± 2.00 |
| Total | 11.05 ± 1.78 | 11.21 ± 1.85 | 11.00 ± 1.87 | 10.77 ± 1.92 | 10.19 ± 1.98 | 10.22 ± 2.09 | 9.54 ± 2.03 | 9.36 ± 1.95 | 9.69 ± 1.96 |
aValues are expressed as mean ± SD.
3.6. End Spurt
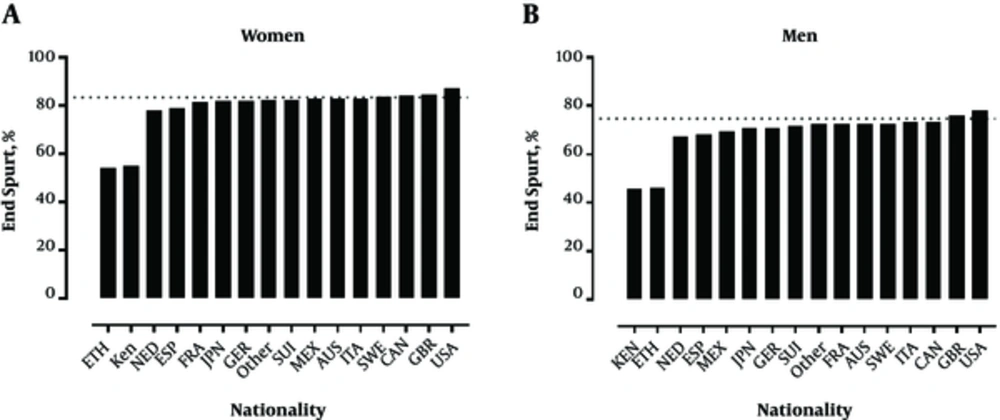
An end spurt × nationality association was observed in both sexes (women, χ2 = 646.2, P < 0.001, φ = 0.074; men, χ2 = 1163.2, P < 0.001, φ = 0.080) (Figure 6). According to this association, the largest prevalence was found in U.S.-Americans in women (87.2%) and men (78.2%), whereas the smallest was in Ethiopians (54.3%) and Kenyans (45.8%).
4. Discussion
The aim of the study was to examine the effect of nationality on pacing strategy of marathon runners competing in the ‘New York city Marathon’ and we hypothesized that runners from East Africa would present a relatively more even pacing strategy compared to the other nationalities based on recent findings that fast marathon runners adopt a relatively more even pace (8) and Ethiopians and Kenyans are the fastest marathon runners worldwide (14).
A first important finding was that Ethiopians and Kenyans were the fastest in this race and both Ethiopians and Kenyans showed a more even pacing strategy and smaller change of running speed than runners from other nationalities. Faster marathoners seem to pace differently compared to slower marathoners. Hanley (10) showed that medalists in Olympic and World Championship marathons maintained even-paced running from 10 km onwards whereas slower finishers dropped off the lead pack at approximately half-distance.
A second important finding was the smallest prevalence of an end spurt in Ethiopians and Kenyans. To date, no study investigated the prevalence of a ‘final end spurt’ in marathon running. For other running distances, the occurrence of an end spurt has been investigated. The pacing strategy seems to depend upon the length of a running race. When 800 m, 5000 m, and 10,000 m running races were analyzed, greater running speeds are achieved in the first lap in 800 m, and the ability to increase running speed on the second lap is limited. In 5000 m and 10,000 m, an end spurt occurs because of the maintenance of a reserve during the middle part of the race (15). Also ultra-marathoners competing in 161 km ultra-distance road races show in 38% a final end spurt (16).
A further important finding was the variation of men-to-women ratio by nationality. It was remarkable that an almost equal number of women and men finishers were Canadians or U.S.-Americans, which shows that a similar number of women and men participate in race events. The higher men-to-women ratio was observed in European nationalities, which denotes a more pronounced difficulty for women compared to men to travel from Europe to the USA.
A further finding was that Ethiopians and Kenyans were the fastest and Ethiopians were the youngest (~ 30 years). This finding for the ‘New York city Marathon’ confirms recent findings for for the annual top 100 women and men competing in four races of the ‘World Marathon Majors’ (Boston, Berlin, Chicago and New York) and the ‘Stockholm Marathon’ between 2000 and 2014 (11) and reports for marathoners and half-marathoners originating from 126 countries and competing between 1999 and 2014 in all road-based half-marathons and marathons held in one country (Switzerland) (17). A very likely explanation for this finding is an actual report showing that African marathoners were found to specialize, reach peak levels of performance, and retire at younger ages than Non-African marathoners (18).
The East African endurance running dominance is well investigated. Genotype variations (i.e. Y chromosome, mtDNA) as well as different enzyme-alleles (i.e. angiotensin converting enzyme (ACE), alpha-actinin-3 (ACTN3)), in this regard, were supposed to demonstrate a genetic advantage for Africans in running sports, with no significant difference among diverse nationalities (19-21).
Another attempt to explain the running success of East Africans is the running economy (RE), which is specified as the steady-state submaximal oxygen uptake at a given running velocity with better RE the lower the oxygen uptake is (22).
Recent studies investigating RE have shown that anthropometrics (i.e. longer legs, lower BMI, short Achilles tendon) as well as lower VO2max were related to better RE (23, 24). Although there was no significant correlation between RE and running performance, the studies showed an inverse relationship between RE and VO2max, with lower maximum oxygen level for superior economy. The authors interpreted the results that athletes with lower RE compensate with higher VO2max levels. Corresponding to Larsen and Sheel (25) the RE differs in respect to nationality with better RE for Kenyan compared to Scandinavian athletes. In contrast, the VO2max levels of the Kenyans and Scandinavians were comparable. Another review (22) considered VO2max, fractional utilization of VO2max and running economy, whereupon none of them was significantly different among the nationalities.
Probably the superior running success of East African athletes is also due to a smarter race tactic compared to non-African counterparts. As shown in this investigation, Kenyan and Ethiopian athletes do not practice a final spurt in a similar way to others. Given the fact that an increasing strides frequency during an endurance running race is not efficient because of devoting more energy to accelerate the legs (24), an athlete performing a final spurt has to grade his energy during the race to successfully compete in the final kilometers of a race.
Moreover, the economic factor to succeed in long-distance running events should not be neglected. When Kipchoge Keino won in 1968 the Olympic gold medal, the world and especially the Kenyans realized that Africans could run fast (25). Afterwards western managers and coaches brought financial resources to Eastern Africa when realizing the talent of Kenyans and Ethiopians. This might have indicated to earn a living as African (26).
Summing up to explain the East African endurance running dominance for the past decades is not simply explained due to a single factor mentioned above, but more likely due to a unique combination of several sociological, economic, motivational and anthropometric factors.
4.1. Limitations and Strengths
The main limitation of the present study is the analysis of a single race (New York city Marathon) in a single country and the low percentage of East African finishers (0.03% - 0.04%). Since we observe that the place of the race might influence the participation of nationalities by favouring the participation of nationalities from conterminous countries, we expect a different participation by nationality in race in another country. Thus, caution is needed to generalize the findings of this study to other races. On the other hand, strength is its novelty as it is the first study ever examining the variation of pacing by nationality.
4.2. Conclusions
In summary, the present study suggests that Ethiopians and Kenyans adopt a relatively more even pace during the New York city Marathon which is shown by their small changes in race speed and by practicing the end spurt less than other nationalities. Therefore, nationality may influence pacing and this observation should be considered by marathon runners and their coaches. Further research should be done focussing on other major marathons and road races.
