


1. Background
Liver fibrosis results from the accumulation of extracellular matrix proteins such as collagen in the liver tissue. This condition can then lead to portal hypertension and serious liver diseases that may need liver transplantation (1, 2). The gold standard diagnostic for liver fibrosis is the histological examination; however, this is an invasive method, especially in children (3, 4). Accordingly, the development of non-invasive predicting markers for liver fibrosis is of essential importance.
Some blood markers have been proposed as predictors of hepatic fibrosis in liver diseases, including albumin, hyaluronic acid, aspartate aminotransferase (AST) to platelet ratio (APRI), AST to alanine aminotransferase ratio (AAR), Fibrosis-4 (FIB-4) index, and blood platelet count (5-8). The immediate benefit of using non-invasive markers of fibrosis is obviation the need for liver biopsy and possibly other more expensive procedures (9, 10). Nevertheless, the application of these non-invasive markers in clinical practice needs validation of these indicators in the context of various liver diseases and different populations.
2. Objectives
The majority of studies concerning this issue have been done in adult populations with less attention to childhood hepatitis. In the present study, we assessed the usefulness of four common non-invasive parameters, including APRI, FIB-4, AAR, and platelet count for detecting liver fibrosis in children.
3. Methods
This was a double-center retrospective study and included patients who referred to the Liver and Gastroenterology Clinics of Amir-Almomenin Hospital (Zabol, Iran), and Namazi Hospital (Shiraz, Iran). Time-span was from March 2015 to March 2017.
3.1. Inclusion and Exclusion Criteria
Those children diagnosed with chronic liver diseases were included in the study. The exclusion criteria were malignant or other systemic major diseases, immunodeficiency, and receiving previous treatments or liver transplantation.
3.2. Liver Biopsy Examination
The patients were evaluated with a liver biopsy at the time of diagnosis. Tissue samples were fixed by paraffin, alcohol, and formalin, and then were stained using hematoxylin-eosin (H&E) method. The stage of fibrosis was determined by the Metavir scale (4). Patients with fibrosis stages 0,1, or 2, were grouped as “no advanced fibrosis,” and those with fibrosis stages 3 and 4 were grouped as “advanced fibrosis” and “cirrhosis,” respectively. All tissue samples were checked by two independent trained pathologists.
3.3. Developing Non-Invasive Indicators
Three indicators, namely APRI, FIB-4, and AAR were calculated as previously described using the following calculations (9, 10).
AAR = AST: ALT ratio
APRI = AST level (/ULN) / Platelet count (109/L) ×100
(ULN = upper limit of normal which was considered 40 IU/l)
FIB-4 = Age (Months) × AST (U/L) / Platelet count (109/L)
× [ALT (U/L)] ½
Because many of our patients had very young ages (days), we used “months”- instead of “years”- for calculating FIB-4. However, all analyses were also performed in parallel using “years”, which did not show any significant difference.
3.4. Statistical Analysis
The data were entered into SPSS software version 19, and analyzed by descriptive statistics with mean and standard deviation (SD). The normal distribution of the data was assessed based on the Shapiro-Wilk test. The points with the highest sensitivity and specificity and the area under the curve (AUC) were determined using receiver operating characteristic (ROC) curve. The significance level was defined at P < 0.05.
4. Results
Overall, 47 patients were studied. Out of these, 23 (48.9%) were females, and 24 (51.1%) were males. The mean age of the patients was 9.8±11.3 months, the youngest patient aged 24 days, and the oldest aged 48 months. Etiologies for liver disease included immune hepatitis (21, 44.8%), genetic and metabolic disorders (12, 25.5%), idiopathic neonatal hepatitis (8, 17%), biliary atresia (5, 10.6%), and congenital hepatic fibrosis (1, 2.1%).
Table 1 shows the basic biochemical and hematological characteristics of the patients regarding different etiologies.
| Parameters | Immune Hepatitis (N = 21) | Idiopathic Neonatal Hepatitis (N = 8) | Genetic and Metabolic Disorders (N = 12) | Biliary Atresia (N = 5) | Congenital Hepatic Fibrosis (N = 1) |
|---|---|---|---|---|---|
| Age (months) | 13.1 ± 12.7 | 2.8 ± 4.8 | 4.9 ± 3.6 | 1.1 ± 1.5 | 21 |
| AST (IU/l) | 186.1 ± 159.8 | 460 ± 576 | 92.2 ± 72.7 | 254 ± 192.7 | 85 |
| ALT(IU/l) | 156.8 ± 110.4 | 484.8 ± 676.2 | 87 ± 53.5 | 145.6 ± 79 | 60 |
| ALP(IU/l) | 576.1 ± 301.2 | 1164.5 ± 676.3 | 875.2 ± 275.6 | 1984.5 ± 78.4 | 319 |
| Total bilirubin (mg/ml) | 4.6 ± 6.1 | 0.9 ± 0.40 | 2 ± 2.8 | 6.1 ± 8.6 | 1.5 |
| Red blood cell count (1012/l) | 4.2 ± 0.7 | 4.1 ± 0.2 | 4.7 ± 0.3 | 3.8 ± 0.4 | 3.3 |
| White blood cell count (109/l) | 14.8 ± 9.7 | 13.9 ± 1.2 | 9.5 ± 2.5 | 11.9 ± 5 | 10.4 |
| Platelet count (109/l) | 337.6 ± 209.5 | 314.7 ± 181.6 | 301.3 ± 66.9 | 341 ± 25.4 | 196 |
| Hemoglobin (g/dl) | 10.7 ± 1.9 | 11.1 ± 0.7 | 11.7 ± 1.7 | 8.5 ± 1.6 | 7.8 |
| Mean cell volume (fl) | 79.3 ± 6.4 | 83.6 ± 6.6 | 77.9 ± 4.3 | 76.7 ± 3.1 | 78.2 |
Basic Features of Patients with Congenital Liver Diseases of Different Etiologies
In liver biopsy examination, 10 (21.3%) patients showed no fibrosis (stage 0), 6 (12.8%) had portal expansion without septum formation (stage 1), 13 (27.6%) showed rare septum formation (stage 2), 5 (10.7%) showed advanced fibrosis with numerous septum formation (stage 3), and 13 (27.6%) had cirrhosis (stage 4). Table 2 represents biochemical and hematologic comparisons for different liver fibrosis stages.
| Parameters | Stage 0 (N = 10) | Stage 1 (N = 6) | Stage 2 (N = 13) | Stage 3 (N = 5) | Stage 4 (N = 13) |
|---|---|---|---|---|---|
| Age (months) | 8.8 ± 10.1 | 3.9 ± 4.5 | 4.9 ± 3.3 | 13.6 ± 5.7 | 15.9 ± 16.5 |
| AST (IU/l) | 153.3 ± 130.2 | 186.8 ± 165.1 | 292.8 ± 392.2 | 136 ± 169.6 | 174.2 ± 186.4 |
| ALT(IU/l) | 135.2 ± 71.7 | 134.5 ± 107.4 | 328.1 ± 465.4 | 120.5 ± 159.8 | 152.1 ± 139.2 |
| ALP(IU/l) | 768.1 ± 573 | 948.5 ± 743 | 868 ± 514.5 | 563.5 ± 195.6 | 608.3 ± 544.7 |
| Total bilirubin (mg/ml) | 4.7 ± 7.2 | 4.4 ± 6.5 | 3.9 ± 6.5 | 1.1 ± 0.6 | 2.3 ± 2 |
| Red blood cell count (1012/l) | 4.4 ± 0.9 | 4 ± 0.3 | 4.6 ± 0.5 | 3.9 ± 0.6 | 4.1 ± 0.4 |
| White blood cell count (109/l) | 8.5 ± 3.8 | 9.3 ± 3.8 | 21.7 ± 7.5 | 16.5 ± 11.4 | 12.6 ± 6.7 |
| Platelet count (109/l) | 269.8 ± 120.4 | 320.5 ± 76.2 | 379.8 ± 146 | 303.8 ± 286.8 | 266.1 ± 168.6 |
| Hemoglobin (g/dl) | 10.9 ± 1 | 10 ± 1.6 | 11.9 ± 1.7 | 9.6 ± 2.9 | 10.7 ± 1.8 |
| Mean cell volume (fl) | 78.7 ± 8.6 | 79.3 ± 5.1 | 79.5 ± 5.9 | 79.9 ± 1.9 | 80.8 ± 5.7 |
Biochemical and Hematologic Comparisons for Different Liver Fibrosis Stages in 47 Children with Congenital Liver Diseasea
Considering non-invasive markers, including AAR, APRI, and FIB-4, the mean values were 1.16 ± 0.49, 2.12 ± 2.65, and 0.81 ± 2.52, respectively. There were no statistically significant correlations between these markers and fibrosis stages (Figure 1).
, FIB-4 (C), AAR (E), and platelet count (G), and spearman correlation coefficient of APRI (B), FIB-4 (D), AAR (F), and platelet count (H) of four non-invasive markers of liver fibrosis individual fibrotic stages.")
The mean values of APRI (A), FIB-4 (C), AAR (E), and platelet count (G), and spearman correlation coefficient of APRI (B), FIB-4 (D), AAR (F), and platelet count (H) of four non-invasive markers of liver fibrosis individual fibrotic stages.
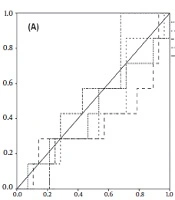
The ROC curve analysis showed that the highest AUC value for detecting minimal or no advanced fibrosis (stage 0, 1, and 2) was related to APRI (0.541, 95% CI: 0.335 - 0.747, P = 0.7). For advanced fibrosis and cirrhosis (stages 3, and 4), AAR (AUC; 0.622, 95%: 0.357 - 0.888, P = 0.3) showed the highest diagnostic index (Figure 2).
 curve analysis for the detection of minimal fibrosis (A) and advanced fibrosis and cirrhosis (B).")
Receiver operating characteristic (ROC) curve analysis for the detection of minimal fibrosis (A) and advanced fibrosis and cirrhosis (B).
In ROC analysis for individual fibrotic stages, the highest AUC for the diagnosis of fibrotic stages 0, 1, 2, and 3 were related to APRI (0.541), AAR (0.713), platelet count (0.692), and FIB-4 (0.694), respectively. For cirrhosis, FIB-4 rendered the highest AUC = 0.592 (Table 3). The highest sensitivity of APRI (70%) was obtained at the cut-off of 0.81 for cirrhosis. The highest specificities for APRI were related to cut-offs 0.66 (68%) and 1.37 (68%) for detecting fibrotic stages 0 and 2, respectively. Table 4 shows optimal cut-off values for non-invasive parameters along with their sensitivity and specificity for detecting different fibrosis stages.
| Fibrotic Stages | Receiver Operating Curve Analysis | ||
|---|---|---|---|
| Area Under Curve | 95% CI | P | |
| Fibrosis stage = 0 | |||
| A PRI | 0.541 | 0.335 - 0.747 | 0.7 |
| AAR | 0.378 | 0.112 - 0.643 | 0.3 |
| FIB-4 | 0.485 | 0.237 - 0.733 | 0.9 |
| Platelet count | 0.408 | 0.186 - 0.630 | 0.4 |
| Fibrosis stage = 1 | |||
| APRI | 0.473 | 0.197 - 0.749 | 0.8 |
| AAR | 0.713 | 0.532 - 0.895 | 0.1 |
| FIB-4 | 0.313 | 0.52 - 0.575 | 0.1 |
| Platelet count | 0.587 | 0.385 - 0.788 | 0.5 |
| Fibrosis stage = 2 | |||
| APRI | 0.517 | 0.292 - 0.742 | 0.8 |
| AAR | 0.402 | 0.154 - 0.650 | 0.3 |
| FIB-4 | 0.474 | 0.268 - 0.681 | 0.8 |
| Platelet count | 0.692 | 0.493 - 0.892 | 0.08 |
| Fibrosis stage = 3 | |||
| APRI | 0.355 | 0.007 - 0.717 | 0.3 |
| AAR | 0.605 | 0.380 - 0.830 | 0.5 |
| FIB-4 | 0.694 | 0.427 - 0.960 | 0.2 |
| Platelet count | 0.399 | 0.030 - 0.769 | 0.5 |
| Fibrosis stage = 4 | |||
| APRI | 0.540 | 0.322 - 0.758 | 0.7 |
| AAR | 0.508 | 0.307 - 0.709 | 0.9 |
| FIB-4 | 0.592 | 0.384 - 0.800 | 0.4 |
| Platelet count | 0.390 | 0.173 - 0.607 | 0.3 |
Receiver Operating Characteristic Analysis Regarding the Diagnostic Efficiency of Four Non-Invasive Markers of Liver Fibrosis in Different Fibrotic Stages
| Fibrosis Stages | Receiver Operating Curve Analysis | ||
|---|---|---|---|
| Cut-Off | Specificity | Sensitivity | |
| Fibrosis stage = 0 | |||
| APRI | 0.66 | 68% | 14% |
| AAR | 0.59 | 90% | 20% |
| FIB-4 | 0.15 | 53% | 42% |
| Platelet count | 207 | 31% | 85% |
| Fibrosis stage = 1 | |||
| APRI | 1.2 | 60% | 60% |
| AAR | 1.42 | 80% | 60% |
| FIB-4 | 0.3 | 57% | 40% |
| Platelet count | 322 | 67% | 60% |
| Fibrosis stage = 2 | |||
| APRI | 1.37 | 68% | 44% |
| AAR | 1.13 | 50% | 44% |
| FIB-4 | 0.11 | 39% | 66% |
| Platelet count | 319 | 70% | 66% |
| Fibrosis stage = 3 | |||
| APRI | 0.92 | 46% | 50% |
| AAR | 1.01 | 52% | 75% |
| FIB-4 | 0.18 | 52% | 75% |
| Platelet count | 268 | 39% | 50% |
| Fibrosis stage = 4 | |||
| APRI | 0.81 | 44% | 70% |
| AAR | 0.87 | 40% | 60% |
| FIB-4 | 0.21 | 60% | 70% |
| Platelet count | 290 | 46% | 50% |
| Minimal or no fibrosis | |||
| APRI | 1.13 | 58% | 57% |
| AAR | 0.93 | 43 | 42% |
| FIB-4 | 0.15 | 47% | 57% |
| Platelet count | 298 | 47 | 42 |
| Moderate to advanced fibrosis | |||
| APRI | 0.72 | 43% | 68% |
| AAR | 0.71 | 58% | 78% |
| FIB-4 | 0.18 | 58% | 53% |
| Platelet count | 245 | 58% | 71% |
Cut-Off Values with Respective Specificities and Sensitivities for Non-Invasive Liver Fibrosis Markers
5. Discussion
In the present study, we assessed the applicability of common non-invasive markers of liver fibrosis in predicting hepatic fibrotic stages in children with chronic hepatitis of different etiologies. APRI, AAR, and FIB-4 showed some extent of predictive capacity for the diagnosis of fibrosis in these patients. APRI and AAR showed the highest AUC values for detecting minimal and advanced fibrosis, respectively. However, individual analysis showed that the FIB-4 index might be a more appropriate parameter for detecting advanced fibrosis. Identifying reliable non-invasive markers for liver fibrosis is of critical importance in the management of various hepatic disorders. Non-invasive tests of livers fibrosis have been noted as appropriate alternatives for liver biopsy procedure (4, 11-13).
The validity of APRI has been established in predicting liver fibrosis of various etiologies (14, 15). In our study, APRI rendered AUCs 0.541, 0.355, and 0.540 for detecting minimal fibrosis (Stages 0, 1, and 2), advanced fibrosis (Stage 3), and cirrhosis (Stage 4), respectively. APRI also correlated with fibrosis stage (r = 0.1). In a study on patients with viral and autoimmune hepatitis, APRI correlated (r = 0.24) with fibrosis, which was in line with our results (16). In another report, however, APRI has not been associated with liver fibrosis in patients with immune hepatitis (17). In other studies, APRI has provided an AUC = 0.78 for detecting high-grade fibrosis (9).
We noticed that optimum thresholds of APRI for the diagnosis of fibrotic stages 0, 1, 2, 3, and 4 were 0.66, 1.2, 1.37, 0.92, and 0.81, respectively. Overall, the values for detecting minimal and advanced fibrosis were 1.13 and 0.72, respectively. The highest sensitivity (70%) of APRI was reached the cut-off = 0.81 for detecting cirrhosis (stage 4). This is while the highest specificities that were related to cut-off values 0.66 (68%) and 1.37 (68%) for detecting fibrosis stages 0 and 2, respectively. The desirable cut-off values of APRI for detecting fibrotic transformation in the liver could be highly variable considering the underlying etiologies of the liver fibrosis (8, 18). Although the optimum value of 0.93 has been noted in patients with hepatocellular, cholestatic liver disease, this value has been 2.35 in patients with hepatic biliary disease (19). In children with biliary atresia, optimal cut-off values for APRI were obtained at 1.01 and 1.41 for advanced fibrosis and cirrhosis, respectively (20). Generally, a cut-off value of 0.7 for APRI has been suggested as an indicator for predicting significant liver fibrosis (21). On the other hand, using cut-off values of ≤ 0.5 or ≤ 0.3 for ARPI may reliably rule out any fibrotic changes (8, 22). On the other hand, a value of ≥ 1.5 has been proposed as a strong indicator of severe fibrosis (8). In general, sensitivity and specificity of APRI are comparable to some high-resolution methods such as MR elastography and transient elastography-Fibro-Scan (7, 22-26).
Here, FIB-4 showed the highest AUC (0.592) for detecting cirrhosis. In correlation analysis, FIB-4 also correlated with fibrosis stage (r = 0.2). At the cut-off value of 0.21, FIB-4 showed the highest sensitivity and specificity (70% and 60%) for detecting cirrhosis. In line with these, FIB-4 has been described in association with fibrosis stages in immune hepatitis (17, 23) and HBV patients (15). In patients with HBV, FIB-4 yielded an AUC range of 0.750-1 for the diagnosis of advanced liver fibrosis (24, 27). FIB-4 is a sensitive index with comparable results with other sensitive methods such as fibro scan for fibrosis diagnosis (28). Nevertheless, the clinical application of FIB-4 needs to be validated for the etiology and stages of fibrosis, especially in pediatric populations.
In our study, the highest AUC for AAR was related to fibrosis stage = 1 (AUC = 0.713, 95% CI: 0.532 - 0.895). We noticed that the highest specificity for AAR was related to the cut-off value of 0.59 (90%) for detecting no fibrosis (stage = 0). On the other hand, AAR rendered the highest sensitivity (78%) for advanced fibrosis (stages 3 and 4) at the threshold of 0.71. In previous reports, AAR significantly correlated with hepatic fibrosis in HBV patients with an AUC of 0.586 for advanced fibrosis and cirrhosis (15). A cut-off value of ≥ 0.7 has been proposed for detecting advanced fibrosis with sensitivity and specificity of 87% and 39% in patients with HCV (9). In contrast, the value of ≥ 1.2 was proposed by Fouad et al. as the optimum level for the diagnosis of advanced fibrosis in HCV patients (10). One reason for these discrepancies may be the effects of some covariates such as age, obesity, metabolic disturbances, and viral load in infectious hepatitis that influence these factors (6, 25). To the best of our knowledge, this is the first report in children. One limitation of our study was the relatively low number of patients limiting the power of the study and reaching a significant level.
5.1. Conclusion
Our study assessed the applicability of non-invasive markers of APRI, AAR, and FIB-4 for detecting liver fibrosis in a childhood population with chronic hepatic diseases. Nevertheless, APRI, FIB-4, and AAR may be useful markers in predicting fibrotic transformation in children with various etiologies of hepatitis. In particular, APRI and AAR may be more applicable in detecting minimal fibrosis, while FIB-4 was more accurate in detecting advanced fibrosis and cirrhosis.
