1. Background
Viral classification and evolution could be based either on genome features (size/type of genome) or on their host range (1, 2). Though viruses are known to infect almost all spectra of living organisms, the fact that they require a host to survive and replicate, makes it difficult to study the evolutionary aspect of viruses in the traditional way. Furthermore, the complexities are added by the diversities within the viral genomes in different stains. The diversities include genome size, number of genes, mode of replication, level of virulence, and host range. Furthermore, the number of proteins encoded by a single viral genome range from two to about a thousand (3, 4). Though there have been multiple theories about the origin of viruses yet the debate over this subject is far from settled. However, our understanding of viral genome evolution has vastly improved with enhanced sequencing and bioinformatics tools. It is well understood that the 2 major forces driving genome evolution are transposable elements and tandem repetitive sequences (5, 6).
In the present study, the researchers looked into various aspects of Simple Sequence Repeats (SSRs), which are sequences of 1 to 6 nucleotide repeat motifs, present at varying number of iterations. The SSRs exhibit a ubiquitous presence, including prokaryotes, eukaryotes, and viruses (7-9). The SSRs are reported hot spots for recombination and random integration, thus forming the foundation of sequence diversity leading to genome evolution, which may also form the basis of diseases (10, 11). Besides, SSRs are known to be involved in gene regulation and protein function (12, 13). Elucidation of the importance of SSRs requires an understanding of factors, which influence their occurrence and complexity. These include genome features like size and GC content (14-16). The fact that this correlation has many exceptions, adds to the mystery of deciphering the role of SSRs in genomes.
The present study focused on Staphylococcus phage genomes, which infect Staphylococcus aureus. Their genomes encode potent staphylococcal virulence factors and have been classified to 3 categories on the basis of their size. The current study focused on 18 class II Staphylococcus phage genomes of genome size ~40 kb with an attempt to elucidate the presence, distribution, and complexity of SSRs in these genomes.
2. Methods
2.1. Genome Sequences
Genome sequences of 18 Staphylococcus phages were assessed by GenBank and FASTA formats from NCBI (http://www.ncbi.nlm.nih.-gov/) and subsequently analyzed for microsatellites. The features of studied Staphylococcus phage genomes have been summarized in Table 1.
| S.No | Genus: Phietalikevirus | Accession Number | GS, bp | GC, % | SSRa | cSSRa | RAb | RDc | cRAb | cRDc | cSSRd, % |
|---|---|---|---|---|---|---|---|---|---|---|---|
| S1 | Staphylococcus phage 11 | NC_004615.1 | 43604 | 34.49 | 200 | 12 | 4.59 | 30.55 | 0.28 | 5.07 | 6.00 |
| S2 | Staphylococcus phage 55 | KR709303.1 | 42309 | 35.7 | 194 | 9 | 4.59 | 30.04 | 0.21 | 3.45 | 4.64 |
| S3 | Staphylococcus phage 80 | DQ908929 | 42140 | 35.56 | 187 | 9 | 4.44 | 29.09 | 0.21 | 3.68 | 4.81 |
| S4 | Staphylococcus phage 80alpha | DQ517338 | 43864 | 34.1 | 204 | 11 | 4.65 | 30.18 | 0.25 | 4.17 | 5.39 |
| S5 | Staphylococcus phage Cnph82 | DQ831957 | 43420 | 34.67 | 209 | 9 | 4.81 | 31.55 | 0.21 | 3.25 | 4.31 |
| S6 | Staphylococcus phage Ipla5 | NC_018281 | 43581 | 34.72 | 191 | 9 | 4.38 | 28.41 | 0.21 | 3.60 | 4.71 |
| S7 | Staphylococcus phage Ipla7 | NC_018284 | 42123 | 34.75 | 216 | 13 | 5.13 | 33.76 | 0.31 | 4.84 | 6.02 |
| S8 | Staphylococcus phage Ipla88 | NC_011614 | 42526 | 34.91 | 183 | 9 | 4.30 | 28.27 | 0.21 | 3.17 | 4.92 |
| S9 | Staphylococcus phage Ph15 | NC_008723 | 44041 | 34.9 | 215 | 11 | 4.88 | 31.79 | 0.25 | 4.31 | 5.12 |
| S10 | Staphylococcus phage Phieta | NC_003288 | 43081 | 35.43 | 211 | 15 | 4.90 | 32.50 | 0.35 | 5.50 | 7.11 |
| S11 | Staphylococcus phage Phieta2 | NC_008798 | 43265 | 34.27 | 211 | 16 | 4.88 | 31.94 | 0.37 | 5.62 | 7.58 |
| S12 | Staphylococcus phage Phieta3 | NC_008799 | 43282 | 34.89 | 208 | 19 | 4.81 | 31.88 | 0.44 | 6.61 | 9.13 |
| S13 | Staphylococcus phage phimr11 | NC_010147 | 43011 | 35.63 | 193 | 8 | 4.49 | 29.34 | 0.19 | 3.09 | 4.15 |
| S14 | Staphylococcus phage phimr25 | NC_010808 | 44342 | 34.32 | 210 | 13 | 4.74 | 31.05 | 0.29 | 4.62 | 6.19 |
| S15 | Staphylococcus phage phinm1 | NC_008583 | 43128 | 34.15 | 219 | 13 | 5.08 | 33.20 | 0.30 | 5.12 | 5.94 |
| S16 | Staphylococcus phage phinm2 | DQ530360 | 43145 | 34.58 | 195 | 11 | 4.52 | 29.83 | 0.25 | 3.71 | 5.64 |
| S17 | Staphylococcus phage phinm4 | DQ530362 | 43189 | 34.73 | 213 | 13 | 4.93 | 32.67 | 0.30 | 5.00 | 6.10 |
| S18 | Staphylococcus phage Sap26 | NC_014460 | 41207 | 34.01 | 197 | 13 | 4.78 | 31.79 | 0.32 | 5.07 | 6.60 |
Overview of Simple and Compound Microsatellites in Complete Staphylococcus Phage Genomes
2.2. Microsatellite Extraction
The search for microsatellites was performed using the Imperfect microsatellite extractor (IMEx) software. The analysis was done using the ‘Advance-Mode’ of IMEx with parameters as reported earlier (17-23). Two SSRs separated by a distance of ≤ dMAX were treated as compound SSR (cSSR). For the initial analysis the dMAX value was 10. Other parameters were set as default.
2.3. Statistical Analysis
All statistical analysis was performed using Microsoft Excel. Linear regression was used to reveal the correlation between genome size and relative abundance/relative density of SSRs.
2.4. MATLAB-Based SSR Analysis
The use of IMEx to extract SSRs in a genome is well-documented (17-23). However, subsequent to SSR extraction, obtaining the gene locations as well as incorporation of SSRs in the genome is still a manual process. In order to expedite the same, this study developed 2 MATLAB based tools.
A) Identification of Gene Location from the NCBI Nucleotide File (IGLNNF)
www.pirotechnologies.com/cmdownloads/identification-of-gene-location-from-ncbi-nucleotide-file/
B) In-corporation of Gene Location in the SSR File (IGLSF)
www.pirotechnologies.com/cmdownloads/incorporation-of-gene-location-in-SSR-file/
IGLNNF obtains the gene locations from GenBank directly and saves it to (.xlsx) format whereas IGLSF incorporates the gene location in the SSRs file.
3. Results and Discussion
3.1. Prevalence of SSR and cSSR
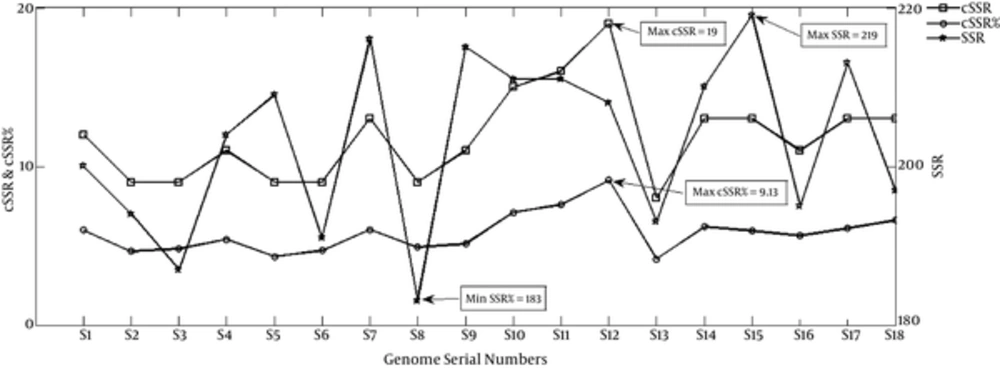
Genome-wide extraction of microsatellites across genomes of 18 Staphylococcus phages revealed a total of 3656 SSRs and 213 cSSRs (Figure 1 and Table 1, Supplementary files 1 (details of Distribution of SSRs Found in the Staphylococcus Phage Genomes) and 2 (details of Distribution of cSSRs Found in the Staphylococcus Phage Genomes)). The incident frequency of SSR per genome ranged from 183 (S8-Staphylococcus phage Ipla88) to 308 (S15-Staphylococcus phage phinm1). The variations in incident frequency may be due to differential genome size. However, this was not supported by 2 observations. First, the range of genome size in the study, 41207 bp for S18-Staphylococcus phage Sap26 (197SSRs) to 44342 bp for S14-Staphylococcus phage phimr25 (210SSRs) is too small to account for the observed range for SSR incidence. Secondly, even within this small range of genome size, a greater number of base pairs doesn’t account for more SSRs, as discussed above and evident in Table 1.
The incidence of cSSRs ranged from 8 (S13 Staphylococcus phage phimr11) to 19 (S12 Staphylococcus phage Phieta3) (Figure 1 and Table 1, and Supplementary file 2). As observed in SSRs, length of the genome wasn’t directly proportional to cSSR prevalence. Furthermore, for any given genome, more SSRs didn’t lead to higher cSSR incidence (Figure 1 and Table 1). In other words, the distribution of SSRs across the genomes was not uniform leading to an unequal SSR to cSSR conversion. This aspect has been represented as cSSR percentage as in the percentage of SSRs becoming a part of cSSR for a particular genome (Figure 1 and Table 1). The cSSR percentage ranged from 4.15 (S13 Staphylococcus phage phimr11) to 9.13 (S12 Staphylococcus phage Phieta3). The number of SSRs constituting compound microsatellites extracted in the analysis ranged from 2 to 3. The correlation studies for both SSR and cSSR with genome size and GC content have been discussed later.
In order to decipher the significance of these variations, it is important to consider the understanding of how species are defined for viruses. They don’t fit in the traditional definition and hence species of the same genus are much closely related than otherwise. Thus, they are expected to be similar at the genomic level. However, studies clearly suggest that this is not the case. Though the variations may be attributed to absence of mutation repair mechanisms, their significance is not only noteworthy yet gets highlighted if in the region of repeat sequences.
The absence of collinear relationship between genome size and microsatellite incidence is suggestive of their existence in a yet to be elucidated basis, as indicated by earlier studies on Ebolavirus, Alphavirus, Human Papillomavirus (HPV), Potexvirus, Carlaviruses, and Tobamovirus (17-23). These variations might be associated with the ability to expand their host range as observed for L5-like viruses (24). Also, keeping in mind that the number of protein encoding genes is constant for members of a particular virus species, the differential distribution of SSRs introduces variable potential in the genomes to evolve through copy number and sequence alterations. This is indeed the case for the virus world wherein a few members of any species have evolved faster than others.
3.2. Relative Abundance and Relative Density of SSR and cSSR
Relative Abundance (RA) = Number of SSRs/Size of genome in Kb
Relative Density (RD) = Total length covered by SSRs/Size of genome in Kb.
The RA of SSR ranged from 4.3 (S8) to 5.13(S7) and for cSSR, this ranged from 0.19 (S13) to 0.44 (S12) (Table 1, Figures 2 and 3). The RD of SSR ranged from 28.27 (S8) to 33.76 (S7) and for cSSR, this ranged from 0.36 (M53) to 5.76 (M52) (Table 1, Figures 2 and 3). The RA and RD in Staphylococcus phages is a representation of genomes being constituted of microsatellites and values therein are indicative of potential for genome evolution (25). This refers to the role of repeat sequences in inducing genome variations.
3.3. dMAX and cSSR
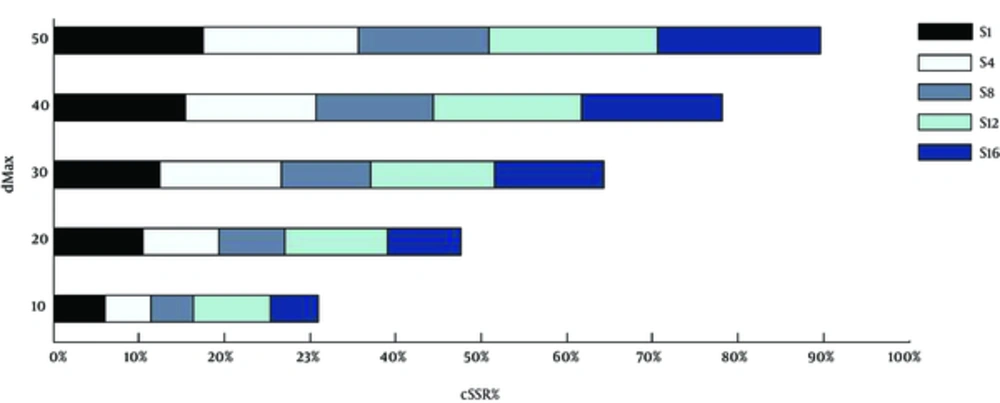
dMAX is defined as the maximum permissible distance between any 2 adjacent microsatellites and is used as a benchmark to classify cSSR (9). The reported cSSR so far had a dMAX value of 10 as mentioned in section 2.2. The current analysis was further extended by changing the dMAX value between 0 and 50 (26), in order to determine its impact on cSSR incidence on 5 randomly selected genomes, S1, S4, S8, S12, and S16. As expected, there was an increase in cSSRs percentage with higher dMAX in the studied genomes (Figure 4). However, the increase was neither linear nor uniformly proportional across the genomes. This non-linearity is suggestive of unequal distribution of SSRs as in the distance between one iteration to another is variable leading to unequal increase in cSSR percentage for the same increase in dMAX. The ability of repeat motifs to induce variations is often dependent on its proximity to other motifs and non-uniformity, therein indicates the possible variance in evolution potential of different parts of the same genome.
3.4. Motif types and Iterations
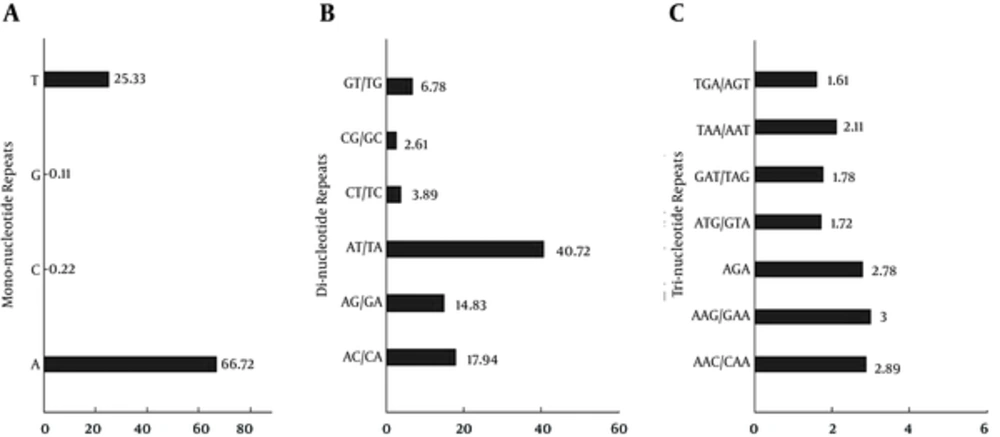
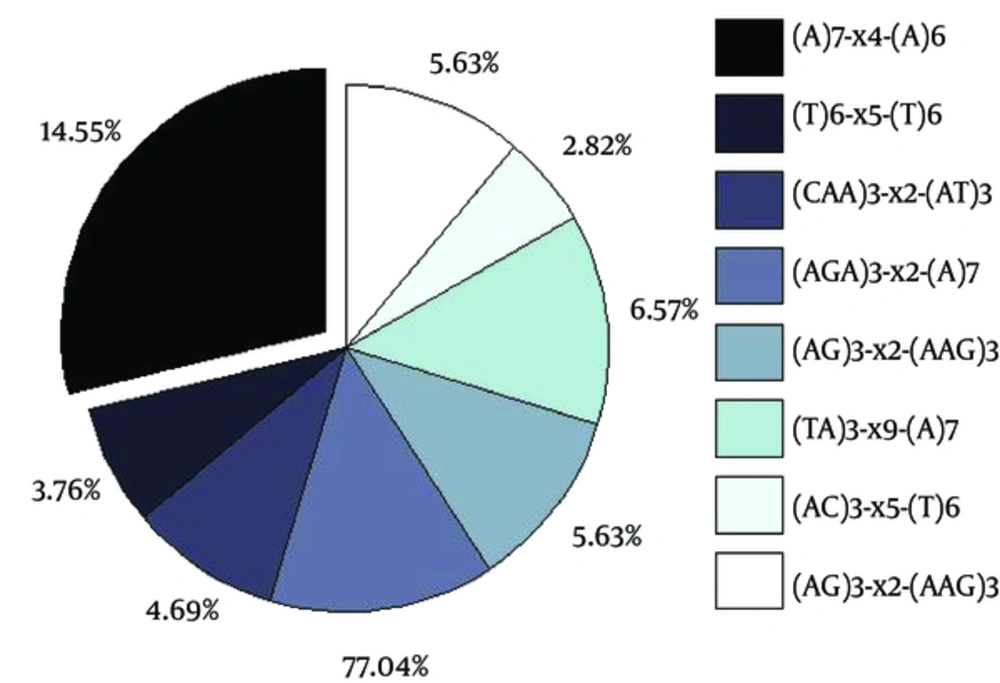
The divergence of repeat motifs extracted from Staphylococcus phage genomes ranged from mono- to hexa-nucleotides. The prevalent frequency of repeat motifs in each category is a reflection of the GC content of the genome, as indeed is the case here. The most prevalent mononucleotide motif was A repeat with an average distribution of over 65 while T comes a distant second with almost one-fourth of average distribution of A as represented in Figure 5A. The G and C mononucleotide motifs were least represented. The AT/TA were the most prevalent dinucleotide repeats with an average distribution of ~60 (Figure 5C) whilst AAG/GAA was the most represented in the trinucleotide category (Figure 5C). This marks an exception as the most represented trinucleotide motif is not solely comprised of A/T. Furthermore, the overall prevalence of cSSRs and its constituent motifs have been summarized in Figure 6.
A) Mono-nucleotides; B, di-nucleotides; and c, tri-nucleotides. This figure illustrates the average prevalence of repeat motifs across studied genomes. Notice the prevalence of “A” (Mono- nucleotides) and AT/TA (Di-nucleotides). However, AAC/CAA and AGA exhibited similar frequencies amongst the tri-nucleotides.
Notice the variations in incidence frequencies of observed cSSRs ranging from 14.55% to 2.82%. The details of the observed cSSRs have been listed in the box wherein “x” stands for any nucleotide between the two SSRs of a cSSR and the subscript number represents the number of nucleotides therein.
This research subsequently explored the number of iterations present at a stretch. A maximum of 8 repeats were present for mono-nucleotide A in several species. The di-nucleotide repeat motifs AT/TA and AG/GA had the highest iteration of 5 observed in S17, S19, and S21 (Supplementary file 1).
The motifs across different lengths in the studied Staphylococcus phage genomes suggests the AT rich genome of these viruses, which is indeed the case as highlighted by the GC content (~35%) of these genomes in Table 1. Furthermore, the AT/TA dinucleotide motif, being an established platform for SSR mutability and variability because of weak bonding between them compared to GC, provides the dynamic nature of these genomes. Also, repeat sequences are known to account for genome evolution and adaptation. This is accomplished through their ability to act as hot spots for mutation and association with strand slippage inducing copy number variations and polymorphisms (12, 27, 28).
3.5. SSRs/cSSRs in Coding Regions
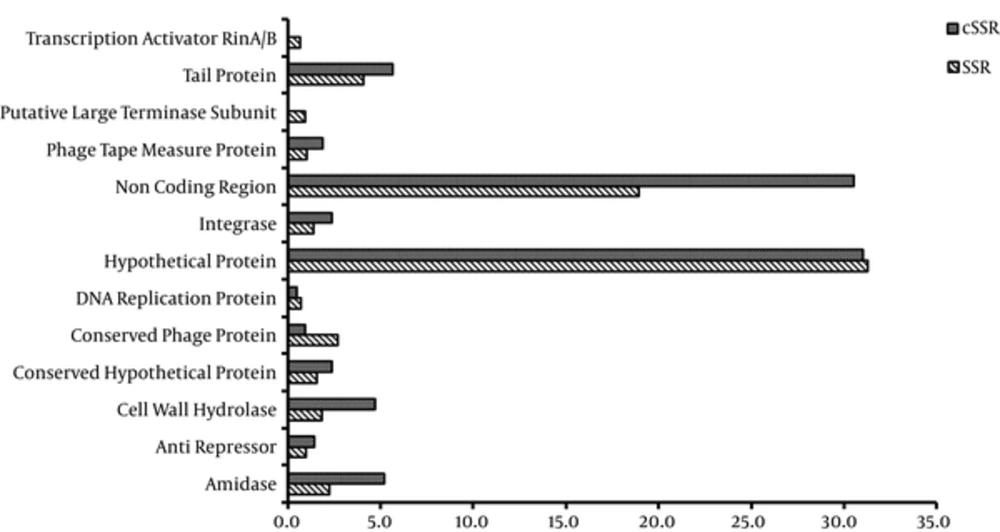
Thereon, the distribution of SSRs and cSSRs across coding and non-coding regions of the genomes was explored by IGLNNF and IGLSF. A total of ~50 proteins were obtained. This study used 12 proteins present in most species (Figure 7). As evident, the non-coding region accounted for ~19% in SSR and ~30% in cSSR while a hypothetical protein accounted for ~30% in SSRs as well as cSSR. For SSRs and cSSR, the tail protein stood a distant second with around 4% and ~6% representation of observed SSRs and cSSR. The actual scenario would be clear only when the genome and gene annotations are complete. However, coding regions account for over 80% and 70% of the total SSRs and cSSR, respectively. This has been observed by earlier studies (17-23) across a diverse set of viruses, the genomic potential for which is yet to be fully elucidated. In most of the already analyzed genomes, it has been observed that cSSRs occurrence in intergenic region is higher than that in the genic region. However, in the current analysis, low complexity of cSSR was observed in both coding and non-coding regions. In a recent study on Geminivirus, cSSRs was reported as site of recombination (29), thus ascertaining their role in evolution of viruses.
3.6. Correlation Studies
Correlation between genome size/GC content and number/relative abundance/relative density of SSRs and cSSRs was explored. The regression analysis of SSR (R2 = 0.1, P > 0.05), relative density (R2 = 0.001, P > 0.05), and relative abundance (R2 = 0.001, P > 0.05) showed a non-significant correlation with genome size. However, GC content was significantly correlated for SSR (R2 = 0.1 and P < 0.05), relative density (R2 = 0.1 and P<0.05), and relative abundance (R2 = 0.1 and P < 0.05).
Incidence of cSSRs was non-significantly correlated with genome size (R2 = 0.01, P > 0.05) and GC content (R2 = 0.1, P > 0.05). Similarly, relative density (R2 = 0.001, P > 0.05) and relative abundance (R2 = 0.001, P > 0.05) were non-significantly correlated with genome size and GC content, respectively; R2 = 0.1 and P > 0.05, and R2 = 0.1 and P > 0.05 for cSSR.
If a DNA sequence is an outcome of an equal probability for any base at any position, the incidence of repeat sequences should be dependent on nucleotide composition and length. The variations in GC content of the genome highlight that it is not the case per se. Also, all sequence combinations have unequal genomic and functional potential. This is illustrated by the observed non-significant correlations of genome size with SSR (RA and RD) and between genome size/GC content and cSSR (RA and RD). A positive correlation between GC content and SSR (RA and RD) could be attributed to composition of incident repeat motifs.
4. Conclusions
The comparative genomics of phages that infect a single common bacterial host could help with the understanding of the diversity and adaptability to new hosts. This would help in targeting phages for phage therapy, which is immensely helped by their host range (30). The mosaicism of S. aureus phages is suggestive of prevalent gene exchange within this phage group. These exchanges if represented at the nucleotide level are recent events, whereas homology of protein suggests distantly related phages. These features and other applications for Staphylococcus phages have been reviewed (31). This is what formed the basis of the current study as an attempt to explore and understand the Staphylococcus phage genomes. A total of 3656 SSRs and 213 cSSR were extracted from 18 studied genomes, predominantly localized to the coding region. The AT-rich content of genomes attributed to the highest prevalence of A, AT/TA and AAG/GAA in mono-, di-, and tri-nucleotide repeats, respectively. Though host adaptability is often considered the driving force behind microsatellite variability, the microsatellites composition appears to be genome species specific rather than host specific (32). In the present study, though the researchers were able to ascertain the presence of SSRs and the variations therein, in terms of incidence, composition, distribution, and clustering, their significance in terms of host adaptability couldn’t be ascertained, primarily owing to insufficient information about the host range of these viruses and incomplete functional annotation of genomes, which once fully deciphered would add functional relevance to the observed diversity in microsatellites.
