1. Background
Pistachio (Pistacia vera), as one of the most profitable products, mixed with the name of Iran, has allocated a large share of the country's non-oil revenue. Several virulence factors attack this plant during different stages of cultivation and processing. Pistachio die-back disease is one of the most important factors in reducing the amount of pistachio production in Iran. The disease was first observed in Kerman Province. The fungi isolated from infected branches of pistachio trees, was Paecilomyces variotii Bainier (1, 2). RFLPs have been used extensively for genetic studies (3), molecular mapping, and genetic improvement programs. The microsatellites take advantage of the abundant and ubiquitously distributed simple sequence repeats (SSRs) in the eukaryotic genome (4, 5). The variation in repeated number can be visualized as differences in the length of PCR-amplified products (6-8).
Using resistant cultivars is considered the most important disease management programs. Knowledge of genetic diversity within and among populations of the fungal pathogen is one of the most important aspects for knowing the biology of this pathogen. Thus, information about the diversity of the population may be used to develop methods to increase the durability of resistance. In a study, RAPD (Random Amplified Polymorphic DNA) markers were used to determine the vegetative compatibility that was observed considerable polymorphism. In this experiment, the 38 isolates of three different genetic groups were identified and the 19 vegetative compatibility groups were separated (VCGS) (2, 9). In another study, examining the genetic diversity was performed for P. fumosoroseus strains using PCR-RFLP markers on the rDNA-ITS (Internal transcribed spacer) region; the analysis of phylogenetic relationships confirmed results of genetic diversity by PCR-RFLP markers and 3 morphology groups were detected within this species (10). In a study on the isolation and detection, microsatellite loci was conducted for species P. fumosoroseus with 9 microsatellite markers, 26 strains were isolated, which differed according to their geographic location (11). To investigate polymorphisms in P. lilacinus using RAPD markers, significant differences were found between isolates of genetic diversity among isolates, but not in terms of geographical origin (10).
2. Objectives
In the present study, we examined two PCR-based marker assays, SSRs and PCR-RFLPs, for evaluating the genetic diversity in P. variotti.
3. Materials and Methods
3.1. DNA Extraction
Each isolate of P. variotti was grown on 100 ml of liquid potato dextrose medium. Cultures were maintained at 30 ± 1°C with shaking (150 rpm) for one week. Mycelia mats were harvested by filtration, washed 3 times with sterile distilled water and powdered with liquid nitrogen using a mortar and pestle, kept at -20°C. Genomic DNA was extracted from the pulverized mycelium using a modification of the cetyltrimethylammonium bromide (CTAB) extraction procedure described by Lubeck et al. (12).
3.2. PCR-RFLP
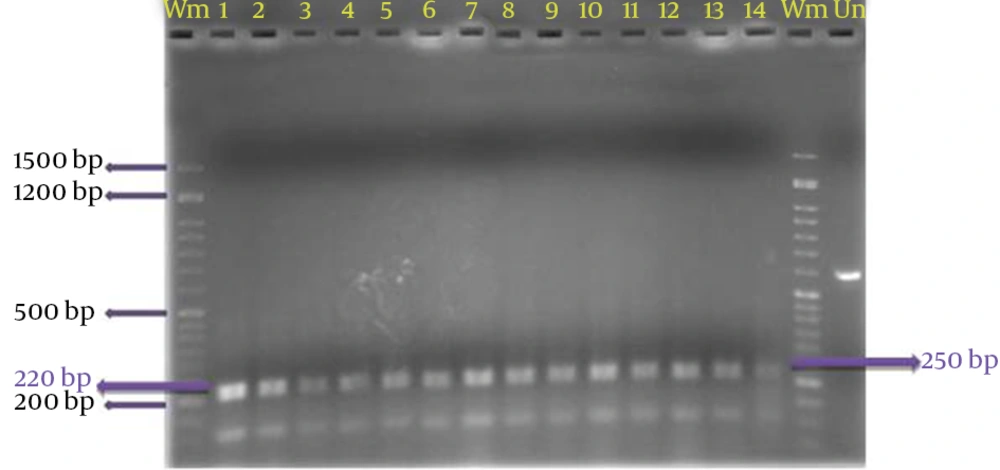
PCR amplification of the rDNA ITS1-5.8S-ITS2 region was achieved by a PCR System C-1000 (Eppendorf) thermocycler. For conventional PCR based DNA detection, primer combination forward TW81: 5'-GTTCCGTAGGTGAACCTGC-3' and reverse AB28: 5'-ATATGCTTAAGTTCAGCGGGT-3’ were used. Primers were synthesized by SPL Company (SPL, Life Sciences, Seoul, Republic of Korea). The reaction mix (50 μL) consisted of PCR buffer (10 mM Tris-HCl, 50 mM KCl, pH 9.0), 2.5 mM MgCl2, 0.2 mM of each dNTP (Roche), 0.2 μM of each primer, 1.25 units AmpliTaq DNA polymerase, and DNA template (in 5 μL) from target or non-target organisms, tested at different concentrations. Reagents were from GeNet Bio (South Korea) unless listed otherwise. MilliQ water was used instead of DNA template in the negative control. Annealing temperature (65°C), annealing time (30 to 60 seconds), and extension time (45 to 60 seconds) were optimized for the primer set during preliminary experiments. Finally, the PCR cycles consisted of an initial preheat at 94°C (5 minutes) and 35 cycles, each consisting of 1 minute denaturation at 94°C, annealing for 1 minute at 67°C, and 1 minute extension at 72°C. The reaction was ended with a final extension at 72°C for 10 minutes.
Restriction digestion was performed using EcoRI, MspI, MseI and MboI, on the instructions of each enzyme. For digestion, the samples were placed in water bath at 37°C. The bands resulting from the digestion were electrophoresed on 2% agarose gel and the size and number of fragments digested by each enzyme was recorded for each isolate. To confirm the size of the fragments resulting from digestion of the application, TotalLab (TL120 v2008) was used.
3.3. SSR
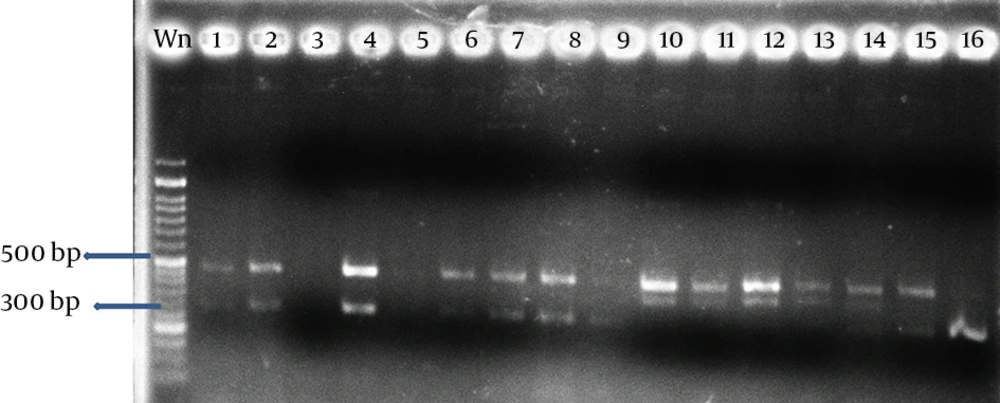
For SSR, 3 pairs of primers PfrBtD11a, PfrBtD11b and PfrBtB04 (11) was used (Thirty-five Thirty-five thermal cycles at 95°C (60 seconds), 48-54°C (60 seconds) and 72°C (60 seconds) to denaturation, the DNA binding and extension were considered. The products of the PCR reaction were electrophoresed on a 2% agarose gel electrophoresis system (Bio-Rad) voltage of 80 volts for 80 minutes.
| erPrim | No. of Alleles | Allele Size range, bp | Tα, °C |
|---|---|---|---|
| PfrBtD11a | 3 | 300-500 | 48 |
| F: GCGAATCTCGTCTTCAAC | |||
| R: CACTGGCACACGACACTC | |||
| PfrBtD11b | 2 | 300-500 | 50 |
| F: GAGTGTCGTGTGCCAGTG | |||
| R:GCTATGTGCGTGCTAGAT | |||
| PfrBtB04 | 4 | 100-500 | 54 |
| F: GTTGGTGCGGTGTGAGAG | |||
| R: ATGTAAGGCGATTGGCAG |
3.4. Data Analysis
Markers used in this study were dominant. To detect genetic variation, PopGene32 and GenAlEx 6.5b3 applications were used (13). Bands visible on agarose gel were ranked according to their presence (one) or absence (zero).
3.5. Cluster Analysis
Cluster analysis of data related to DNA fingerprinting was performed using the software NTSYS pc version 2.10. Accordingly, cluster analysis of the data was performed using the Jaccard coefficient and UPGMA algorithm. Corresponding dendrogram were drawn representing the genetic similarity or distance for isolates used in the test.
3.6. PCA
The heterozygosity index of the markers and effective multiple ratios were calculated to determine the most effective method for detecting genetic variation among isolates of P. variotii.

Effective multiple ratio (EMR), which represents the number of loci polymorphism in a germplasm is calculated according to the following equation (13).

Marker index (MI) as an indicator that shows the level of polymorphism can be used to estimate the efficiency of a marker in unknown germplasm, calculated using the method of Powell et al. (14).

4. Results
The multilocus RFLPs and all three PCR assays reliably discriminated the 20 P. variotti isolates. However, each of the PCR-based techniques differed in the type and degree of polymorphism detected. Moreover, the total number of assays varied for each marker system. Carried out an average of 3 primers used in marker SSR, the highest and lowest number of loci created by PfrBtD11a and PfrBtD11b, respectively. The 4 enzymes used in PCR-RFLP, all loci digested were polymorphic. Four restriction enzymes in PCR-RFLP, 20 loci digested that 90% of them were polymorphic, but with 3 primers of the SSR, 32 loci amplified that only 5.37% of them were polymorphic (Table 2).
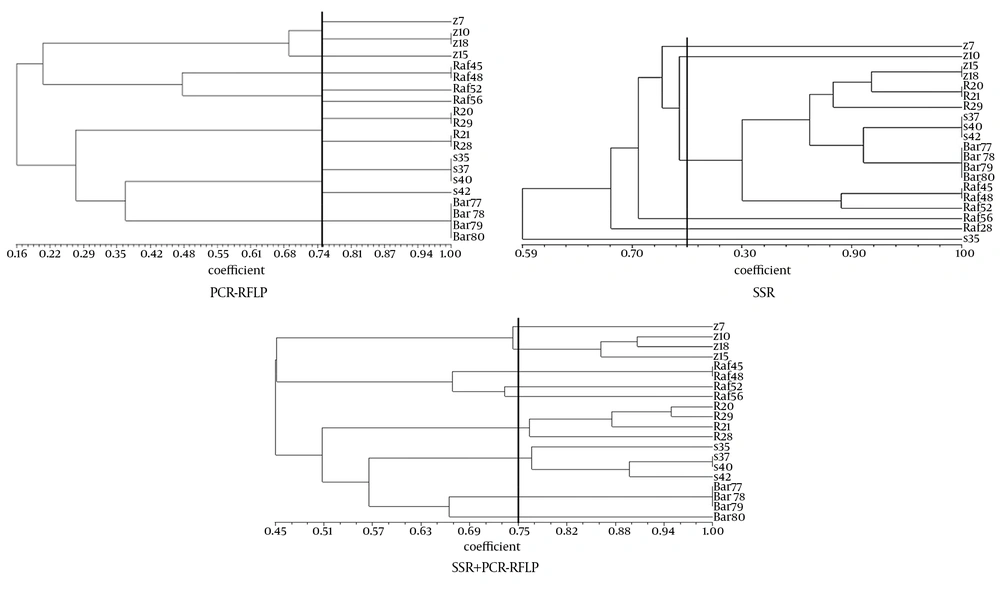
The results of the analysis of SSR and PCR-RFLP banding of data separately and combined together (Figure 1), were examined based on Jaccard coefficient of similarity (75%) (Figures 2 and 3). The genetic variation between markers in this study indicated that individuals within a colony lineage belong to a geographical area. Using allele frequencies, markers PIC, MI, and EMR were calculated for each marker separately. PIC levels determined by PCR-RFLP markers were higher compared to SSR markers, which indicate the ability of these markers in determining genetic variation.
| Primer | The Total Loci | Number of Polymorphic Sites | PIC | β | EMR | MI |
|---|---|---|---|---|---|---|
| PfrBtB04 | 6 | 3 | 0.9 | 0.5 | 1.5 | 1.35 |
| PfrBtD11b | 4 | 1 | 0.01 | 0.25 | 0.25 | 0.0025 |
| PfrBtD11a | 10 | 8 | 0.8 | 0.66 | 5.28 | 4.22 |
| EcoRI | 3 | 3 | 0.35 | 1 | 3 | 1.05 |
| MspI | 4 | 3 | 0.36 | 0.75 | 2.25 | 0.81 |
| MseI | 6 | 6 | 0.8 | 1 | 6 | 4.8 |
| MboI | 7 | 6 | 0.93 | 0.86 | 5.16 | 4.7 |
The Total Loci, Number of Polymorphic Sites, Polymorphic Information Content, Number of Polymorphic Bands, Effective Multiple Ratio and Marker Index That Both SSR and PCR-RFLP in Review of 20 Isolates of Paecilomyces variottia
5. Discussion
Two methods based on PCR, (SSR and PCR-RFLP) have been designed to determine the best way to determine the genetic diversity of 20 isolates of P. variotti. According to information, polymorphism obtained by the PCR-RFLP was higher than the SSR. In a study by Esselman et al. (15), which has been designed to determine the genetic diversity of fungi Calamargrostis porter ssp. by RAPD and ISSR markers. ISSR was more polymorphism than RAPD, because of the abundance regions in the genome of fungi. These differences can be explored in the present study with variation in genome sequences. Investigation revealed that regarding the variability of the ITS region, 6 parsimony informative sites were present, while some Aspergillus species cannot even be distinguished using ITS sequence data alone (16). The results of this research indicate that the isolates of an area are in the same colonial lineages and there is a specific relationship between the isolates of each area, whereas no relationship was identified between distribution and variety of the isolates and the distances of geological areas of Kerman province.
So we could not conclude that increasing or decreasing the distance between two areas, will increase or decrease the similarity range of the isolates. It should be noted that, although this fungi act as an opportunist agent on weak plants, it damages extensively and its variability percentage outspreads day to day over the province. Therefore, according to the grouping of the isolates, the controlling ways may vary depending on the weather conditions in different areas.


