1. Background
Diabetes mellitus is one of the most common endocrine and metabolic diseases; its prevalence is increasing worldwide (1). Oral disorders in patients with diabetes including infection (2, 3), gingivitis, periodontal disease (2-5), increment of severe candidiasis incidence (6), apical root abscess of the tooth, burning mouth syndrome (7), impairment of taste, increment of cell and proliferation of pathogenic microorganisms, incidence of coated tongue, halitosis, cytoplasmic vacuoles, double nuclear and many other cellular lesions caused by hyperglycemia were reported in patients with diabetes (8-10). Sores of oral squamous epithelium and gingivitis are the most common symptoms in patients with diabetes (7). In healthy subjects, the epithelium of oral mucosa creates a protective barrier against carcinogens. Progressive atrophy of oral mucosa in patients with diabetes due to a reduction of pH and the salivary flow can cause reduction of this protective barrier and may increase the risk of malignancy in these patients (1). Associated with malignant disease, the relationship between diabetes, leukoplakia, erythroplakia and lichen planus is considered (2, 11-13). Ahmed et al. reported that the prevalence of oral lichen planus in patients with diabetes was 6.9% (14). Ujpal et al. showed that the frequency of benign tumors and the precancerous lesions of oral mucosa were 14.5 % and 8% respectively in patients with diabetes (4). It seems that the assessment of cell markers in exfoliative oral cells could be a simple technique in early diagnosis of oral malignant lesions and evaluation of its extent in the route of malignancy treatment (15).
Using the immunocytochemical techniques in evaluation of expression of various proteins in oral lesions and tumors can be very useful (16). A few studies have been conducted about immunocytochemistry on oral exfoliative cell. Using immunohistochemistry on smear of a normal persons, as well as those of cases with benign and moderate dysplasia, Scott et al. showed that minichromosome maintenance proteins (MCM) expression was negative in all the cases (17). Brunotto et al. studied cytomorphometric evaluation of oral smears of patients with lichen planus and squamous cell carcinoma lesions using Bcl-2, p21, Ck14 and p53 as markers. Their results showed that p53 and Bcl-2 were expressed in 45% and 55% of the samples, respectively (18).
p53 is a tumor suppressor gene located on the short arm of chromosome 17 and its product is a DNA-binding phosphor-nucleoprotein that prevents the progression of cell division from G1 to S (19). This protein is a product of the most common mutated gene in cancers, particularly cancers of oral cavity; it is a tumor suppressor gene (20). Mutations in this gene are very common and can cause a stable protein which does not prevent mitosis and accumulates in the cell nucleus. Using immunohistochemical staining, it is detected in many tumors (19). Increased expression of p53 could be a sign of deactivation of apoptosis, and because of this, the p53 mutation is important in causing cancer, which is frequently seen in various neoplasm such as squamous cell carcinoma (21). Accompanied with the mutation in p53, protein products with long half-lives (4-8 hours) are created which accumulate enough in the cell nucleus and get stained well (22).
2. Objectives
In this study for the first time, we tried to modify the immunohistochemistry technique for detection of p53 protein in smear of the exfoliated oral mucosal cells and then compare its expression in patients with type 2 diabetes and healthy controls to use this noninvasive technique for early detection of oral premalignant and malignant changes caused by diabetes.
3. Patients and Methods
In this case-control study, 50 patients with type 2 diabetes (22 males and 28 females) and 50 healthy controls (23 males and 27 females) were enrolled. Sampling was performed by convenience probability method. The groups were matched in terms of age and gender. The members of the patients group were selected from the patients who referred to the diabetes clinic of Ali Asghar Hospital, Zahedan for their routine checkups. Members of the control group were selected from the patients' fellows. Their nondiabetic states were approved following fasting blood sugar (FBS) test. Subjects with a history of diabetes for 2-8 years were considered as the case group. The inclusion criterion was defined as type 2 diabetes for at least six months from the date of diagnosis. The exclusion criteria were consuming tobacco, alcohol or nondiabetes-related drugs, anemia, any severe oral infection, buccal cancer or other malignancies, systemic diseases such as kidney failure, liver diseases, rheumatic diseases, pregnancy and menopause.
After confirmation of the disease occurrence by an endocrinologist, ethical approvals for recruitment were obtained from the Ethics Committee of Zahedan University of Medical Sciences (No. 90-1761) and written informed consents were taken from all the patients as well as the healthy individuals. The participants’ information was registered in prepared data sheets. Three slides from the buccal mucosa of all the participants were prepared and the immunocytochemistry technique was performed.
3.1. Immunocytochemistry Techniques
Each smear was spread on a prepared glass, clean and dry slide which had previously been numbered and was immediately sprayed by Pathofix (Padtan Company, Iran) from a distance of 25 cm and with a pressure of 2 bar max. The samples were rehydrated by descending alcohol and placed in citrate buffer (pH = 6). After washing with Tris-buffered saline (TBS), the samples were exposed to peroxidase, protein blocker, primary antibody, secondary antibody, and polymer, and then washed with TBS buffer after each stage. At the end, they were stained with chromogen and hematoxylin. The slides were evaluated microscopically for the intensity of p53 expression afterwards. The positive control was a slide of colon tumor and the negative control was a tissue of normal colon adjacent to malignant tissue. Counting started from one side of the slide. Within each slide, 100 intact unfold and unrepeated cells were evaluated. Based on the staining intensity, the cells were classified in four groups; without expressing p53 (0), mild staining (1), moderate (2), and severe (3). The coded slides were reviewed by two expert histologists blindly. To compare the intensity of p53 expression between the groups, nonparametric Mann-Whitney test was performed. P values less than 0.05 were considered statistically significant. The nucleus area (NA) and the cytoplasmic area (CA) in the cells were estimated using the Cavalieri point counting method (23). Within each slide, 25 intact unfold and unrepeated cells were evaluated morphologically. The Spearman correlation coefficient was used to investigate the relationship between NA, CA, cytoplasm to nuclear ratio (CNR) and FBS and the staining intensity.
4. Results
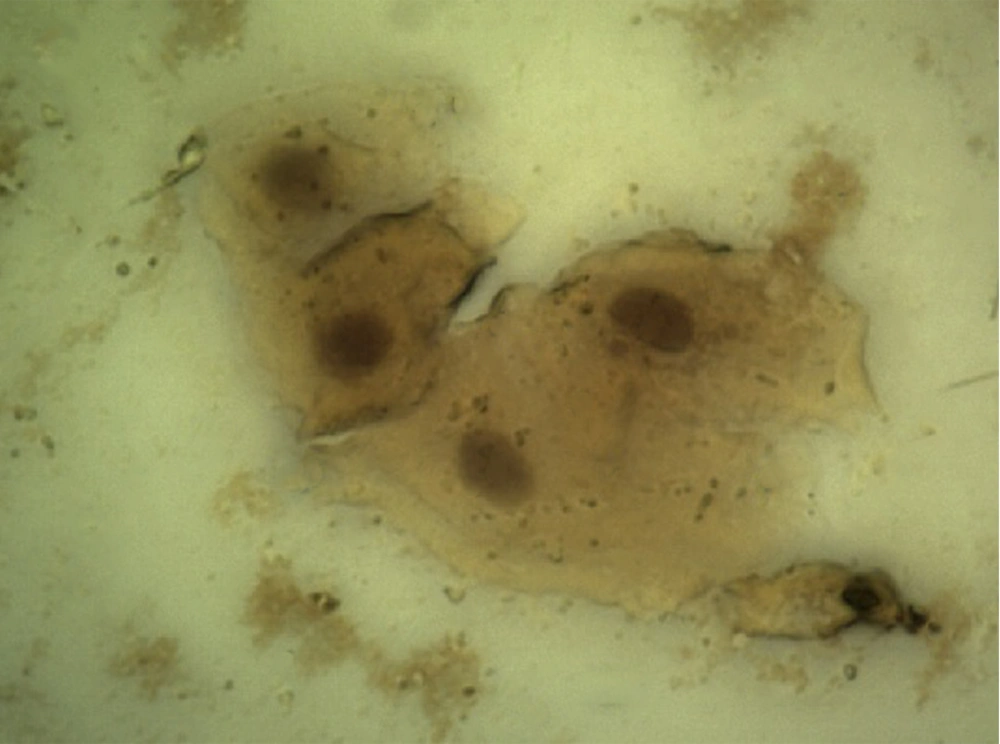
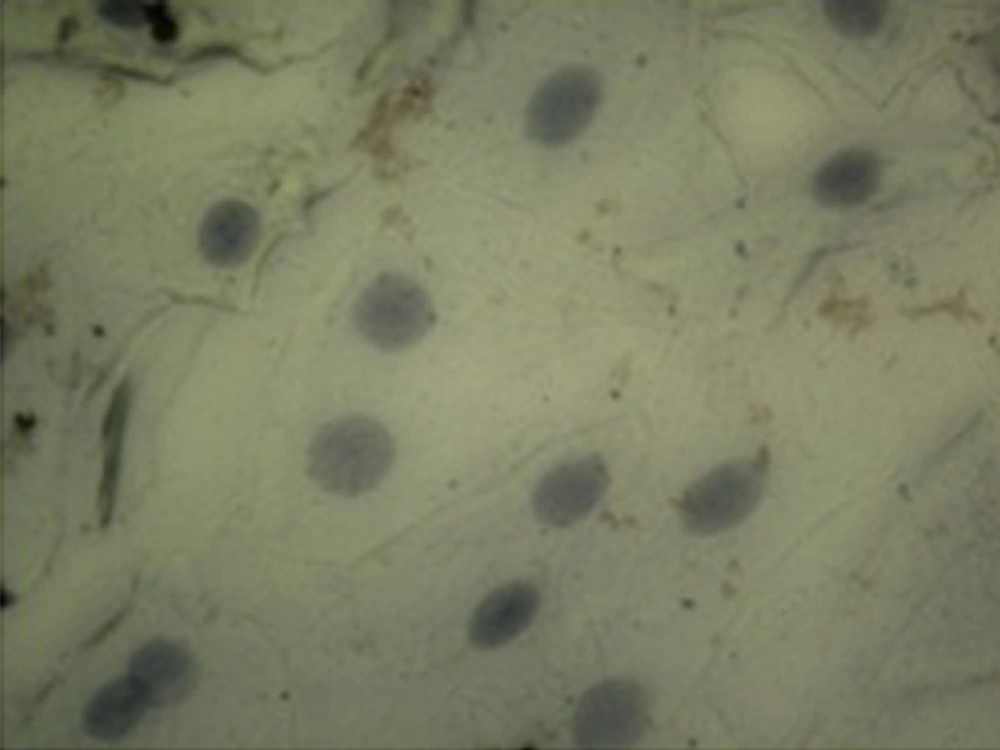
Demographic data of diabetic patients was compared with the control group. According to this data and considering the fact that both groups were homogenized in terms of age and gender, there was no significant difference between the two studied groups (P > 0.05). Evaluation of p53 immunocytochemistry showed that the intensity of p53 expression in oral mucosal exfoliative cells in diabetic patients significantly increased compared with healthy subjects (P < 0.05) (Table 1), (Figure 1, and 2). The mean percentage of p53 positive cells in oral mucosa of diabetic patients was 78.6 ± 6.933 and it was 1.2 ± 0.546 in the control group. Statistical analysis using the nonparametric Spearman's test showed a correlation between the level of FBS and the intensity of p53 expression (P < 0.001, r = 0.816) (Table 2).
The blood sugar levels and the percentage of p53 expression were analyzed and the correlation between the two variables was statistically significant (r = 0.833, P < 0.001) (Table 2). The relationship between NA and CNR and p53 expression, using the Spearman correlation coefficients, were statistically significant (P < 0.05). (NA, r = 0.272, P = 0.08; CNR, r = -0.434, P = 0.005). The cytoplasmic area and the staining intensity showed no significant correlation (P > 0.05).
| Correlation Coefficient | Probability b | |
|---|---|---|
| p53 and NA | 0.272 | 0.08 |
| p53 and CA | NS | |
| p53 and CNR | -0.434 | 0.005 |
| p53 and FBS | 0.816 | 0.00 |
a Abbreviations: CA, Cytoplasmic Area; CNR, Cytoplasm to Nuclear Ratio; FBS, Fasting Blood Sugar; NA, Nucleus Area; NS, Not Significant.
b P < 0.0001.
5. Discussion
The results of the present study showed a significant increase in p53 expression in oral mucosal exfoliated cells in diabetic patients compared to healthy controls (P < 0.05). There was a significant correlation (r = 0.816, P < 0.001) between the intensity of p53 expression and the FBS level as well. Between the percentage of p53-positive cells and the FBS level, a significant correlation was observed (r = 0.833, P < 0.001). The relationship between NA and CNR with the expression of p53 was significant (NA, r = 0.272, P = 0.08; CNR, r = -0.434, P = 0.005).
The results of this study showed that expression of p53 protein in exfoliated cells of oral mucosa in diabetic patients was more than healthy controls. Increments of NA and CNR in exfoliated cells of oral mucosa of diabetic patients compared with healthy controls were observed. In agreement with our results, an experimental study that conducted by Vairaktaris et al. on normal and diabetic rats using biopsy of oral mucosa revealed that p53 expression in oral mucosa of diabetic rats’ markers was more than normal rats (24).
An immunohistochemical study by Girtan et al. on oral mucosal biopsies of patients with type 1 diabetes indicated an increased expression of p53 in nucleus of basal cell (25). Agha Hosseini et al. studied the biopsy of oral mucosa in patients with lichen planus. Their results indicated the increment of p53 expression in oral mucosa of patients compared with healthy subjects (26). Abrahao et al. studied the oral mucosal biopsies of patients with leukoplakia, erythroplakia, squamous cell carcinoma and hyperplasia of oral epithelium. They showed that the expression of p53 in these conditions increased (27). Mohtasham et al. studied 27 patients with fibrosis hyperplasia, 40 with leukoplakia and 28 with oral squamous cell carcinoma. The comparison between the groups showed that p53 increased in benign, premalignant and malignant tissues (28).
Atrophy of mouth, leukoplakia and squamous cell carcinoma of oral mucosa are common in patients with diabetes (25). Nylanders showed that the expression of p53 protein in supra basal layers of the dysplastic epithelium mainly in squamous cell carcinoma can be a marker for the progression of these lesions (29). In tumors, loss of wild-type p53 function deactivates the growth control pathway causing uncontrolled growth of the tumor cell (30). In evaluation of exfoliative cells of oral mucosa of diabetic patients, cytomorphometric changes such as increase in size of the nucleus were observed. The cells progress toward malignancy is associated with these changes (12, 13).
The significant correlation between the intensity of p53 expression and NA in diabetic patients may be due to decrease in keratinization followed by decrease in cellular turnover (31). This study showed that by increasing the expression of p53 CNR reduced, which may occur because of an enlarged nucleus in oral mucosal cells of diabetic patients, while cytoplasm stays unchanged, as has been reported in most studies (1, 3, 31, 32). Preservation of the cytoplasm size is a compensatory mechanism to maintain the cell size in stress condition (1).
Findings of the present study indicated an increased p53 expression in oral mucosal exfoliative cells of diabetic patients; cytomorphometric changes include increment in NA and reduction in CNR. These changes were observed for the first time with modification applying a simple and noninvasive immunocytochemistry method on oral exfoliated cell smears.
Given the high prevalence of premalignant and malignant diseases of oral mucosa in patients with diabetes, further studies are required in this field. This noninvasive and simple method could be used in screening and early detection of oral malignant diseases in these patients.

