


1. Background
The optimal reference gene for normalization in gene expression studies should be consistently expressed and remain unaffected by disease states. Housekeeping genes, such as ACTB, GAPDH, and ribosomal genes, are fundamental for basic cellular functions and are generally expected to be stably expressed under various conditions. However, recent studies have shown that their expression can vary depending on the specific gene, cell type, and experimental conditions (1). Viral infections can significantly alter host cellular and metabolic pathways to facilitate efficient replication and evade the immune system, thereby further disrupting the expression of housekeeping genes and complicating their use in normalization processes (2). Therefore, it is crucial to validate the stability of the chosen normalizing gene in the specific cells under study to ensure accurate analysis of target gene expression (3).
In quantitative real-time PCR (qPCR), mRNA levels are normalized using housekeeping genes to reduce measurement errors caused by variations in sample quality and RNA extraction methods. While housekeeping genes are typically stable across different tissues and conditions, no single gene is universally ideal, as their expression can vary. This highlights the importance of carefully selecting and validating multiple reference genes to ensure reliable qPCR results (4). The high sensitivity and accuracy of qPCR make it an indispensable tool in virology for evaluating gene expression profiles and measuring viral load in response to infections (5). The reliability of qPCR results depends on a stable reference for normalizing variations between samples and runs, which can arise from differences in nucleic acid integrity, reverse transcription efficiency, and sample loading amounts. Common normalization references include total nucleic acid concentrations, rRNA concentrations, or the expression of housekeeping genes — the latter being the most widely used method. However, the assumption that housekeeping genes maintain consistent expression regardless of experimental conditions is not always valid. Consequently, selecting appropriate control genes is crucial, as variations in their expression can compromise the assay’s sensitivity and lead to misleading results (3, 6).
This is particularly important for identifying the genes associated with glioblastoma and neuroblastoma (NB), two aggressive cancers that currently have no effective treatments and poor prognoses. Patients with these conditions often face a limited life expectancy (7, 8), which highlights the urgent need to determine the genes involved in developing effective treatments precisely. Real-time PCR technology can significantly aid this effort by providing valuable insights into the molecular mechanisms underlying these diseases. Researchers can ensure precise and reliable results by selecting a suitable housekeeping gene, facilitating further discoveries in the field (9).
While extensive research has identified reliable housekeeping genes in cells infected with various viruses, no studies have been conducted on suitable reference genes in glioblastoma and NB cell lines infected with lentivirus. Lentiviral vectors are extensively utilized for stable gene knockdown experiments due to their ability to efficiently integrate into the host genome. In the present study, we employed a lentivirus-based system to specifically downregulate MATR3, a nuclear matrix protein implicated in RNA metabolism, genome maintenance, and nuclear architecture (10). While the primary goal was targeted suppression of MATR3, it became evident that lentiviral infection itself exerts broader, unintended consequences on host gene expression. The integration process favors transcriptionally active genomic regions, which can perturb the expression of nearby genes, while viral proteins, such as integrase and Vpr, may modulate host transcription factors and chromatin structure. Furthermore, lentiviral infection can activate innate immune responses and cellular stress pathways, leading to systemic alterations in the transcriptomic landscape. Importantly, these effects were observed to compromise the expression stability of housekeeping genes traditionally considered reliable for qRT-PCR normalization. Thus, in studies involving lentiviral transduction, it is critical to revalidate candidate reference genes to avoid misinterpretation of gene expression data. Our work emphasizes the necessity of selecting robust internal controls under virus-modified cellular conditions, ensuring that observed changes in target gene expression, such as MATR3, truly reflect biological phenomena rather than technical artifacts induced by infection (11-13).
2. Objectives
Therefore, in this study, we aimed to identify and validate stable housekeeping genes for accurate normalization of qRT-PCR data in glioblastoma (U87) and NB (SH-SY5Y) cell lines after MATR3 knockdown by lentiviral infection, and to use this approach to better understand the downstream cellular effects of MATR3 suppression.
3. Methods
3.1. Production of Lentiviral Vectors
To produce lentiviruses, the second-generation lentiviral system, comprising three plasmids — pCDH-CMV-MCS-EF1α-GFP (System Biosciences, USA), psPAX2 (Addgene #12260), and pMD2.G (Addgene #12259) — was simultaneously co-transfected into HEK-293T cells. Plasmid DNA was amplified using Escherichia coli DH5α and purified with a standard plasmid extraction kit (Qiagen, Germany). HEK-293T cells were cultured in high-glucose DMEM (Gibco) supplemented with 10% fetal bovine serum (FBS), 110 mg/L sodium pyruvate (Thermo Fisher Scientific), and 1% penicillin-streptomycin at 37°C with 5% CO₂. On day one, 7 × 10⁶ cells were seeded in a 10-cm dish. On day two, transfection was performed using Lipofectamine 3000 (Invitrogen) according to the manufacturer’s protocol. Cells were incubated at 37°C in a humidified atmosphere containing 5% CO2. After 24 hours, GFP expression was confirmed under a fluorescence microscope. At 48 hours post-transfection, the supernatant containing lentiviral particles was harvested, filtered through a 0.45 μm PVDF filter, and concentrated using a Lentivirus Concentrator (OriGene, USA).
3.2. Lentiviral Titration
To determine the lentiviral titer, approximately 7 × 10⁴ HEK-293T cells were plated in each well of 12-well plates. The cells were then infected with 5 μL of concentrated lentivirus at various dilutions. The media was changed the day after transduction. Forty-eight hours after transfection, GFP expression in the cells was analyzed using flow cytometry. The lentiviral titer was calculated using the following formula: (Seeded cells × % GFP-positive cells / Volume of virus) × 100 / μL of viral solution.
3.3. Multiplicity of Infection Optimization
To determine the optimal multiplicity of infection (MOI), preliminary transduction experiments were performed. A total of 7 × 10⁴ U87 cells and 5 × 10⁴ SH-SY5Y cells were seeded in 12-well plates and infected with lentiviral particles at varying MOIs (1, 3, 5, 11) in the presence of 10 μg/mL polybrene. After 72 hours, GFP expression was assessed using fluorescence microscopy and flow cytometry. An MOI of 3 was selected for U87 cells, and an MOI of 5 for SH-SY5Y cells, as these conditions resulted in ≥ 80% GFP-positive cells while maintaining high cell viability and minimal cytotoxic effects.
3.4. Lentiviral Transduction
The human glioblastoma U87 and NB SH-SY5Y cell lines were seeded at densities of 5 × 10⁵ cells/well and 7 × 10⁵ cells/well, respectively, in 6-well plates. Cells were cultured in DMEM supplemented with 10% fetal bovine serum (FBS) and maintained at 37°C in a humidified atmosphere containing 5% CO₂ until they reached approximately 80% confluence. The following day, cells were transduced with concentrated lentiviral particles at a MOI of 3 for U87 cells and an MOI of 5 for SH-SY5Y cells, in the presence of 10 µg/mL polybrene (Sigma-Aldrich, Germany) to enhance transduction efficiency. After 24 hours of incubation with the virus, the medium was replaced with fresh complete medium. Seventy-two hours post-transduction, GFP expression was evaluated using fluorescence microscopy to confirm successful transduction. Cells were then harvested, lysed, and total RNA was extracted to evaluate the expression of MATR3 and to investigate whether the expression of other genes was affected following lentiviral transduction. Experiments were conducted in three biological replicates and three technical replicates each.
3.5. RNA Extraction
Total RNA was extracted from transduced cells using the RNeasy mini kit (Qiagen) according to the manufacturer’s protocol. Briefly, cells were lysed with the provided RLT buffer containing β-mercaptoethanol, and the lysates were homogenized. RNA was selectively bound to a silica membrane, washed with RW1 and RPE buffers to remove contaminants, and finally eluted in RNase-free water. RNA concentration and purity were determined by measuring absorbance at 260/280 nm and 260/230 nm using a D30 Eppendorf BioSpectrometer. Only samples with appropriate purity ratios (260/280 ≈ 2.0 and 260/230 > 2.0) were used for downstream quantitative reverse transcription PCR (qRT-PCR) analysis.
3.6. Complementary DNA Synthesis
Complementary DNA (cDNA) was synthesized from 1 μg of total RNA using random primers (Sigma-Aldrich, St. Louis, MO, USA) and Moloney murine leukemia virus reverse transcriptase (M-MLV RT, Invitrogen, Carlsbad, CA, USA), following the manufacturer’s protocol. Initially, RNA and random primers were mixed and heated at 85°C for 5 minutes, then quickly cooled. Reverse transcription was performed in the presence of M-MLV buffer, dithiothreitol (DTT) (20 mM), deoxynucleotide triphosphates (dNTPs) (0.5 mM), and M-MLV RT enzyme (5 U/μL) at 37°C for 1 - 2 hours. The resulting cDNA was stored at -20°C until further analysis.
3.7. Quantitative PCR
The quantitative reverse transcription PCR (qRT-PCR) protocol was utilized to accurately evaluate the expression levels of reference genes. Specifically, 4 μL of cDNA, diluted at a ratio of 1:10, was combined with 6 μL of a reagent mixture containing all necessary components for the PCR reaction. This mixture included PowerUpTM SYBRTM Green master mix (Applied Biosystems, Foster City, CA, USA), specific forward and reverse primers targeting the housekeeping genes, and sterile water to achieve a final reaction volume of 10 μL. The amplification of the fluorescent PCR products was monitored using a QuantStudio 5 real-time PCR system, equipped with a 96-well, 0.1 mL block (Thermo Fisher Scientific, Waltham, MA, USA). The thermal cycling parameters were carefully established as follows: An initial denaturation phase at 95°C for 2 minutes, followed by 35 amplification cycles. Each cycle included denaturation at 95°C for 15 seconds, annealing at 60°C for 30 seconds, and extension at 72°C for 30 seconds. Additionally, each reaction was conducted in triplicate.
3.8. Statistical Analysis
Gene stability was analyzed using GeNorm (pairwise variation) (8), BestKeeper [standard deviation (SD) and coefficient of variation (CV) of cycle threshold (Ct) values] (14), NormFinder (model-based approach) (15), and the ΔCt method. RefFinder was used to integrate the results.
4. Results
4.1. Selection of Candidate Reference Genes
For the U87 cell line, the expression of genes encoding ACTB, HPRT, GAPDH, RPS23, RPL32, α-tubulin (TUB), 18S, and TBP was quantified. For the SH-SY5Y (ECACC) cell line, ACTB, HPRT, GAPDH, RPII, RPL32, TUB, and 18S were used as reference genes (Table 1). Primers were designed using either the PrimerBank online tool or manually using SnapGene software. Primer design adhered to the following criteria: Melting temperature (Tm) of 60 ± 1°C; GC content of 40% - 60%; the length of the DNA pieces was between 18 and 24 base pairs, and the size of the amplicons measured 100 to 200 base pairs. Gel electrophoresis was used to check the size of the PCR products and ensure that no primer dimers were present. A 10-fold serial dilution of cDNA was performed to establish a standard curve for assessing the efficiency of reverse transcription quantitative PCR (RT-qPCR) for each gene and treatment. This was achieved using linear regression analysis. The efficiency (E) was calculated with the equation: E = (10[-1/slope] - 1) × 100. Primers that exhibited a coefficient of correlation (R²) greater than 0.98 and efficiencies ranging from 97% to 114% were selected for further RT-qPCR analysis (Table 1).
| Housekeeping Gene | Primer Sequence (5′-3′) | Length (bp) | Efficiency (%) | R2 | Slope |
|---|---|---|---|---|---|
| U87 | |||||
| RPL32 | F: 5′-CACCAGTCAGACCGATATGTCAAAA-3′; R: 5′-TGTTGTCAATGCCTCTGGGTTT-3′ | 65 | 97.1 | 0.99 | -3.39 |
| RPS23 | F: -5′-GGTGCTTCTCATGCAAAAGGA-3′; R: 5′-GCAACCGTCATTGGGTACAAA-3′ | 144 | 105.8 | 0.99 | -3.18 |
| ACTB | F: 5′-GGCTGTATTCCCCTCCATCG-3′; R: 5′-CCAGTTGGTAACAATGCCATGT-3′ | 154 | 98.07 | 0.97 | -3.37 |
| HPRT1 | F: 5′-CAGTCCCAGCGTCGTGATTA- 3′; R: 5′-GGCCTCCCATCTCCTTCATG- 3′ | 167 | 110.8 | 0.99 | -3.08 |
| 18S | F: 5′-GTAACCCGTTGAACCCCATT- 3′; R: 5′-CCATCCAATCGGTAGTAGCG-3′ | 151 | 110.8 | 0.99 | -3.08 |
| GAPDH | F: 5′-GAGGGTGGTGCCAAGAAAGT-3′; R: 5′-TGGCTTGGGTCGTAGGCATCA-3′ | 93 | 114 | 0.99 | -3.02 |
| TUB | F: 5′-CCCAGCTAAATAGTAACACCCG-3′; R: 5′-ATGCGGCATTTGATGGTGATA-3′ | 175 | 114.6 | 0.99 | -3.01 |
| TBP | F: 5′-TTCGGAGAGTTCTGGGATTGTA-3′; R: 5′-TGGACTGTTCTTGACTCTTGGC-3′ | 227 | 104.9 | 0.99 | -3.20 |
| SH-SY5Y (ECACC) | |||||
| RPL32 | F: 5′-CACCAGTCAGACCGATATGTCAAAA-3′; R: 5′-TGTTGTCAATGCCTCTGGGTTT-3′ | 65 | 96.6 | 0.99 | -3.42 |
| RPII | F: 5′-GCACCACGTCCAATGACAT-3′; R: 5′-GTGCGGCTGCTTCCATAA-3′ | 267 | 100.3 | 0.99 | -3.31 |
| GAPDH | F: 5′-GAGGGTGGTGCCAAGAAAGT-3′; R: 5′-TGGCTTGGGTCGTAGGCATCA-3′ | 93 | 109.9 | 0.99 | -3.10 |
| TUB | F: 5-CCCAGCTAAATAGTAACACCCG-3′; R: 5- ATGCGGCATTTGATGGTGATA-3′ | 175 | 105.6 | 0.99 | -3.19 |
| ACTB | F: 5′-GGCTGTATTCCCCTCCATCG-3′; R: 5′-CCAGTTGGTAACAATGCCATGT-3′ | 154 | 108.1 | 0.99 | -3.14 |
| HPRT1 | F: 5′-CAGTCCCAGCGTCGTGATTA- 3′; R: 5′-GGCCTCCCATCTCCTTCATG- 3′ | 167 | 104.2 | 0.99 | -3.22 |
| 18S | F: 5′-GTAACCCGTTGAACCCCATT- 3′; R: 5′-CCATCCAATCGGTAGTAGCG -3′ | 151 | 108 | 0.99 | -3.1 |
4.2. Expression Profiles of Candidate Reference Genes
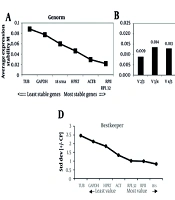
The analysis of housekeeping genes revealed a wide range of expression levels, with Ct values ranging from 14 to 34. These genes were classified according to their expression levels. The highly abundant 18S rRNA, which constitutes a significant portion of total RNA in the cell, exhibited Ct values below 15 cycles. Genes associated with highly expressed mRNAs, such as TUB and GAPDH, had most of their Ct values between 18 and 24 cycles. The expression levels of RPII, RPL32, and RPS32 ranged from 22 to 27 cycles. Moderately expressed genes, including HPRT1 and TBP, showed Ct values between 25 and 30 cycles, while ACTB had Ct values ranging from 29 to 33 cycles (Figure 1).
 values the candidate genes evaluated in A, SH- SY5Y and B, U87")
Cycle threshold (Ct) values the candidate genes evaluated in A, SH- SY5Y and B, U87
4.3. Analysis of Gene Expression Stability in Lentivirus-Transduced SH-SY5Y (ECACC)
4.3.1. GeNorm Analysis
GeNorm calculates a stability measure (M) for each gene and pairwise variation (Vn/Vn+1). The GeNorm algorithm ranks reference genes by iteratively removing the least stable gene. Genes with higher M-values are less stable; conversely, lower M-values indicate greater stability. An M-value below 0.5 indicates high stability, while 0.5 < M < 1.0 suggests moderate stability. GeNorm analysis suggests that all tested genes are suitable reference genes in the SH-SY5Y cell line, with the optimal combination being RPII and RPL32 (Figure 2A). The housekeeping genes analyzed exhibited a broad spectrum of expression levels. To identify the ideal number of reference genes for effective normalization, we calculated the pairwise variation (Vn/Vn+1) between sequential normalization factors (NFn and NFn+1) using the GeNorm program. A Vn/Vn+1 value below 0.2 is generally considered acceptable, suggesting that including an additional reference gene would not substantially enhance normalization. Although incorporating more housekeeping genes may reduce variation, this is not guaranteed and may prove unnecessary. As shown in Figure 2, two housekeeping genes are acceptable for normalization in the SH-SY5Y cell line (Figure 2B).
 in SH-SY5Y (left to right, respectively); B, optimal number of control genes for normalization for SH-SY5Y (left to right, respectively; C, genes ranked by stability value with NormFinder algorithm; D, standard deviation (SD) with BestKeeper; and E, comprehensive gene stability.")
GeNorm, NormFinder, and BestKeeper analysis in the SH-SY5Y cell line. A, genes ranked by their calculated average expression stabilities (stability increases from left to right) in SH-SY5Y (left to right, respectively); B, optimal number of control genes for normalization for SH-SY5Y (left to right, respectively; C, genes ranked by stability value with NormFinder algorithm; D, standard deviation (SD) with BestKeeper; and E, comprehensive gene stability.
4.3.2. NormFinder Analysis
It was performed to evaluate candidate reference genes in SH-SY5Y cell lines and assess the stability of gene expression. NormFinder calculates a stability value by integrating both inter- and intra-class variations, with lower values signifying greater reliability. The M-values, which reflect the stability of the reference genes, were analyzed for each candidate. The results indicated that the ACTB gene had the lowest M value among the virus-infected samples, recorded at 0.2. Additionally, the optimal combination of two reference genes identified was ACTB and HPRT, which demonstrated a stability value of 0.173. The analysis also revealed that RPII and RPL32 are considered relatively stable internal reference genes, each exhibiting an M value of less than 0.5 (Figure 2C).
4.3.3. BestKeeper Analysis of Candidate Reference Genes
The average Ct values for each sample were analyzed using BestKeeper software. BestKeeper assesses stability by examining the CV and SD. Reference genes that exhibit high CV and SD values are considered unstable for normalization purposes. A lower SD value indicates greater stability. According to the BestKeeper analysis, the reference gene 18S has the best stability with an SD value of 0.83, while TUB is the least stable, with an SD value of 2.45 (Figure 2D). Generally, an SD value greater than 1 is considered unacceptable for accurate normalization. Based on the criteria SD [x-fold] < 2 and SD [Ct] < 1, the genes 18S, RPII, and RPL32 are considered acceptable reference genes according to the BestKeeper algorithm (Table 2).
| Name Gene | 18S-rRNA | ACTB | HPRT | TUB | GAPDH | RPII | RPL32 |
|---|---|---|---|---|---|---|---|
| Coeff. of corr. [r] | 0.74 | 0.99 | 0.99 | 0.92 | 0.96 | 0.85 | 0.85 |
| Coeff. of det [r2] | 0.54 | 0.97 | 0.97 | 0.84 | 0.91 | 0.72 | 0.72 |
| Geo mean [CP] | 13.23 | 34.96 | 27.40 | 21.35 | 20.58 | 25.88 | 24.14 |
| Ar mean [CP] | 13.27 | 35.00 | 27.48 | 21.54 | 20.73 | 25.91 | 24.17 |
| Min [CP] | 11.87 | 32.84 | 24.51 | 17.67 | 17.43 | 24.60 | 22.62 |
| Max [CP] | 15.29 | 38.06 | 30.57 | 24.97 | 24.43 | 27.61 | 25.92 |
| Std dev [± CP] | 0.83 | 1.34 | 1.85 | 2.46 | 2.12 | 0.99 | 1.01 |
| CV [% CP] | 6.27 | 3.83 | 6.74 | 11.40 | 10.23 | 3.81 | 4.20 |
| Min [x-fold] | -2.56 | -4.33 | -7.40 | -12.83 | -8.88 | -2.44 | -2.87 |
| Max [x-fold] | 4.19 | 8.55 | 8.97 | 12.25 | 14.43 | 3.30 | 3.44 |
| Std dev [± x-fold] | 1.78 | 2.53 | 3.61 | 5.49 | 4.35 | 1.98 | 2.02 |
4.3.4. RefFinder Analysis
We also utilized the online software RefFinder, which incorporates four algorithms — Delta Ct, GeNorm, NormFinder, and BestKeeper methods — to compare and rank the candidate reference genes we analyzed. The reference genes that obtained the top rankings were considered the most consistently expressed under the experimental conditions assessed. The RefFinder tool offers a comprehensive ranking that merges results from four software programs. GeNorm, BestKeeper, and NormFinder analysis using RefFinder provided results similar to those obtained with the main software using Microsoft Excel. Based on the integrated outcomes from NormFinder, GeNorm, BestKeeper, and Delta-Ct analyses with RefFinder, the genes with the highest stability in lentivirus-infected SH-SY5Y samples are ACTB, RPL32, and RPII (Figure 2E).
4.4. Analysis of Gene Expression Stability in Lentivirus-Transduced U87 Cells
4.4.1. GeNorm Analysis
The findings from the GeNorm analysis showed that RPS23 and HPRT exhibited the lowest M-values in lentivirus-infected samples, recorded at 0.39, indicating they are the most stable reference genes. In contrast, ACTB was found to be the most unstable reference gene for normalization, exhibiting an M value of 2.52 (Figure 3A). Furthermore, the pairwise variation analysis (Vn/Vn+1) conducted by GeNorm identifies the optimal number of genes needed for reliable normalization. The V2/3 value of 0.18 indicates that adding a third reference gene is unnecessary for precise normalization (Figure 3B). GeNorm analysis using RefFinder produced similar results, identifying RPS23 and HPRT as the most stable genes, thereby reinforcing the observation.
 in U87 (left to right, respectively); B, optimal number of control genes for normalization for U87 (left to right respectively; C, genes ranked by stability value with NormFinder algorithm; D, standard deviation (SD) with BestKeeper; and E, comprehensive gene stability.")
GeNorm, NormFinder, and BestKeeper analysis in the U87 cell line. A, Genes ranked by their calculated average expression stabilities (stability increases from left to right) in U87 (left to right, respectively); B, optimal number of control genes for normalization for U87 (left to right respectively; C, genes ranked by stability value with NormFinder algorithm; D, standard deviation (SD) with BestKeeper; and E, comprehensive gene stability.
4.4.2. NormFinder Analysis
The analysis revealed that TUB, with an M value of 0.36, was the most stable reference gene for accurate normalization. The study identified that the best combination of two genes for stability is GAPDH and TUB, which has a stability value of 0.28. In contrast, ACTB was the least stable reference gene, with an M value of 1.1, according to the NormFinder analysis (Figure 3C). Additionally, it is important to note that the NormFinder results, when analyzed using RefFinder, identified 18S as the most stable housekeeping gene, rather than TUB, according to the GeNorm main algorithm.
4.4.3. BestKeeper Analysis
The analysis identified TBP (SD = 0.35) as the best and HPRT (SD = 2.32) as the most unstable reference gene for normalization purposes (Figure 3D). Typically, a SD above 1 is considered unsuitable for precise normalization. BestKeeper results are based on SD and CV (Table 3).
| Name Gene | TUB | HPRT | GAPDH | RPs23 | RPL32 | 18S | ACTB | TBP |
|---|---|---|---|---|---|---|---|---|
| Coeff. of corr. [r] | 0.34 | 0.98 | 0.45 | 0.97 | 0.92 | 0.87 | -0.39 | -0.55 |
| Coeff. of det. [r2] | 0.12 | 0.95 | 0.20 | 0.95 | 0.84 | 0.75 | 0.15 | 0.30 |
| Geo mean [CP] | 21.25 | 27.75 | 21.20 | 24.79 | 22.42 | 12.37 | 33.70 | 26.75 |
| Ar mean [CP] | 21.28 | 27.87 | 21.24 | 24.91 | 22.54 | 12.43 | 33.74 | 26.76 |
| Min [CP] | 19.84 | 24.81 | 19.08 | 21.87 | 20.39 | 11.24 | 31.40 | 25.93 |
| Max [CP] | 23.32 | 31.71 | 22.68 | 28.35 | 26.01 | 15.29 | 37.03 | 27.71 |
| Std dev [± CP] | 1.02 | 2.32 | 0.99 | 2.10 | 2.28 | 0.95 | 1.44 | 0.35 |
| CV [% CP] | 4.79 | 8.34 | 4.68 | 8.45 | 10.14 | 7.66 | 4.25 | 1.30 |
| Min [x-fold] | -2.65 | -7.65 | -4.37 | -7.54 | -4.08 | -2.20 | -4.91 | -1.77 |
| Max [x-fold] | 4.21 | 15.62 | 2.78 | 11.84 | 12.03 | 7.57 | 10.06 | 1.95 |
| Std dev [± x-fold] | 2.03 | 5.01 | 1.99 | 4.30 | 4.87 | 1.93 | 2.71 | 1.27 |
The top two or three housekeeping genes were consistently ranked highest across the NormFinder, GeNorm, and BestKeeper algorithms, although the specific rankings varied slightly among them. RefFinder identifies 18S and GAPDH as the optimal reference genes for the U87 cell line study, confirming them as adequate choices (Figure 3E).
5. Discussion
Glioblastoma multiforme (GBM) and NB are cancers of the nervous system that are challenging to diagnose and treat (16). Lentiviruses significantly advance our understanding of glioblastoma, aiding in the development of new therapeutic strategies. They also serve as useful tools for investigating tumor biology and analyzing the functions of various cellular pathways and proteins, including their potential as therapeutic targets (17). Research has highlighted the potential of lentiviruses as a novel treatment method for NB and other malignant tumors. However, numerous studies have demonstrated that viral invasion can lead to considerable alterations in gene expression within cells, including the expression of housekeeping genes (18).
Due to the potential effects of viral infections on housekeeping gene expression, it is essential to choose stable housekeeping genes for normalization in gene expression studies. By utilizing stable housekeeping genes as internal controls, researchers can accurately evaluate changes in gene expression caused by viral infections while minimizing the impact of variations in housekeeping gene expression (19). Given the poor prognoses and limited progression-free survival times of glioblastoma and NB, it is crucial to select suitable reference genes to ensure that QPCR analysis accurately identifies the genes involved in these cancers (20).
Given the lack of a comprehensive study on identifying stable housekeeping genes in U87 and SH-SY5Y cell lines following lentiviral transduction, this research employed three primary software tools — BestKeeper, NormFinder, and geNorm — along with an online platform (RefFinder) to evaluate the stability of eight common housekeeping genes in U87 and seven in SH-SY5Y cell lines. The results from this study, using geNorm, indicate that RPS23 and HPRT exhibit more stable expression levels in U87 cells than other housekeeping genes. According to NormFinder, TUB and GAPDH were ranked highest. In contrast, BestKeeper and Delta Ct ranked 18S and GAPDH as the top two genes. However, when combining the findings from all four programs using RefFinder, 18S was ranked first and GAPDH second. Across all software tools, ACTB consistently received the lowest rankings, suggesting that it is an unstable gene and therefore unsuitable for normalizing QPCR data.
According to geNorm pairwise analysis, adding more reference genes is not recommended if the Vn/n+1 value is below 0.2. In our study, the geNorm V value for the two most stable reference genes was 0.18, indicating that including a third stable gene for normalizing expression data is unnecessary.
This finding is consistent with previous reports where 18S rRNA was identified as a robust reference gene in specific cell models but unstable in others, depending on the viral context (21). In a study involving four viruses, it was found that, unlike our results, 18S rRNA was an unstable housekeeping gene during viral infection. However, similar to our findings, ACTB was also found to be consistently unreliable as a normalization gene (3).
Interestingly, the next highest-ranked gene we identified, GAPDH, has been shown to exhibit high variability in expression. The GAPDH gene is involved in many cellular processes, which could explain the variability in its expression beyond just glycolysis. Similar findings were observed in other studies (22-24), highlighting the caution needed when selecting GAPDH as a reference gene, aligning with our observation of moderate variability for GAPDH in lentiviral-infected cells.
Several studies have evaluated the stability of GAPDH as a reference gene and found significant variability in its expression, suggesting caution in its use as a reference in certain contexts (25-27). In the SH-SY5Y cell line, the most stable genes identified by NormFinder, geNorm, and Delta Ct analysis were ACTB and HPRT, although BestKeeper ranked them fourth and fifth, respectively. According to geNorm criteria (M-values < 0.5), all seven genes demonstrated acceptable stability. However, the pairwise comparisons (V-values < 0.2) indicated that using two housekeeping genes for normalization is sufficient. Additionally, the RefFinder tool provides a comprehensive final ranking by integrating results from Delta Ct, geNorm, NormFinder, and BestKeeper. Based on this analysis, ACTB and RPL32 were ranked as the most stable genes, occupying the first and second positions, respectively. All analysis software consistently identified TUB as the least stable gene, marking it as the most variable.
This observation regarding TUB instability is also supported by previous studies, which showed TUB instability during viral infections (28, 29). Ribosomal proteins (RPs) are essential components of ribosomes and are among the most highly conserved proteins across various biological samples. Numerous studies have indicated that certain ribosomal genes can reliably serve as internal reference genes for quantitative analysis. For instance, RPL32 has been identified as a suitable reference gene (30, 31). Our identification of RPL32 as a stable gene in SH-SY5Y cells is consistent with these findings, further supporting the reliability of RPs as reference genes across diverse biological contexts (32). Our findings also align with other studies showing that the ACTB gene is highly appropriate as a housekeeping gene in both normal and cancerous cells (33, 34). However, some reports reveal that ACTB is an unstable housekeeping gene (3). A study on NB involving three housekeeping genes — GAPDH, 18S RNA, and ACTB — found that GAPDH was the most stable (35). This partially agrees with our results in SH-SY5Y cells, where GAPDH also showed relatively stable expression, although ACTB and RPL32 ranked higher overall.
To summarize, 18S and GAPDH emerged as the most effective qPCR control genes in the U87 cell line. On the other hand, HPRT and ACTB proved to be consistently unreliable and should be used with caution in research involving lentiviral-infected U87 cells. In contrast, ACTB and RPL32 were the most stable housekeeping genes in SH-SY5Y (ECACCC), while all software tools consistently identified TUB as the least stable and most variable gene.
Notably, our comprehensive data, when compared with other studies, revealed that the stability of housekeeping genes can vary significantly depending on the type of virus used. Furthermore, even within the same virus model, gene stability can differ across different cell lines. These findings highlight the importance of considering both the type of virus and the cell line when selecting optimal housekeeping genes for normalization.
Additionally, these results underscore the need for careful validation of reference genes in various experimental settings, as the selection of stable genes can greatly impact the accuracy of gene expression analysis across research contexts. The insights from this study can be applied not only to lentiviral-infected cell lines but also to other viral models and cancer research, where reliable reference genes are essential for precise data normalization.
