1. Background
Immunomodulatory agents that are capable of up-regulating the chicken immune system’s responsiveness may assist the bird to mount a more appropriate and efficient response to infectious agents and vaccines. Natural polysaccharides have recently been found to act as potent immunomodulating agents (1, 2). Soluble polysaccharides are the main components among different constituents of aqueous extracts from plants and algal species that are responsible for immunomodulatory activities (3, 4). Different polysaccharides show different biological effects that are related to their structural features including molecular weight and chemical compositions (5-7).
Chlorella by-product (CBP) is a microalgal biomass residue after oil extraction for use in industry. In general, CBP is known to contain beneficial biological compounds including polysaccharides, proteins, and various antioxidants (8, 9). The crude polysaccharides (CPs) derived from CBP or other natural resources are a heterogeneous mixture of polymers and can be separated into different fractions using anion-exchange chromatography. Such isolated polysaccharide fractions may show higher immunomodulatory behavior than CP, which makes them worthy to be assessed in immune cell systems (7).
Peripheral blood mononuclear cells (PBMCs) are any white blood cells having round nuclei such as lymphocyte and monocyte. These cells are critical components in the immune system to fight infectious agents by the production of various cytokines and antibodies (10-12). The level of immunostimulatory cytokines could reflect the host’s immune capabilities to struggle pathogenic agents (13). Among immunostimulatory cytokines, the role of chicken interleukin 2 (IL-2) in the activation of T cells is of crucial importance. Furthermore, it has been demonstrated that IL-2 activates heterophils that are equal to mammalian neutrophils (14). Hence, there is a known role in the activation and maintenance of both acquired and innate immune defense for IL-2 (14). Interferon γ (IFN-γ) is also a cell-mediated immunity cytokine that activates macrophages and promotes Th1-biased responses (15).
Response-surface methodology (RSM) is a useful tool to predict the effects of other surfaces or levels of factors that are not used in the experimental work to allow a more exact calculation of the response surface. Therefore, the identification of the optimal level of the factors can be accomplished adequately using commercially available Design Expert software through the RSM approach. RSM not only gives valuable insight into individual effects of important factors but also helps define interactions between the factors on a given response (16).
Robust immunomodulation of aqueous extracts of Chlorella has been previously shown in mice and human blood cells but to the best of our knowledge, there was no study regarding the effects of CBP polysaccharides on chicken immune cells (12). On the other hand, no experiment was published using historical-data design to optimize the immunomodulator’s activity in chicken immune cells.
2. Objectives
The aim of this study was to find the optimum conditions regarding the immunomodulatory polysaccharide and its concentration that favor IFN-γ and IL-2 gene expressions in PBMCs in vitro by applying the historical-data design of RSM approach.
3. Methods
3.1. Materials
Dried biomass of green algae Chlorella vulgaris was purchased from SurNature Biological Technology Co., Ltd. (Xi’an, China). CBP was prepared after solvent-mediated extraction of lipids from the algal biomass using the mechanical solid shear method (17). CBP was kept at -20°C before the start of the extraction process. Chemicals and reagents with analytical grade were utilized in the present study.
3.2. Extraction and Fractionation of Polysaccharides
Before the extraction of polysaccharides, substances such as carotenoid and chlorophyll-related pigments with lipophilic characteristics, as well as low-molecular-weight proteins, were removed according to a method by Tabarsa et al. (18). Briefly, 20 g of CBP powder was first mixed with 200 mL of 85% ethanol and kept at room temperature overnight with nonstop stirring. After centrifugation at 9500 g for 10 minutes, the collected precipitate was treated with acetone and put at room temperature to dry. The dried biomass was soaked in 400 mL distilled water and maintained at 65°C under constant stirring for 2 hours. The supernatant was obtained and the precipitate was extracted for the second time with distilled water, followed by another centrifugation in the above-mentioned condition. By using rotary evaporator under reduced pressure at 60°C, the volume of polled supernatant was reduced to 100 mL and then, the concentrated solution was subjected to Sevag treatment to remove free proteins (19). Absolute ethanol was mixed with the supernatant to achieve a final ethanol concentration of 70% and the mixture was stored at 4°C overnight. The CP was gained after vacuum-filtering of the solution using a nylon membrane with the pore size of 0.45 µm (CHMLAB, Barcelona, Spain). The CP was washed with ethanol and acetone and dried in a laboratory hood at room temperature. The separation of CP into fractions of neutral and acid polysaccharides was performed by employing anion-exchange chromatography through a fast flow column of DEAE-Sepharose (GE Healthcare Bioscience AB, Uppsala, Sweden), which was equilibrated with distilled water. Distilled water and 0.5 to 1.5 M concentrations of NaCl were used to elute the unbound and bound polysaccharides. The two obtained fractions, F1 and F2, were first dialyzed against distilled water for three days and then underwent lyophilization process before future use.
3.3. Analysis of Extracted Polysaccharides for Bacterial Lipopolysaccharide (LPS)
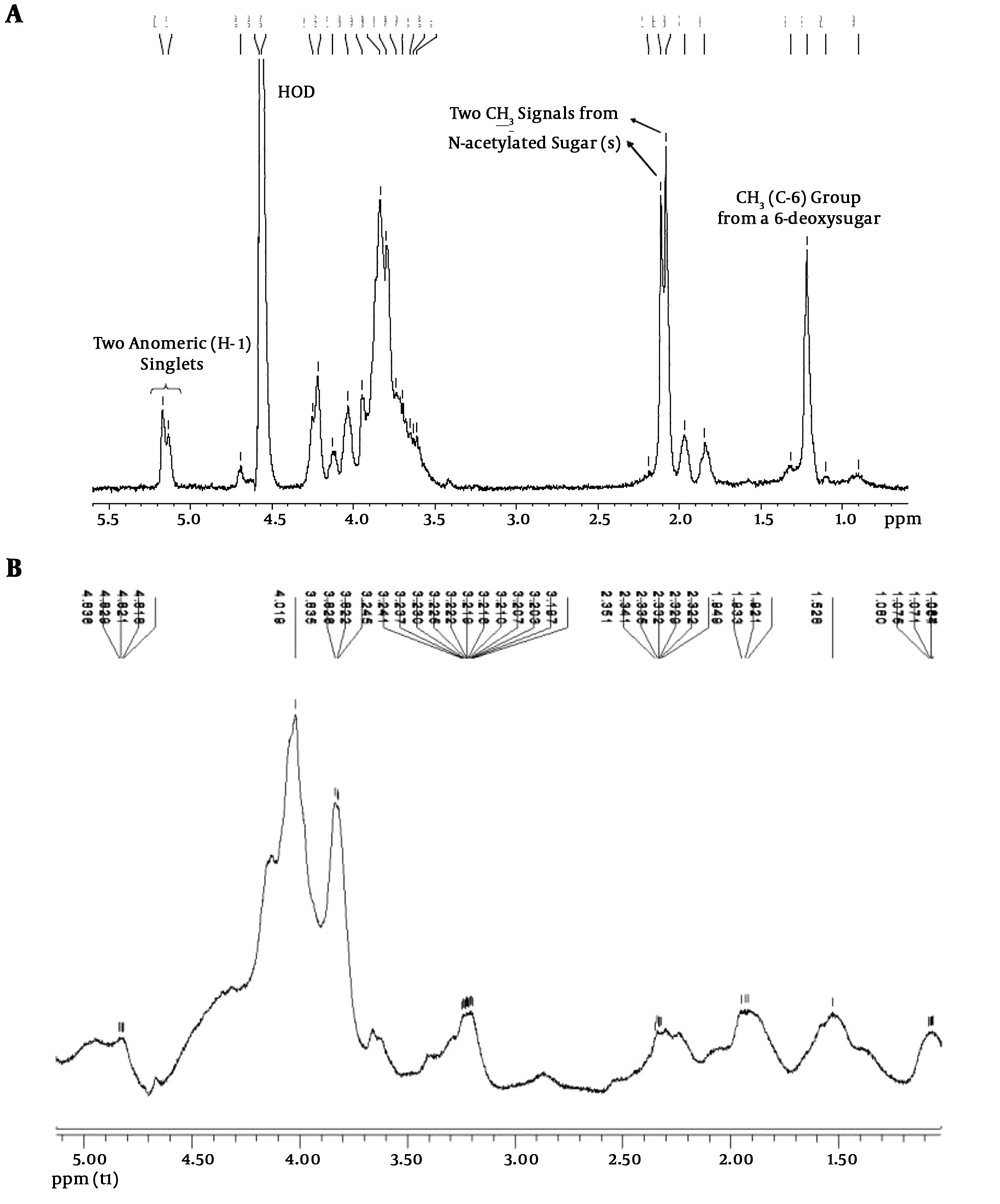
Extracted polysaccharides were analyzed for the presence of bacterial LPS using nuclear magnetic resonance (NMR) spectroscopy, as described previously by Ewart et al. (12). 1H-NMR spectrum was recorded at 50°C by a 500 MHz spectrometer.
3.4. PBMCs Isolation and Culture for Gene Expression Assay
A blood sample was collected from a 40-day-old healthy male broiler of Ross strain in heparin-containing tubes. The blood sample was diluted in an equal ratio with Phosphate-buffered saline (PBS). Venipuncture from the brachial vein was carried out according to the institutional guidelines for the care and use of animals in research. PBMCs were isolated according to the protocol of Ficoll density gradient method (Lymphodex, Inno-train, Germany). Briefly, 3 mL of diluted blood was loaded gently over the same volume of Ficoll in a 15 mL tube and centrifuged at 3200 rpm for 20 minutes. The PBMC ring was harvested from the interface layer and washed two times with PBS. Trypan blue staining was applied to check the viability of cells. Viable cells were counted using the Neubauer’s slide as a standard method. The isolated cells were kept in RPMI-1640 culture medium (Sigma- Aldrich, USA) containing 10% fetal bovine serum, 100 IU/ml penicillin, and 100 μg/mL streptomycin (20).
Then, 500 μL of a 5 × 10⁵ cell suspension was cultured in a 24-well plate with 200 to 1000 μg/mL culture medium concentrations of CP, F1, and F2 polysaccharides for 24 hours (12, 13). All treatments were performed in duplicates. At the end of the incubation time, the plate was centrifuged and the supernatants were removed. Next, 500 μL of RNA stabilizer solution (RNA later, Yekta Tajhiz, Tehran, Iran) was added to the wells and the plate was stored at -20ºC until future analysis.
3.5. Reverse Transcription-Polymerase Chain Reaction (RT- PCR)
A commercial RNA isolation kit (RNeasy mini kit, Qiagen) was used to extract the total RNA content. Cells in the stabilizer solution were centrifuged at 2000 rpm for 5 minutes and the resulting pellets were resuspended in 500 µL lysis buffer with beta-mercaptoethanol. Then, 500 µL of ethanol was added and thoroughly mixed. The final solution was transferred to a kit column and centrifuged at 6000 rpm for 15 seconds. Afterwards, two steps of washing were done and lastly, the eluted RNA was used as the template for cDNA synthesis. The extracted RNA was reversed transcribed using the Thermo Scientific kit according to the manufacturer’s instructions. Briefly, oligo dT primer (1 µL) was used to reverse transcribe 5 µL of RNA in the presence of dNTPs (2 µL), reverse transcriptase buffer (4 µL), reverse transcriptase at 20 units/µL concentration (0.5 µL), RiboLock RNase Inhibitor at 40 units/µL concentration (0.25 µL), and distilled water (7.25 µL) at 25ºC for 5 minutes, 42ºC for 60 minutes, and 70ºC for 5 minutes. The resulting cDNA was amplified by PCR according to the standard protocols using primers shown in Table 1 (21, 22). Briefly, cDNA (2 µL) was reacted with dNTPs (0.5 µL), reaction buffer (2 µL), forward and reverse primers (0.75 µL), magnesium chloride (1 µL), Taq polymerase at 5 units/µL concentration (0.25 µL), and SYTO 9 stain (1.6 µL) in a final reaction volume of 20 µL. The program of PCR was as follows: initial denaturation (95ºC for 3 minutes), 35 cycles of denaturation (95ºC for 10 seconds), annealing (55ºC for 10 seconds), and extension (72ºC for 10 seconds), followed by a final extension step at 72ºC for 5 minutes using rotor-gene 6000 real-time PCR cycler (Corbett Australia). The RT-PCR experiment contained duplicate test samples. Cycle of threshold (CT) values, the cycle at which the change in the fluorescence dye passed a significant threshold, were obtained using rotor-gene 6000 software version 1.7.27. The 2-ΔΔCT method was used to determine the relative quantification of gene expression. This method uses the CT information to calculate the relative level of gene expression in target and reference samples, using a reference gene as the normalizer. The housekeeping gene, β-actin, was used as the reference gene because its expression level did not change significantly under the effects of different treatments. Regarding ΔΔCT of the 2-ΔΔCT method, ΔCT associated with the difference in CT between the target and reference genes in the control group was subtracted from the counterpart values for the experimental groups (21).
3.6. Statistical Analysis
The data were analyzed by historical data design of response surface methodology (RSM) approach using Design Expert version 11 software (Stat-Ease, Minneapolis, USA) to optimize the effects of CP, F1, and F2 polysaccharides of CBP on IFN-γ and IL-2 expressions in PBMCs. Moreover, the analysis of variance (ANOVA) test was applied to check the analytical significance of the RSM results.
4. Results
4.1. Fractionation of Polysaccharides
In the present study, fractions F1 and F2 were obtained from the extracted CP using anion-exchange chromatography on a DEAE-Sepharose fast flow column. The non-absorbed polysaccharide, F1, was eluted by distilled water while the slightly charged fraction, F2, was eluted by 0.5 M NaCl.
4.2. Analysis for the Possible Presence of LPS
The analysis results of NMR spectroscopy are shown in Figure 1. The NMR spectra of LPS are characterized by three diagnostic regions, including an anomeric region containing two singlets (1H) at 5.17 and 5.14 ppm, assigned to H-1 of two sugar residues of the LPS O-polysaccharide moiety, two singlets at 2.09 and 2.12 ppm corresponding to two CH3 groups from two N-acetylated aminodeoxy sugar residues, and a doublet at 1.24 ppm corresponding to a CH3 group from a 6-deoxy sugar residue (Figure 1A). These signals were absent in the spectra of extracted polysaccharides suggesting that the samples were not contaminated with LPS during the extraction procedure (Figure 1B).
4.3. Data Analysis and Optimization Using the RSM Approach
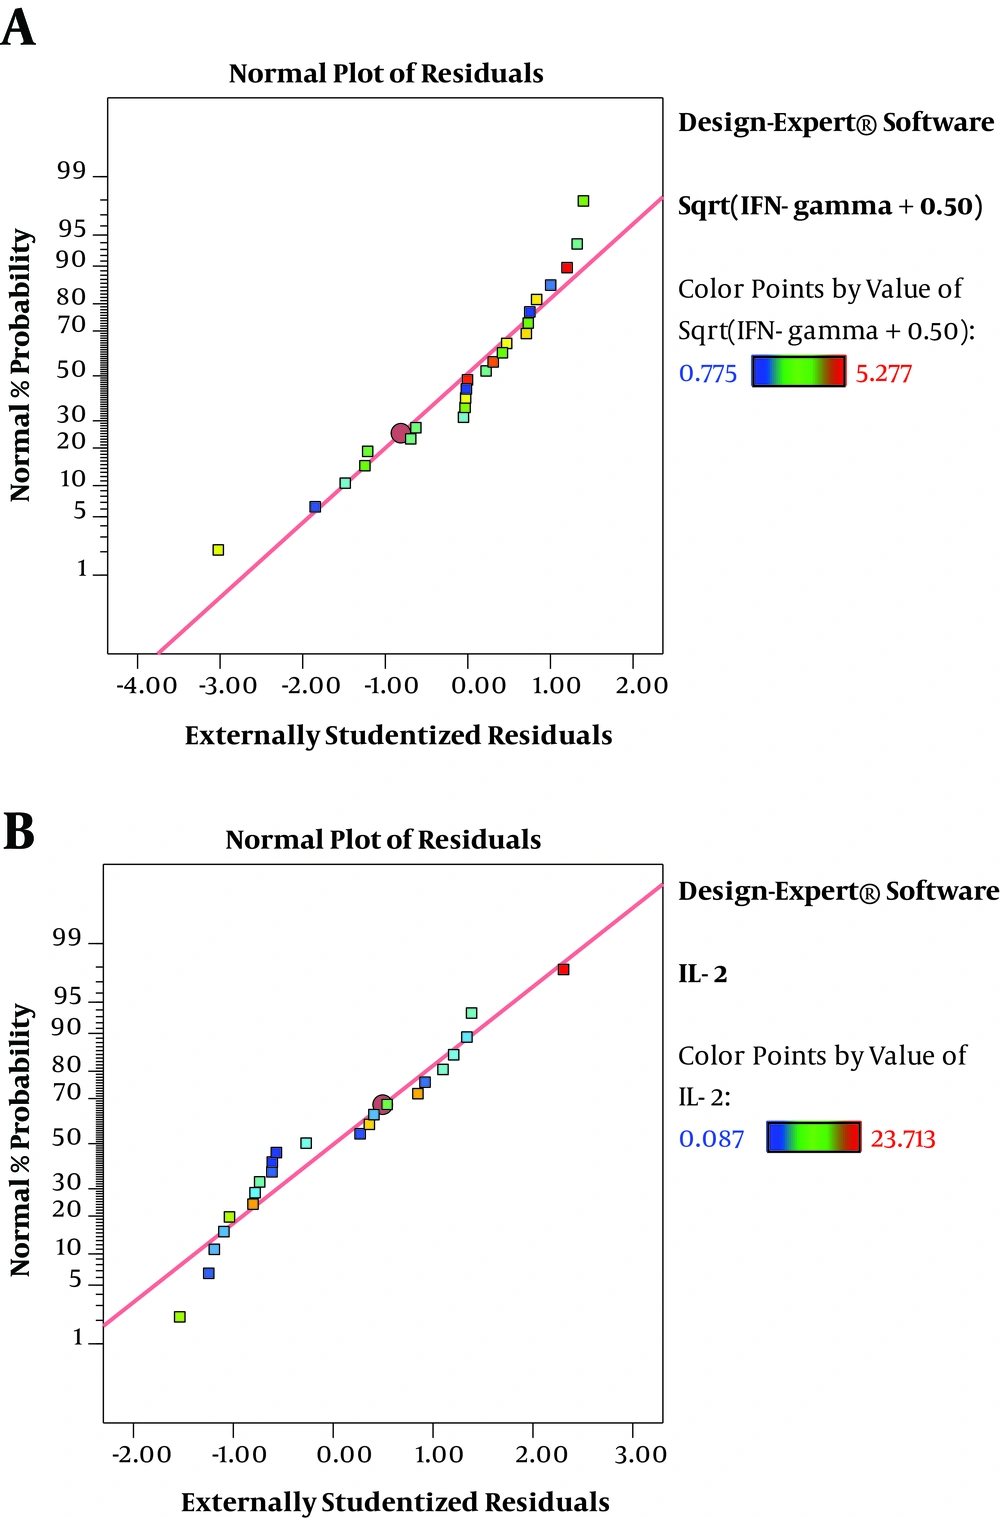
The residuals demonstrated a normal distribution for two responses where the point followed a straight line (Figure 2A and 2B). Regression model equations (Equations 1 written as the coded values of variables including concentration (A) and immunomodulator (B) are as follows:
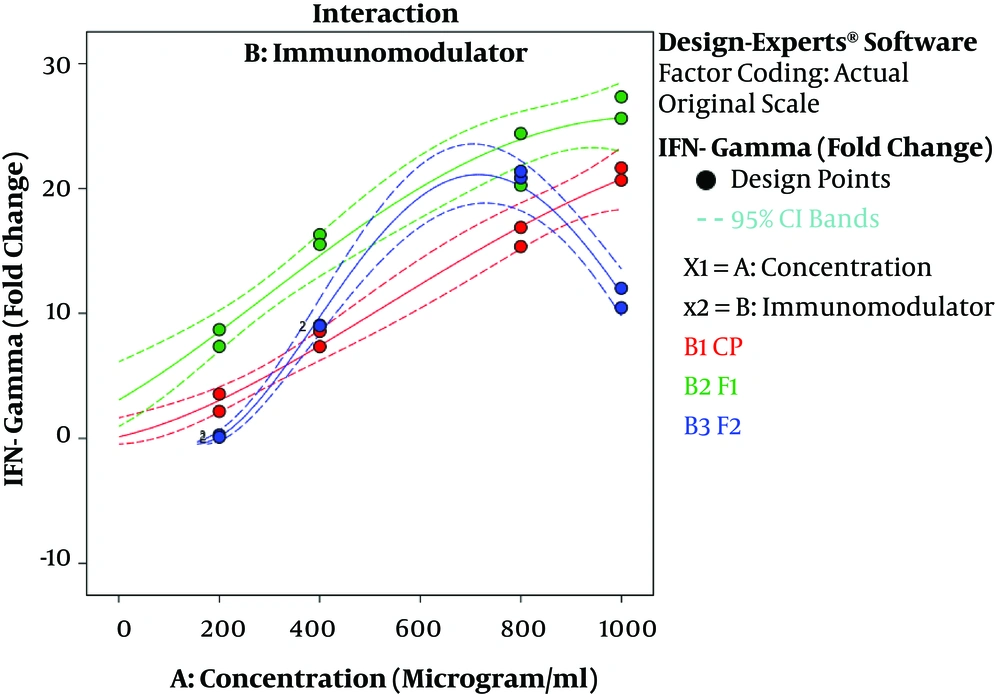
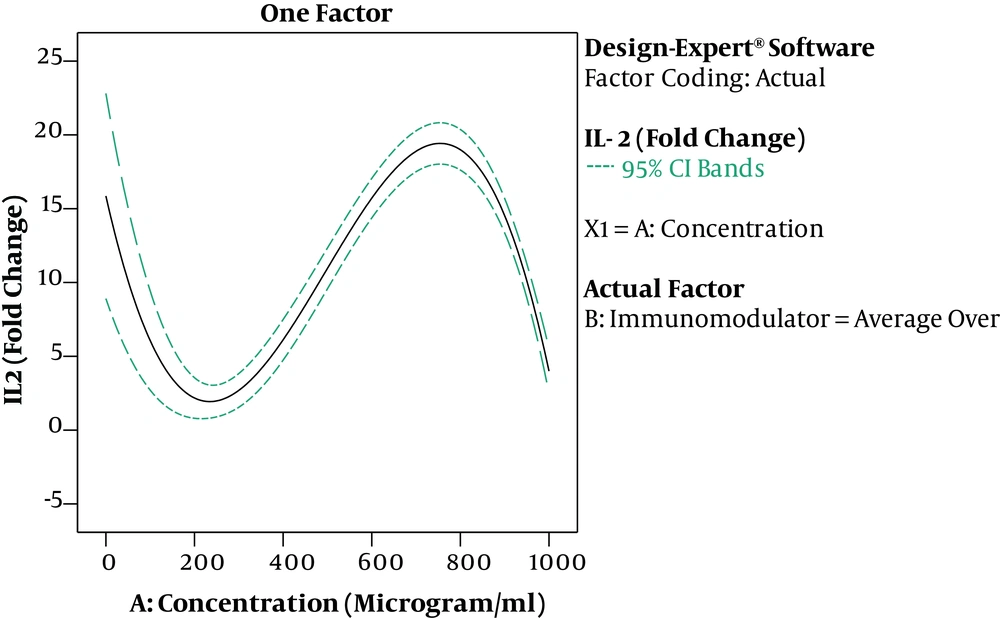
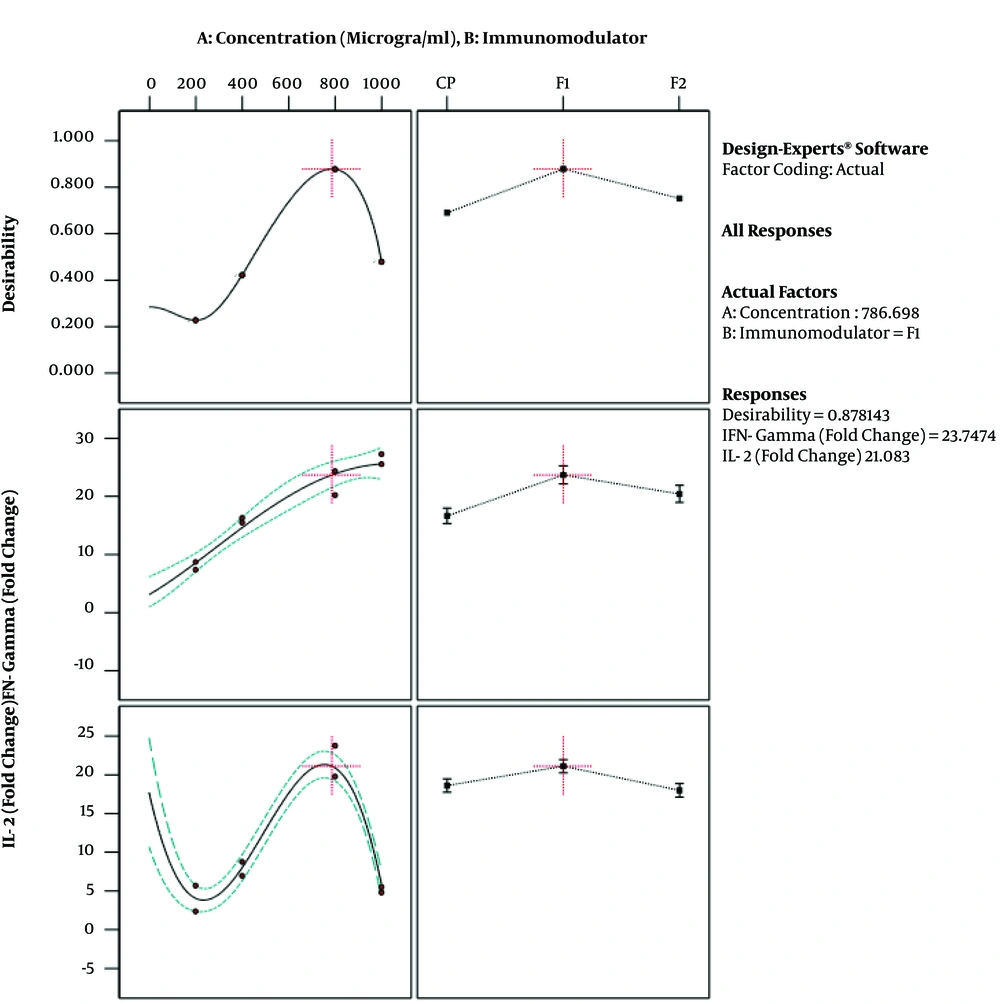
The results of ANOVA for the effects of immunomodulator polysaccharides and their concentrations on the expression of IFN-γ and IL-2 are shown in Table 2 and Table 3, respectively. The results of Fisher (F) test for the two responses were F = 129.67 and F = 83.4 and the ANOVA test (P < 0.0001) showed that the model was statistically significant. The regression model fitted the data and there was a good correlation between the experimental and predicted data based on the non-significant lack of fit (F = 3.33 and F = 2.8; P = 0.056 and P = 0.066 for the IFN-γ and IL-2 expression, respectively), the determination coefficient (R2 = 0.98 and R2 = 0.96 for the IFN-γ and IL-2 expression, respectively), and adjusted determination coefficient (Adj. R2= 0.97 and Adj. R2 = 0.94 for the IFN-γ and IL-2 expression, respectively). The predicted determination coefficients (Pred. R2 = 0.96 and Pred. R2 = 0.92 for IFN-γ and IL-2, respectively) were in reasonable agreement with the adjusted R2 values and confirmed that the models had good predictive ability. The adequate precision values, which indicated the signal to noise ratios, were above 4 (37.51 and 24.45 for IFN-γ and IL-2, respectively) and proved the established model could navigate the design space. The coefficient of variation (CV) was relatively low (5.34% and 19.84% for IFN-γ and IL-2 expression, respectively), which showed the reliability of the results. The ANOVA test also indicated that the effects of immunomodulators and their concentrations were statistically meaningful on both cytokines (P < 0.0001). In addition, the interaction effect was significant for IFN-γ expression (P = 0.03) (Figure 3). As shown in Figure 3, the mRNA expression of IFN-γ was enhanced with increasing the concentration of immunomodulators from 200 to 1000 μg/mL except for F2 in which, a decrease in response was observed approximately above the 700 μg/mL concentration. This result revealed that higher concentrations of F2 could negatively affect the expression of IFN-γ in chicken PBMCs. However, no interaction effect was observed for IL-2 expression. Indeed, the IL-2 expression in chicken PBMCs was enhanced by increasing the concentration of immunomodulatory polysaccharides from 200 μg/mL to 800 μg/mL regardless of immunomodulator type (Figure 4). Furthermore, the optimization results by RSM revealed that F1 at 786.68 μg/mL with the desirability of 0.87 could be selected to maximize the gene expression of IFN-γ and IL-2 by 23.74 and 21.08 folds, respectively, by chicken PBMCs (Figure 5).
| Source | Sum of Squares | df | Mean Square | F Value | P Value |
|---|---|---|---|---|---|
| Model (reduced cubic) | 36.92 | 8 | 4.62 | 129.67 | < 0.0001 |
| A- concentration | 23.70 | 1 | 23.70 | 665.93 | < 0.0001 |
| B- immunomodulator | 6.46 | 2 | 3.23 | 90.75 | < 0.0001 |
| AB | 0.3080 | 2 | 0.1540 | 4.33 | 0.0328 |
| A2 | 3.69 | 1 | 3.69 | 103.56 | < 0.0001 |
| A2B | 2.77 | 2 | 1.38 | 38.87 | < 0.0001 |
| Residual | 0.5339 | 15 | 0.0356 | - | - |
| Lack of fit | 0.2426 | 3 | 0.0809 | 3.33 | 0.0563 |
| Pure error | 0.2913 | 12 | 0.0243 | - | - |
| Cor. total | 37.46 | 23 | - | - | - |
| Source | Sum of Squares | df | Mean Square | F Value | P Value |
|---|---|---|---|---|---|
| Model (reduced cubic) | 1062.06 | 5 | 212.41 | 83.40 | < 0.0001 |
| A- concentration | 210.10 | 1 | 210.10 | 82.49 | < 0.0001 |
| B- immunomodulator | 41.57 | 2 | 20.79 | 8.16 | 0.0033 |
| A2 | 482.40 | 1 | 482.40 | 189.40 | < 0.0001 |
| A3 | 336.23 | 1 | 336.23 | 132.01 | < 0.0001 |
| Residual | 43.30 | 17 | 2.55 | - | - |
| Lack of fit | 26.16 | 6 | 4.36 | 2.80 | 0.0663 |
| Pure error | 17.14 | 11 | 1.56 | - | - |
| Cor. total | 1105.36 | 22 | - | - | - |
5. Discussion
Natural compounds with potential use as immunoenhancing agents for commercial chicken production could indirectly hinder the problems associated with antibiotic resistance by the augmentation of host immune system and decrease of antibiotic consumption for controlling microbial infections (24). Algal polysaccharides are of interest as natural compounds because of their vigorous antiviral, antitumor, and immunomodulatory activities. The two former bioactivities of polysaccharides showed to be mediated mostly by enhancing the immune system (25).
In the present study, fractions F1 and F2 isolated from CP of CBP were assessed in chicken immune cell’s responses along with CP. According to the results, the exposure of PBMCs to CBP polysaccharides could significantly increase the mRNA expression of two examined immunostimulatory cytokines, IFN-γ, and IL-2. In the current study, F1 generally exhibited higher immunoenhancing activities than CP and F2 at most tested concentrations by the stimulation of IFN-γ and IL-2 expression in PBMCs. These results are in agreement with those by Qi and Kim that indicated that the fractionation of CP from Chlorella ellipsoidea may yield polysaccharides with stronger immunomodulatory activity for the murine macrophage cell line (1). The immunostimulatory properties of Chlorella have been described in several studies under in vitro and in vivo conditions (11, 26). Chlorella appears to have immunostimulatory activities that stimulate a Th1-based response. A study reported a significant rise in IL-10, as a regulatory cytokine, and IFN-γ and TNF-α, as strong T helper (Th1) cell stimulatory cytokines, in human PBMCs in response to Chlorella extract (12). The water-soluble polysaccharides of Chlorella vulgaris induced the production of NO, PGE2 and pro-inflammatory cytokines in murine macrophage cells (2). Additionally, polysaccharides of Chlorella pyrenoidosa showed strong immunomodulatory activity by enhancing the expression and secretion of IL-1 in macrophages (9). Pugh et al. reported that polysaccharides extracted from Chlorella pyrenoidosa stimulated IL-1β and TNF-α gene expression by the activation of NF-κB pathways (11).
Based on the statistical approach in the current study, the regression model fitted the data well and a good correlation was observed between the experimental and predicted data according to the non-significant lack of fit and high determination coefficients and adjusted determination coefficients for IFN-γ and IL-2 expressions. The predicted determination coefficients for IFN-γ and IL-2 were in reasonable agreement with the adjusted determination coefficients that confirmed the models had good predictive ability. These verification values were in agreement with the predicted values with a deviation of less than 5%. Wu et al. reported that when the difference between experimental and predicted values is lower than 5%, the model is quite accurate (27). Accordingly, historical-data RSM is a promising statistical technique to reliably predict the optimum immunomodulator and its concentration to achieve the highest expression of IFN-γ and IL-2 in chicken PBMCs.
5.1. Conclusions
Our results showed that there were individual significant effects for the immunomodulator and its concentration for IFN-γ and IL-2 gene expression in chicken PBMCs. In addition, the interaction between the factors (immunomodulator and concentration) was significant for IFN-γ expression. The immunostimulatory effect was more prominent for F1 than for CP or F2 polysaccharides. It is also concluded that historical-data RSM is a valuable technique to optimize the factors to reach the maximum gene expression in chicken PBMCs. Further investigations about the molecular characteristics of crude and fractionated polysaccharides are now in progress to illustrate the interrelationship between the molecular structure and bioactivities.

