1. Background
Heavy metals are the most toxic inorganic pollutants in the environment (1). Some of these ions can be very toxic even at very low concentrations (2). Recently, the production of heavy metals such as Lead, copper and zinc, has increased exponentially (3). Among these, Lead is an important environmental health concern, because it is non-biodegradable, and is a toxic metal that is widespread in the world (4), with many industrial applications (3). It can accumulate in human muscles, bones, kidney, brain and cause damage to some human organs such as blood cells and nerve system (5, 6). Lead can enter the water system via several pathways, through mining, painting, corrosion of household plumbing, battery industrialized, petroleum industries and so on (2, 4). Many methods for treatment of Lead are available, including conventional ion exchange (7), chemical precipitation (8), membrane filter (9), adsorption (10, 11), and reverse osmosis (12). However, these methods have been found to be limited because some of them have poor efficiency and sensitive working conditions, with the secondary sludge requiring additional costly removal (3, 6). However, among these, adsorption is more efficient, economical and easier than other methods for Lead removal from the aqueous environment (4, 6). In the recent times, the use of nanoparticles for the removal of contaminants from the aqueous systems has brought about a significant progress of new methods in the removal of minerals from water (13). These nanoparticles have shown good potential to remove metals and other pollutants due to their physicochemical characteristics because their surface area to volume ratio increases as the particle size decreases. This ability is favorable to capture and react with other compounds (1, 13). Nanoscale Zero-Valent Iron (nZVI) is one of the materials with versatility and simple synthesis (13) that can remove metallic and metal contaminants, including Lead (14), Ni2+ (15), Ba2+ (16), Co2+, ClO4-, CrO42-, AsO43-, AsO33- etc. from water and wastewater (14, 17). Previous studies have focused on the use of nZVI for the removal of heavy metal ions from aqueous environments. They showed that this adsorbent was suitable for heavy metals removal from aqueous solutions. Li and Zhang (2006) showed that nZVI had a very high capacity for Ni2+, which was significantly higher than best inorganic sorbents and resins (15). Huang et al., (2013) also indicated that nZVI particles could remove Cd2+, Cr2+ and Lead from aqueous solutions (18).
2. Objectives
The objective of this study was using nZVI for Lead removal from aqueous solutions. The effects of pH changes, contact times, nZVI dosages, and Lead initial concentrations were also determined. The reaction kinetics was also investigated and the best isotherm model was selected.
3. Methods
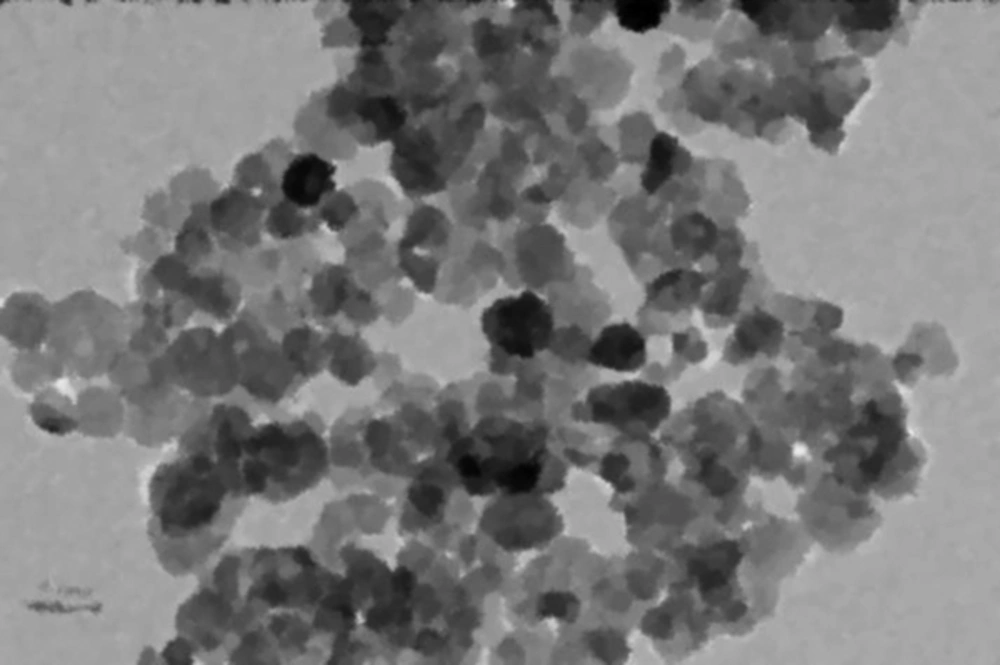
The chemical reagents used in this study included HCl (1N), NaOH (1N) and Pb(NO3)2, which were obtained from Merck Co., Germany. The nanoscale Zero-Valent Iron (nZVI) was purchased from the US-Research Nanomaterials. A Transmission Electron Microscopy (TEM) image of nZVI is presented in Figure 1. All the solutions were prepared using de-ionized water. All the chemicals in this study were of analytical grade.
3.1. Design of Experiments
To model and determine the optimum conditions for removal of Lead from aqueous solutions, the experimental conditions were designed using Design of Experiments (DOE) software for total analysis of 21 with seven analyses at each step (Design Expert 6 Stat-Ease, Inc.), and Lead initial concentration (mg/L), nZVI dosage (g/L), pH, and contact time (minutes) as the main variables. Table 1 shows the matrix of the experiments.
| Lead Initial Concentration (mg/L) | nZVI (g/L) | pH | Time (min) |
|---|---|---|---|
| 10 | 5 | 7 | 30 |
| 10 | 2 | 9 | 60 |
| 10 | 0.1 | 5 | 5 |
| 50 | 5 | 9 | 5 |
| 50 | 2 | 5 | 30 |
| 50 | 0.1 | 7 | 60 |
| 100 | 5 | 5 | 60 |
| 100 | 2 | 7 | 5 |
| 100 | 0.1 | 9 | 30 |
3.2. Adsorption Procedures
All sorption experiments were carried out in duplicates and were performed by a batch technique at room temperature. To compare the results in each series of tests, one blank sample was also considered. Briefly, a 1000-mg/L stock solution of Lead was prepared based on Pb(NO3)2. Then after, a series of dilute solutions in the range of 10, 50, and 100 mg/l were prepared.
The pH of the solution was adjusted to a range of 5, 7 and 9 using 0.1N (NaOH or HCl), and measured by a Metrohm pH meter model 525A. The samples were placed on a rotary shaker (Orbital Shaker Model OS625) at 250 RPM for 5, 30 and 60 minutes. Then the treated solutions were filtered and centrifuged at 6000 RPM for 15 minutes (Table 1). Finally, Lead concentration was determined by an ICP - AES (Inductivity coupled plasma) model 2 (Jobin Yvon Ultima) with an ICP V5.10 software (19).
The efficiency of Lead removal was studied based on different conditions using Equation 1:

Where, C0 and Ce are the Lead concentrations based on mg/L of the initial and treated samples, respectively.
3.3. Sorption Isotherms
Lead adsorption isotherm experiments using nZVI were implemented under a range of circumstances. Langmuir and Freundlich's isotherms model calculates the quantity of adsorption at equilibrium (20). The Langmuir isotherm model is represented by:

In addition, the Freundlich isotherm is expressed as:

Where, qe, is the weight of Lead adsorbed per unit weight of nZVI (mg/g), ce is the equilibrium concentration of Lead (mg/L), c0, is the Lead initial concentration (mg/L), b, is a constant related to the free energy of adsorption (1/mg), and a, is the maximum adsorption capacity (mg/g). The Freundlich constant (k) showed the relative adsorption capacity of the nZVI (mg/g), and n was the adsorption intensity. Freundlich isotherm model gives the best fit for the adsorption from aqueous solution; it has been stated that it is generally useful for moderate concentrations (20-22).
3.4. Sorption Kinetics Models
We studied the kinetic process considering models, which allowed the determination of the rate at which a given substrate was removed from a solution, providing information about the specific adsorption within the coordination of the reactive sites. The kinetic model equation: is presented here (20):

Where, R, is initial adsorption rate, K, is the constant of adsorption rate, C, is the initial concentration of Lead, and n is the degree of reaction.
4. Results
4.1. Removal of Lead from Aqueous Solutions
4.1.1. Effect of Initial Adjusted pH
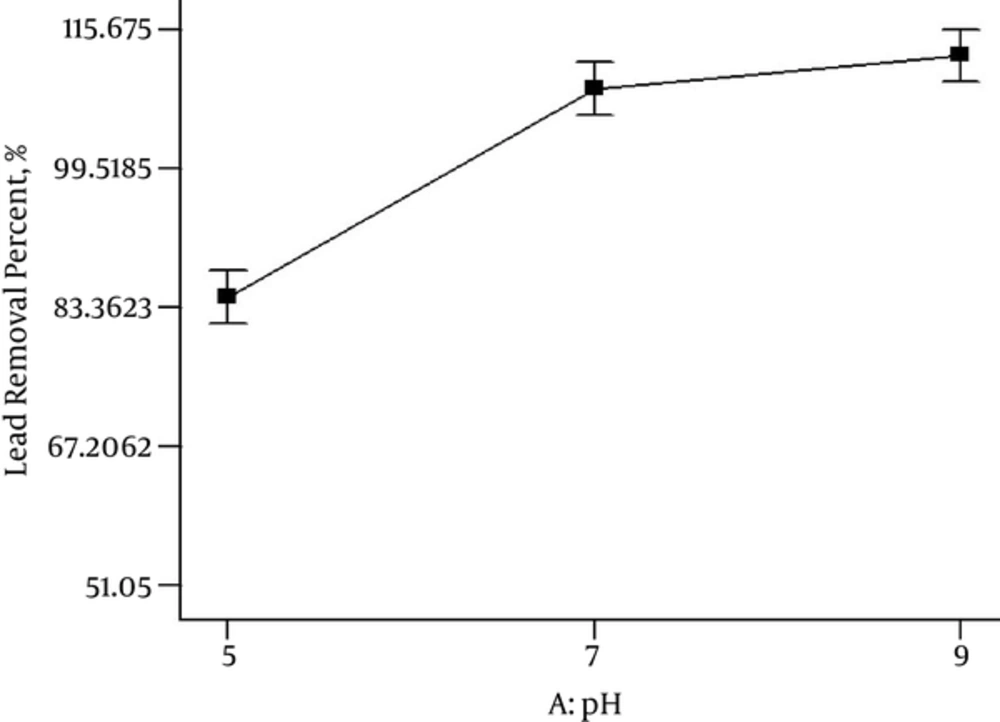
In this study based on Table 1, the effect of pH in the range of 5, 7 and 9, on the Lead removal by nZVI, was studied by considering other parameters, which were variable. Figure 2 illustrates that the removal percentage of Lead was increased from 83% to 100% when pH values were increased from 5 to 9. Based on this pH pH 9 was optimum.
4.1.2. Effect of Contact Time
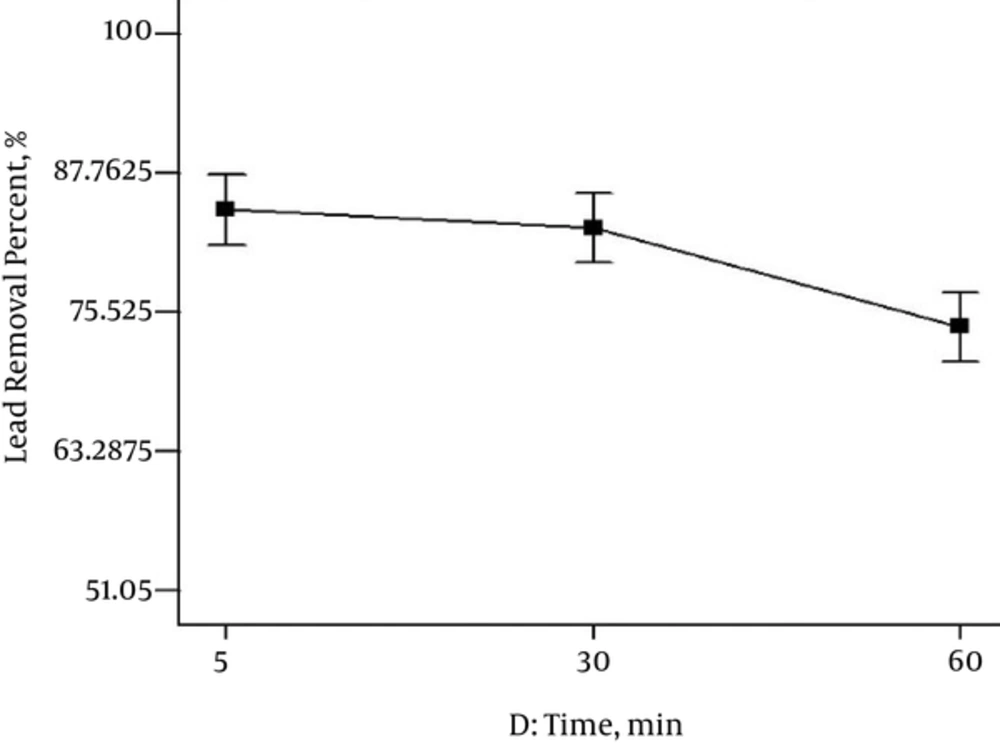
The effect of Lead removal by nZVI was studied at different contact times, 5, 30 and 60 minutes, with other parameters being variable based on Table 1. Figure 3 exhibits when contact time was five minutes, the lead removal was 87%. In addition, by increasing contact time, Lead removal efficiency was decreased. The results showed that the efficiency of Lead removal at five minutes was optimum.
4.1.3. Effect of Adsorbent Dosage
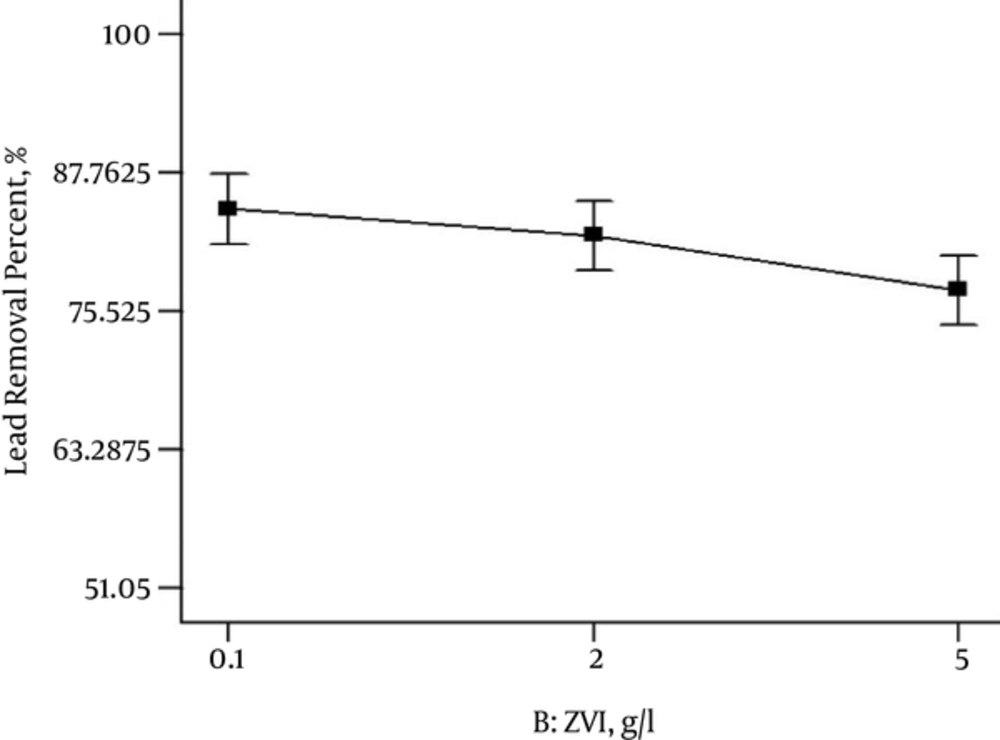
Adsorbent dosage is an important factor because it presents the adsorption capacity for achieving the initial amount of the adsorbate. The relation between Lead and nZVI is illustrated in Figure 4. The removal percentage of lead increased when the dosage of nZVI was decreased. As the adsorbent dosage increased from 0.1 to 5 g/L, the removal efficiency of Lead ion decreased from 87% to 75%, respectively. Thus, the selected optimum nZVI dosage was 0.1 g/L.
4.1.4. Effect of Initial Concentration
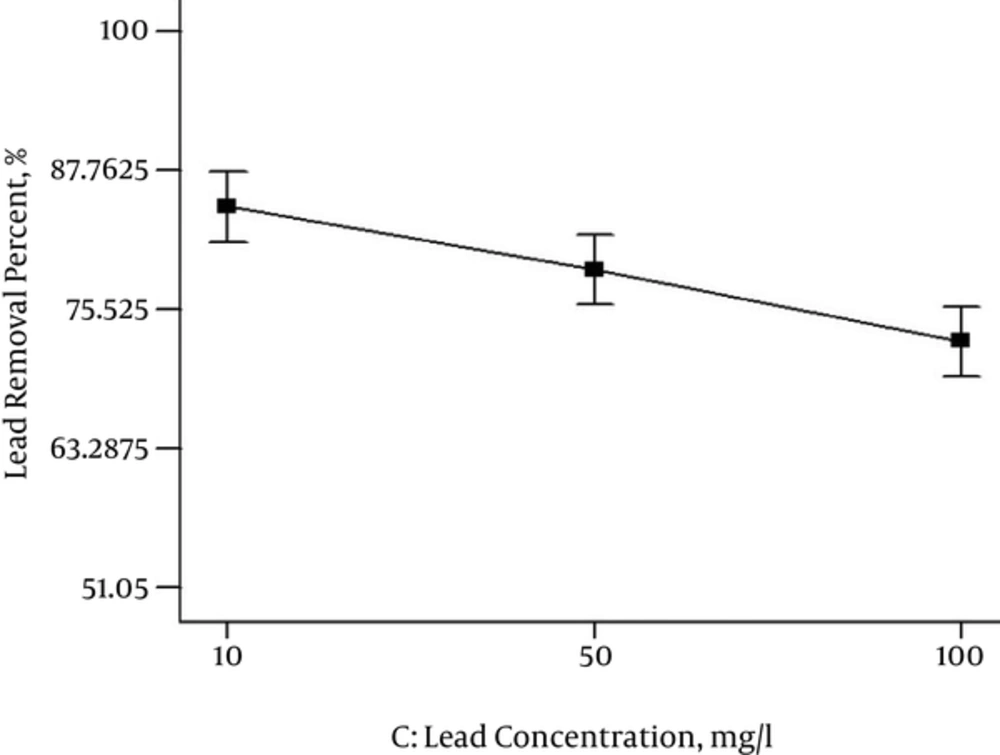
The result of the experiment with different initial Lead concentrations (in the range of 10, 50, and 100 mg/L) on nZVI removal efficiency is shown in Figure 5. When the initial Lead concentration increased in the presence of nZVI, the removal efficiency of the Lead decreased to 75%. Therefore, the best removal efficiency of Lead was at 10 mg/L of its initial concentration.
Finally, results showed that the initially adjusted pH is an important agent for Lead removal, because the F value, mean square, and the sum of squares had very high amounts (probe F < 0.05). The contribution percentage is exhibit pH and contact time has a significant effect on Lead removed from aqueous solutions (Table 2). Results show that pH is more effective than other factors on Lead removal.
| Term | The Sum of Squares | Mean Square | F Value | Prob F | Contribution (%) |
|---|---|---|---|---|---|
| pH | 2785.32 | 1392.66 | 189.70 | < 0.0001 | 73.34 |
| nZVI (g/L) | 158.79 | 79.40 | 10.82 | 0.0040 | 4.18 |
| Lead initial concentration (mg/L) | 419.44 | 209.72 | 28.57 | 0.0001 | 11.04 |
| Contact time (min) | 368.32 | 184.16 | 25.09 | 0.0002 | 9.70 |
| Lack of fit | 0.000 | - | - | - | 0.000 |
| Pure error | 66.07 | 7.34 | - | - | 1.74 |
| Residuals | 66.07 | 7.34 | - | - | - |
4.2. Adsorption Isotherms
Figure 6 shows initial concentration and other parameters for Langmuir and Freundlich isotherms. Based on Figure 6, the correlation coefficients give values higher than 94% for 10 and 100 mg/L concentrations of Lead for Freundlich isotherm. While the Langmuir isotherm had goodness-of-fit for 50 mg/L concentration of Lead (R2 = 0.72).
4.3. Adsorption Kinetics
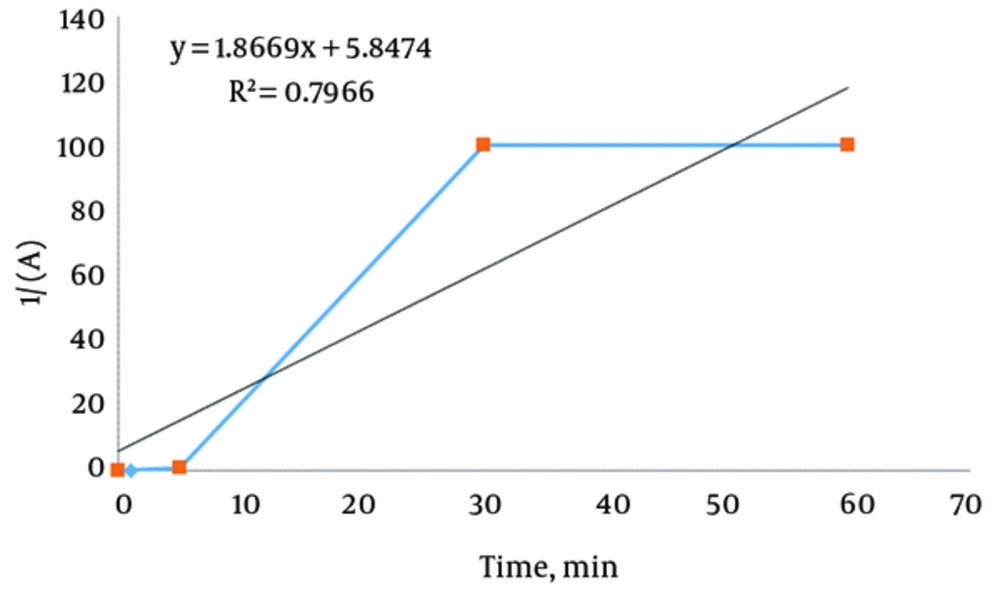
The adsorption kinetics of Lead ions at three concentrations of 10, 50, and 100 mg/L onto the nZVI surface were studied to determine the required time to achieve equilibrium adsorption. In addition, the zero, first, second and third order kinetic models were studied. Table 3 shows the adsorption kinetics calculation results. Based on Table 3, only in Lead ions, the initial concentration of 10 mg/L, the kinetic model for Lead removal confirmed of second order equations. Figure 7 shows a representative plot of the removal of Lead ions from 10 mg/L aqueous solution, as a function of contact time. There was no Lead ion removal for the first five minutes. Then after, Lead ion removal sharply increased with a contact time of up to 30 minutes, and then approached equilibrium conditions.
| Parameter | Lead Initial Concentration (mg/L) | ||
|---|---|---|---|
| 10 | 50 | 100 | |
| R2 | 0.79 | 0.27 | 0.05 |
| K | 1.9 | 0.4 | 0.37 |
| Kinetic model | R = K (C)2 | R = K (C)0 | R = K (C)0 |
5. Discussion
In this study, maximum Lead removal was observed at 10 mg/L initial concentration, with nZVI dosage of 0.1 g/L and contact time of five minutes at pH 9. The solution pH had an important effect on Lead removal due to Lead speciation, surface charge, and adsorbent functional groups (1). Based on the results of Figure 2 the removal percentage of Lead was increased from 83% up to 100% when pH values were increased from 5 to 9. Although, Lead ions dominated in acidic solution, competition with protons decreased their removal at lower pH (1). At lower pH, the concentration of H+ was higher, which caused a decrease in Lead removal efficiency due to vacant adsorbent site present between the H+ ion and Lead cations (3). Yalei Zhang et al., (2013) and Xin Zhang et al., (2010) reported that Lead was removed less efficiently at low pH with nZVI and Kaolin supported nanoscale Zero-Valent Iron (K-nZVI) from aqueous solutions (6, 19). However, Kim et al., (2013) and Wang et al., (2014), who investigated Lead removal efficiency with Zeolite and nanoscale Zero-Valent Iron (K-nZVI) and complex of low molecular weight organic acid and nZVI, showed that Lead removal was decreased with increasing pH, because they used a mix of organic acid and nZVI (1, 5). In the present study, pH 9 was selected as optimum for Lead removal. However, many studies reported that pH 5 was favorable for Lead removal when adsorption processes were done with nZVI in aqueous solution (3, 4). The study of Arancibia-Miranda (2014) showed that Lead removal was sharply increased by an increase in pH (13). The results of this study showed that the efficiency of Lead removal at five minutes was optimum. While, a similar study showed that removal percentage of Lead using K-nZVI and nZVI at the optimum 30 minutes contact time was 97% and 51.2%, respectively (19).
Adsorbent dosage is an important factor because it presents the adsorption capacity for obtaining the initial amount of the adsorbate. This study showed that when the adsorbent dosage increased from 0.1 to 5 g/L, the removal efficiency of Lead ion decreased. However, numerous studies indicated that Lead and Cr6+ removal increased significantly with increasing nZVI and K-nZVI dosages, when other parameters were constant (19, 23). In this study, other parameters were variable. It is a belief that at a low adsorbent dosage, the dispersion of adsorbent particles in aqueous solution is good because all active sites on the adsorbent surface are completely uncovered and they cannot accelerate the accessibility of Lead molecules to a large number of adsorbent active sites (3). Wang et al., (2014) reported that Lead removal efficiency increased with increasing nZVI concentration (≤ 0.1 g/L) and then increased or decreased marginally with further increase in nZVI concentration from 0.1 to 0.4 g/L (5). The results indicate that with increasing initial Lead concentration in the presence of nZVI, there was a decrease in the removal efficiency of the Lead. Therefore, the best removal efficiency of Lead was at 10 mg/L of its initial concentration. Some studies obtained results similar to the present study. They reported that efficiency of Lead removal was decreased with increasing initial Lead and Cr6+ concentrations with nZVI and K-nZVI dosages (19, 23). Though, the study of Chuang et al. (2015) revealed that 100 mg/l was the optimal concentration for Lead removed by C-nZVI (Coated nZVI) (24), in our study based on Figure 5, 10 mg/L was the optimum concentration for Lead. The study of Eglal et al. showed that removal of Lead, Cd2+ and Cu2+ with Nanofer ZVI confirmed Langmuir and Freundlich isotherms (25). Some studies also reported that the adsorption isotherms of Lead and As5+ with nZVI could be described using the Freundlich equation (4, 26). Bazrafshan et al., (2012) reported that the adsorption equilibriums of Phenol from aqueous solution using pistachio nut shell ash fitted Freundlich (R2 = 0.9436) better than Langmuir (R2 = 0.8395) model (27). Also, this study showed that the Freundlich isotherm was a good isotherm for Lead removal when the initial concentration was 10 mg/L. However, Arancibia-Miranda et al., (2014) suggested that the Langmuir isotherm model was the best for Lead (13). Bazrafshan et al., (2014) reported that the equilibrium assessment reveals that the Langmuir model is better than Freundlich model for removal of methyl orange and reactive red 198 dyes by Moringa peregrine ash (28). Mahvi et al., (2016) showed that the natural organic matter from aqueous environments removed by sodium dodecyl sulfate modified zeolite and the adsorption isotherm was well fitted to the Langmuir model (29). Many studies showed that increasing initial time caused an increase of Lead removal with G-nZVI and nZVI. Based on these studies, the second-order kinetic model was developed (4, 5, 13). Chuang et al. (2015) indicated that 100 mg/L of Lead concentration removal by C-nZVI (Coated nZVI) in aqueous solution obeyed the first-order reaction kinetics (24). In this study with the initial concentration of 10 mg/L, the kinetic model for Lead removal confirmed the second order equations. This study and other studies showed that nZVI was suitable for removal of low Lead initial concentration when contact time increased.
5.1. Conclusions
This research studied the use of nZVI for Lead ion removal from aqueous solution at variable pH, contact time, Lead ions initial concentration and adsorbent dosage. The contribution percentage, pH and contact time exhibited a significant effect on Lead ions removed from the aqueous solution. Results showed that pH was more effective than other factors in Lead ion removal. Based on the results, the Freundlich isotherm was the goodness-of-fit model for this process. The second order kinetic model was best for low concentrations of Lead ion removal from aqueous solution.
