


1. Background
The scientific name of rice is Oryza sativa. It is one of the important staple human foods. It is cultivated in many countries and is a major source of proteins, carbohydrates, and other essential nutrients (1). It provides more than 20% of the calories consumed worldwide. After post-harvest processing, rice can be categorized as either white or brown with different characteristics (2). White rice is defined by the removal of the bran. Some nutrients are lost, including fats, proteins, phosphorous, calcium, B vitamins, and phytochemicals but with starch endosperm intact (3). Through much research, it has been determined that brown rice has many health benefits compared to white rice. Brown rice contains high amounts of proteins, vitamins, fats, minerals, and bioactive compounds (4). It has low calories and a high amount of fiber (5). They are consumed by more than half of the world's population. Due to the polishing process, white rice is high in amylose and poor in fiber and minerals. In 2021, a study investigated whether brown rice processed by soft textured cultivars has increased health benefits and improved texture. White and brown rice were compared regarding the improvement in digestion and texture. Results showed cooked brown rice had 41% more active digestion duration and a 31% lower glucose production than white rice. Brown rice shows higher amylose content and a thin bran layer produced by suitable cultivars. They meet the consumer requirement of both improved health benefits and acceptable texture (6). A study was conducted by Wu et al. to assess the digestive ability of brown and white rice with similar amylose content. The study was performed on rats with the static soaking method. Rats were divided into two groups and given an equal amount of rice food. It was observed that brown rice has higher resistance and a low gastric emptying rate of 53%, compared to white rice with 32%. Brown rice also showed lower glycemic potency and higher gastric digestive viscosity, leading to lower mixing and mass transferring (7). In 2015, a study demonstrated the beneficial effect of rice bran protein. Rats were fed a high-fat and high-carbohydrate diet. After 12 weeks, rats were divided into 4 groups and were orally given rice bran protein 100 to 500 mg/kg and pioglitazone 10 mg/kg for 6 weeks. Metabolic syndrome rats had elevated blood glucose, insulin, and lipid levels. Treatment with rice bran protein significantly alleviated all those changes and restored insulin sensitivity. So, it was concluded that rice bran protein improves insulin resistance and prevents metabolic syndrome if used as a functional food (8). Another study in 2020 on normal rats investigated the effect of multiple whole grains and refined grains on blood lipid profile, blood glucose level, and inflammatory markers. Forty-eight male rats were divided into four groups according to their initial body weight. For 18 weeks, these rats were fed whole grain, refined grain wheat, and refined grain rice, including 45% of the feed. Weakly body weight changes and food intake were demonstrated. After 18 weeks of the experiment, epithelial steatosis was observed in the kidneys of rats of the refined rice and wheat group. Fatty liver was also present in different degrees. Biochemical assessment of the refined grain wheat group showed increased levels of blood glucose, urea nitrogen, triglycerides, cholesterol, and low-density lipoprotein compared to the whole grain group. In the refined wheat group, high-density lipoprotein levels were lower than the whole grain wheat group. It was concluded that long-term use of refined grains shows abnormalities in lipid profile, fasting blood glucose, and changes in renal pathology (9). A study by Denardin et al. in 2012 on rats investigated the effect of different amylose contents in rice on lipid and glycemic performance. Twenty-five male Wister rats were included. Two grams of cooked rice grains with 3 different amylose concentrations were fed a normal diet: Low, intermediate, and high amylose content. Amylose content did not affect high-density lipoprotein or cholesterol and defecation. The rats treated with rice of high amylose concentration showed increased body weight and less feed intake. They also showed reduced fecal pH value and increased fecal nitrogen excretion and water concentration. Blood glucose levels, triglycerides, and cholesterol levels decreased. They showed decreases in pancreas weight and increases in liver weight. Therefore, amylose concentration affected starch digestibility, thus affecting biological parameters (10). Rice is a basic food for about half of the world's population besides wheat. It provides 20% of the calories consumed worldwide. Excess rice consumption alters inflammatory biomarkers that may lead to many metabolic disorders. It is assumed that rice is difficult to digest, and people with diabetes should avoid rice intake.
2. Objectives
This study aimed to determine the effect of rice consumption on hepatocellular insufficiency, blood glucose level, and lipid profile in a normal rat model. It can increase awareness to modify the existing dietary practices to reduce disease burden among populations.
3. Methods
An experimental study design opted to investigate the comparative effect of amylose concentration in brown and white rice on hepatocellular insufficiency in healthy rat models. The study was approved (IRB/UOL/1035/2021) by the Institutional Review Board of the University of Lahore. Due to the unavailability of relevant statistics to calculate the sample, the sample size was adopted from Denardin et al. (10). For rat bioassay, 25 white albino rats (6 - 8 weeks old weighing 100 - 120 g) were purchased from the animal house of the Institute of Molecular Biology and Biotechnology lab, The University of Lahore. The adaptation period was 5 days with controlled conditions: Temperature (21 ± 2°C), relative humidity (55 ± 5%), and a 12-hour light-dark cycle. These conditions were followed throughout the trial. After the adaptation period (Appendix 1 in the Supplementary File), in group 1, five rats were randomly selected to be fed a normal diet (G0). Five rats in the second group were fed white rice flour (G1), 5 rats in the third group were fed cooked white rice (G2), 5 rats in the fourth group were fed brown rice flour (G3), and 5 rats in the fifth group were fed cooked brown rice (G4) for 28 days. Free access to food and water was given. For animal euthanasia and blood collection, rats were anesthetized with ketamine at a dose of 0.15 mL/150 g IP (11). Blood sample was collected by cardiac puncture at 0 day and 28th day at the end of the treatment. Powdered rice was prepared by drying the rice grains at 45ºC for 3 hours to make fine flour using an electric grinder and stored at 20ºC until further analysis (12). Rice was cooked traditionally with a ratio of 1: 1.2 (w/w) for white rice and 1: 1.6 (w/w) for brown rice for around 35 and 45 min. The cooked rice was kept warm for 5 minutes and then cooled to about 50ºC in a hot air oven (10). Parameters, such as blood glucose level, lipid profile, liver functioning test, liver histopathology, and pancreas histopathology, were evaluated after treatment (Appendices 2 and 3 in the Supplementary File). Collected data were analyzed using the software IBM SPSS 21. The data are reported using descriptive and inferential statistics and presented as mean and standard deviation. Paired and independent sample t-tests were applied. P value < 0.05 was considered significant.
4. Results
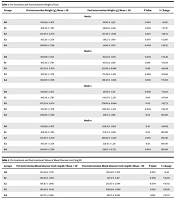
In the current study, significant weight change was observed in all the groups by the end of the fourth week of treatment with 5 g/day rice. Significant weight gain was observed in the first week in rats of groups 1 and 2, which were fed white rice. A significant weight gain was observed from 106.50 ± 1.761 g to 146.83 ± 1.941 g (P < 0.001) in group 1 fed white rice flour and 107.50 ± 2.074 g to 157.50 ± 1.049 g (P < 0.001) in group 2 fed cooked white rice. In group 3, rats were fed brown rice flour, and significant weight gain from 105.50 ± 1.378 g to 130.17 ± 1.169 g (P < 0.001) was observed. In group 4, rats were fed cooked brown rice, and weight gain from 108.00 ± 1.789 g to 141.83 ± 1.472 g (P < 0.001) was seen. So, the study's overall results showed that compared to white rice intake, the rats on brown rice feed showed less weight gain and more significant results (Table 1).
| Groups | Pre-intervention Weight (g) | Post-intervention Weight (g) | P-Value | % Change |
|---|---|---|---|---|
| Week 1 | ||||
| G0 | 105.69 ± 1.672 | 118.67 ± 1.352 | 0.001 | +12.38 |
| G1 | 106.50 ± 1.761 | 146.83 ± 1.941 | 0.001 | +37.78 |
| G2 | 107.50 ± 2.074 | 157.50 ± 1.049 | 0.023 | +46.51 |
| G3 | 105.50 ± 1.378 | 130.17 ± 1.169 | 0.007 | +23.80 |
| G4 | 108.00 ± 1.789 | 141.83 ± 1.472 | 0.004 | +30.55 |
| Week 2 | ||||
| G0 | 105.69 ± 1.672 | 162.53 ± 1.973 | 0.003 | +54.28 |
| G1 | 106.50 ± 1.761 | 197.83 ± 1.169 | 0.014 | +85.84 |
| G2 | 107.50 ± 2.074 | 213.00 ± 0.894 | 0.011 | +99.06 |
| G3 | 105.50 ± 1.378 | 172.00 ± 1.414 | 0.008 | +63.80 |
| G4 | 108.00 ± 1.789 | 189.50 ± 1.049 | 0.001 | +75.00 |
| Week 3 | ||||
| G0 | 105.69 ± 1.672 | 181.65 ± 1.371 | 0.006 | +72.38 |
| G1 | 106.50 ± 1.761 | 243.67 ± 2.251 | 0.04 | +87.94 |
| G2 | 107.50 ± 2.074 | 276.00 ± 0.894 | 0.05 | +93.73 |
| G3 | 105.50 ± 1.378 | 200.83 ± 1.472 | 0.049 | +90.47 |
| G4 | 108.00 ± 1.789 | 216.17 ± 1.169 | 0.03 | 100.00 |
| Week 4 | ||||
| G0 | 105.69 ± 1.672 | 208.21 ± 1.092 | 0.01 | +98.09 |
| G1 | 106.50 ± 1.761 | 274.33 ± 1.366 | 0.05 | 100.00 |
| G2 | 107.50 ± 2.074 | 298.50 ± 1.049 | 0.001 | 100.00 |
| G3 | 105.50 ± 1.378 | 228.67 ± 1.211 | 0.01 | 100.00 |
| G4 | 108.00 ± 1.789 | 239.17 ± 0.753 | 0.024 | 100.00 |
Pre-treatment and Post-treatment Weight of Rats a
A significant change was also observed in blood glucose levels of all 5 groups. Pre-intervention blood glucose in group 0, which was on a normal diet, was 165.02 ± 1.732 mg/dL; post-intervention, it was 200.02 ± 1.702 mg/dL. Pre-intervention blood glucose level in G1 fed white rice flour was 163.00 ± 1.265 mg/dL; post-intervention, it was 237.17 ± 2.317 mg/dL. Group 2 fed cooked white rice showed a greater increase in blood glucose level after intervention (263.67 ± 2.944 mg/dL). Group 3, fed brown rice flour, showed pre-intervention blood glucose of 164.50 ± 1.643 mg/dL; post-intervention, it was 208.50 ± 1.049 mg/dL. Group 4, fed cooked brown rice, showed a pre-intervention value of 167.33 ± 1.966 mg/dL and a post-intervention value of 218.33 ± .816 mg/dL. So, it can be concluded that the intake of brown rice showed less increase in blood glucose levels (near to rats on normal feed) than white rice intake (Table 2).
| Groups | Pre-intervention Blood Glucose Level (mg/dL) | Post-intervention Blood Glucose Level (mg/dL) | P-Value | % Change |
|---|---|---|---|---|
| G0 | 165.02 ± 1.732 | 169.02 ± 1.702 | 0.001 | +2.42 |
| G1 | 163.00 ± 1.265 | 237.17 ± 2.317 | 0.005 | +45.39 |
| G2 | 166.67 ± 1.966 | 263.67 ± 2.944 | 0.004 | +58.43 |
| G3 | 164.50 ± 1.643 | 208.50 ± 1.049 | 0.001 | +26.28 |
| G4 | 167.33 ± 1.966 | 218.33 ± 4.816 | 0.012 | +30.53 |
Pre-treatment and Post-treatment Values of Blood Glucose Level (mg/dL) a
In the current study, rats fed white rice showed a greater increase in low-density lipoprotein and a lower increase in high-density lipoprotein. However, rats fed brown rice showed a significant increase in high-density lipoprotein compared to low-density lipoprotein. Group 0, which was on normal feed, showed an increase from 13.09 ± 3.781 mg/dL to 20.23 ± 5.09 mg/dL. In group 1, fed white rice flour, HDL level increased from 13.33 ± 3.777 mg/dL to 17.67 ± 3.816 mg/dL, and in G2, fed cooked white rice, it increased from 12.83 ± 2.169 mg/dL to 18.50 ± 3.548 mg/dL compared to the control group. However, LDL was increased in G1 and G2 compared to the control group and the groups fed brown rice. Also, LDL in G0 was 14.32 ± 2.09 mg/dL in pre-intervention and 15.32 ± 2.671 mg/dL post-intervention. In G1, LDL increased from 12.50 ± 3.548 mg/dL to 21.17 ± 3.753 mg/dL, and in G2, it increased from 14.53 ± 2.626 mg/dL to 25.83 ± 3.803 mg/dL (Table 3).
| Group | Pre-intervention Total Lipids (mg/dL) | Post-intervention Total Lipids (mg/dL) | P-Value | % Change |
|---|---|---|---|---|
| Total Lipids (mg/dL) | ||||
| G0 | 279.07 ± 2.090 | 289.67 ± 1.094 | 0.031 | +3.5 |
| G1 | 290.67 ± 0.816 | 347.67 ± 1.506 | 0.065 | +19.65 |
| G2 | 292.00 ± 1.265 | 358.17 ± 0.753 | 0.070 | +22.64 |
| G3 | 289.50 ± 1.378 | 324.17 ± 1.169 | 0.053 | +12.11 |
| G4 | 291.67 ± 3.816 | 334.17 ± .753 | 0.032 | +14.77 |
| Cholesterol (mg/dL) | ||||
| G0 | 44.01 ± 5.091 | 49.90 ± 6.091 | 0.02 | +11.3 |
| G1 | 50.12 ± 6.632 | 74.67 ± 6.816 | 0.21 | +48.00 |
| G2 | 48.59 ± 5.894 | 86.17 ± 8.472 | 0.007 | +79.16 |
| G3 | 52.50 ± 5.049 | 68.83 ± 7.753 | 0.26 | +30.76 |
| G4 | 51.58 ± 4.049 | 71.50 ± 6.049 | 0.029 | +39.21 |
| Triglycerides (mg/dL) | ||||
| G0 | 39.13 ± 1.892 | 43.23 ± 1.908 | 0.004 | +10.82 |
| G1 | 42.17 ± 0.753 | 63.33 ± 1.211 | 0.001 | +50.00 |
| G2 | 44.50 ± 1.049 | 68.33 ± 0.816 | 0.044 | +55.29 |
| G3 | 45.00 ± 1.414 | 51.17 ± 1.169 | 0.015 | +13.33 |
| G4 | 46.50 ± 1.049 | 53.33 ± 1.211 | 0.020 | +15.21 |
| HDL (mg/dL) | ||||
| G0 | 13.09 ± 3.781 | 19.23 ± 5.09 | 0.002 | +46.15 |
| G1 | 13.33 ± 3.777 | 17.67 ± 3.816 | 0.004 | +30.76 |
| G2 | 12.83 ± 2.169 | 18.50 ± 3.548 | 0.001 | +50.00 |
| G3 | 11.67 ± 3.516 | 24.83 ± 2.753 | 0.03 | +98.83 |
| G4 | 14.17 ± 3.753 | 26.00 ± 2.894 | 0.002 | +85.71 |
| LDL (mg/dL) | ||||
| G0 | 14.32 ± 2.09 | 15.32 ± 2.671 | 0.019 | +7.14 |
| G1 | 12.50 ± 3.548 | 21.17 ± 3.753 | 0.003 | +75.00 |
| G2 | 14.53 ± 2.626 | 25.83 ± 3.803 | 0.015 | +78.57 |
| G3 | 13.33 ± 3.816 | 16.67 ± 2.816 | 0.001 | +23.07 |
| G4 | 13.67 ± 2.516 | 19.50 ± 2.049 | 0.0015 | +46.15 |
Pre-treatment and Post-treatment Values of Lipid Profile (mg/dL) a
The synthesis of bile acids will produce excessive free radicals, leading to oxidative stress. The oxidative stress causes lipid peroxidation of hepatic cell membranes, increasing SGOT and SGPT activities in the blood and changing the liver's histology. To overcome this, fibers present in brown rice and their antioxidant activity are quite beneficial. This was supported by the current study in which the results show a lesser increase in SGOT values among rats who consumed brown rice than those who consumed white rice. Group 0 on normal feed showed an increase from 272.87 ± 6.531 U/L to 285.09 ± 4.091 U/L. Group 1 fed white rice flour showed an increase from 273.33 ± 5.516 U/L to 321.00 ± 4.095 U/L, whereas G2 fed cooked white rice showed an increase from 275.23 ± 6.516 U/L to 338.50 ± 3.049 U/L. In comparison with brown rice, G3 fed brown rice flour showed increases from 272.50 ± 7.548 U/L to 288.83 ± 6.983 U/L, and G4 fed cooked brown rice showed increases from 274.67 ± 7.516 U/L to 298.33 ± 4.366 U/L. These changes were significant (P < 0.05), as shown in Table 4.
| Groups | Pre-intervention | Post-intervention | P-Value | % Change |
|---|---|---|---|---|
| SGPT (ALT) Level (U/L) | ||||
| G0 | 40.19 ± 3.561 | 42.89 ± 5.091 | 0.001 | +5.00 |
| G1 | 40.33 ± 4.516 | 52.33 ± 3.516 | 0.004 | +30.00 |
| G2 | 41.33 ± 2.516 | 55.67 ± 4.412 | 0.042 | +34.14 |
| G3 | 39.50 ± 4.548 | 44.33 ± 5.523 | 0.031 | +12.82 |
| G4 | 42.33 ± 3.516 | 46.67 ± 5.516 | 0.001 | +9.52 |
| SGOT (AST) Level (U/L) | ||||
| G0 | 272.87 ± 6.531 | 277.09 ± 4.091 | 0.021 | +1.83 |
| G1 | 273.33 ± 5.516 | 321.00 ± 4.095 | 0.031 | +17.58 |
| G2 | 275.23 ± 6.516 | 338.50 ± 3.049 | 0.014 | +22.90 |
| G3 | 272.50 ± 7.548 | 288.83 ± 6.983 | 0.032 | +5.88 |
| G4 | 274.67 ± 7.516 | 298.33 ± 4.366 | 0.014 | +8.75 |
Pre-treatment and Post-treatment Values of Liver Functioning Tests a
5. Discussion
Most research on humans and rats showed significant changes due to white and brown rice consumption. Due to the loss of many nutrients while processing, white rice is said to cause many health problems compared to brown rice in the long term and overuse age. Many studies have reported that the consumption of white rice increases weight and leads to many metabolic disorders compared to brown rice. An experimental study was conducted by Hanum Osman et al. (13) to assess whether white polished rice affects weight changes. It showed significant weight gain after feeding for eight weeks (13). A randomized controlled trial was conducted by Linh et al. (14) in 2019 on healthy overweight females to investigate whether white and brown rice intake affects body weight. After 16 weeks of intervention, body weight, and other parameters were assessed. This study showed a decrease in weight from 63.3 ± 6.5 kg to 61.2 ± 6.5 kg (P < 0.001) in females consuming brown rice, while the body weight of females consuming white rice was unchanged (14). Shallan et al. (15) conducted a study investigating the effect of cooked brown and white rice on blood glucose levels. They observed decreases in serum blood glucose levels with the loss in body weight in rats fed cooked brown rice compared to those given white rice (15). Another study in 2022 investigated the effect of a white rice-based carbohydrate diet and a brown rice-based carbohydrate diet on fasting plasma glucose, insulin, and triglyceride levels. Rats fed white rice-based carbohydrates had higher fasting blood glucose and triglycerides (12.8 ± 1.6 and 16.9 ± 2.4, respectively). They also showed higher fasting insulin levels, thus increasing the incidence of diabetes (13). A study conducted by Dong et al. (16) supports our study results in examining the effect of white rice on lipid profile. The prevalence of high low-density lipoprotein and low high-density lipoprotein was observed. It also showed that the highest rice consumption was associated with high triglycerides (16). These results are also supported by the study by Sarkar et al., in which they investigated the effect of brown rice on lipid profile. After 12 weeks of investigation, they found low levels of plasma LDL cholesterol and triglycerides and high levels of plasma HDL cholesterol. Due to high amounts of polyphenols, lycopene, polyphenols, and β-carotene, brown rice exhibits stronger 2-diphenyl-1-picrylhydrazyl DPPH-free radical scavenging ability and antihemolytic potential. The hepatic levels of lipid peroxidase and proinflammatory TNFα also decreased (P < 0.05) to a greater extent with brown rice (17). These results are also supported by a study conducted by Roohinejad et al. (18) in which the consumption of brown rice showed significant results (P < 0.05) in lowering blood cholesterol levels and treating hypercholesterolemia. It also showed significant results on lipid profile, showing a cardio-protective effect (18). A 2019 study also supports the effect of brown rice on reducing SGOT levels. After 21 days of the experiment, they concluded that brown rice with a dose of 57%/rat/day significantly (P < 0.05) decreased SGOT activities (19). Putri et al. (20) showed that goat milk yogurt fortified with rice bran flour could reduce SGPT levels in rats, supporting the results of our study. The administration dose of 2 ml/kg BW was effective in reducing SGPT levels by 50.50 ± 7.590 (20).
5.1. Conclusion
The results of this study concluded that contrary to many other studies, consumption of white rice showed ineffective results disturbing biological parameters as compared to those rats that were on brown rice feed. Due to low amylose content and the presence of antioxidants, flavonoids, and high fiber content, brown rice shows beneficial effects on controlling and maintaining relevant biological parameters. They were more effective in managing weight, controlling blood glucose levels, maintaining HDL cholesterol and triglycerides, and lowering LDL and total cholesterol levels. White rice-fed rats showed elevated blood glucose levels, total cholesterol levels, LDL cholesterol, and lower HDL cholesterol levels. Very few significant changes were observed in SGPT and SGOT levels and liver functioning among brown and white rice-fed rats. Due to the short study duration, no significant changes were observed in the liver and pancreas histopathological examination.
