1. Background
The most important mission of the health system is to promote the level of health and respond to the needs of the people and society (1). These needs constantly change under the influence of economic, social, political, and environmental conditions. On the other hand, the pattern of diseases and risk factors are constantly changing, especially in the current era when very rapid changes are taking place in this sector. Responding to these changes is the most important demand based on which the health system should be transformed and promoted. All countries seek to implement innovations in their healthcare systems to promote access, justice, quality, and fair payments. Therefore, to maintain its effectiveness, health system changes need to align with global trends, and today, these changes can be seen in the form of transformation and reforms in health systems worldwide (2, 3).
Health indicators have improved in many countries, including Turkey and Thailand, since the health system reform program began (4-6). Data on indicators changes before and after the implementation of the transformation plan in Turkey and Thailand show that out-of-pocket expenses decreased after the implementation of the plan. The Ministry of Health in these countries has effectively convinced the government to implement health reform as a national priority and stakeholder management (7).
In Iran, in addition to the legal tasks of the fourth and fifth development programs in promoting health and reforming the country's macro-health indicators, international obligations, including the UN 3rd Millennium Development Goals, oblige all governments to pay attention to the health sector. In the fifth five-year development plan of the Islamic Republic of Iran, the government dealt with the issue of health and health insurance in 2 sections. It discusses the issue of health justice indicators and reducing the share of people's direct costs to a maximum of 30% of health costs, creating fair access to health services, helping with high costs of treatment, drug coverage, and treatment of patients with special and incurable diseases and assisting in providing and sustaining the required specialized workforce (8).
The health system reform program was implemented in Sistan and Baluchistan province at the same time as most parts of Iran in May 2013. The aim of this program in the first phase was reducing the payment of hospitalized patients, supporting the stay of physicians in deprived areas, the presence of specialist physicians residing in hospitals, improving the quality of hospital services, improving the quality of hoteling in hospitals, financial protection of patients with incurable and special diseases and low-income patients, promoting natural childbirth and launching an air emergency service (9).
Therefore, due to the newness of the health system transformation plan in Iran, it is necessary to conduct more studies in different fields, places, and times to achieve appropriate solutions to improve weaknesses and strengthen strengths. One of the ways to improve the quality of services is to standardize and compare indicators with standards or compare indicators at different times. Therefore, preparing and applying appropriate indicators is necessary to exercise effective monitoring. Performance measurement and evaluation are considered one of the most important measures to achieve efficient and effective management, and using the results of these evaluations can greatly help managers and policymakers in the health field regarding appropriate policy and effective interventions. Hospitals, as the most important part of the health care provision system, have a key role in providing patients prevention services, early identification, treatment, and rehabilitation services. Therefore, the health care system must have clear and comprehensive standards to provide services. Examining these standards and indicators can measure the quality and quantity of services. Among these, the hospital performance indicators are among the most important indicators, such as bed occupancy rate, inpatient bed-to-bed constructed, bed turnover interval (days), bed performance ratio, admission ratio per bed, surgery ratio to the operating room bed (operation per day), the average length of stay of the patient, (10) and the ratio of deaths to hospitalizations. After implementing the health system transformation plan in Iran, the need to study these indicators is felt more than ever.
Some studies have been carried out on the health system transformation plan's achievements, weaknesses, and strengths in different parts of the country (11-13). The results of Dadgar et al. showed that after the health transformation plan, all indicators were better than before, and this promotion was significant in all cases; only the average stay of patients after the transformation plan increased slightly (0.5%) which was not statistically significant (14). Rezaei also showed that the highest change was in the number of emergency and elective surgeries constructed (15).
Sistan and Baluchistan province is the second largest province of Iran, and its population is about 2.8 million people. Regarding development indicators, it is at the lowest level among the country's provinces. A study on the development of the country's provinces based on health indicators found that Sistan and Baluchistan province rated the last. The number of hospitals in this province is lower than expected despite the construction of several hospitals from the beginning of the transformation plan. Also, this province's average number of hospital beds (0.9 per thousand people) is lower than the national average (1.8). In addition, the old and worn-out medical facilities are among the other problems of this province, and the hospitals built before the revolution of Iran are still being used. Other problems include low access indicators and high incidence of diseases, especially contagious diseases in this province, such as rabies, tuberculosis, etc. (16).
2. Objectives
This study evaluated the hospital performance indicators before and after implementing the health system transformation plan in Sistan and Baluchistan. Three Universities of Medical Sciences (Zahedan, Zabol, and Iranshahr) provide health services to the people of this province.
3. Methods
We conducted an interrupted time series (ITS) study to evaluate the effects of HTP on 3 performance indicators approved and prioritized by the Ministry of Health and Medical Education, including bed occupancy rate, bed turnover interval, and average length of stay in hospitals in Sistan and Baluchistan province from March 2012 to March 2019 (6 hospitals covered by Zahedan University of Medical Sciences, 4 hospitals covered by Zabol University of Medical Sciences and 5 hospitals covered by Iranshahr University of Medical Sciences).
Bed occupancy rate is the amount of occupied beds, which refers to the ratio of day beds to active day beds in a certain period. Bed turnover interval is the number of times the patient of a hospital bed is changed in a certain period, and the average length of stay is the average number of days those patients stay in the hospital during a period (17).
Raw data required to calculate bed occupancy rate, bed turnover interval, and average length of stay was used using a data extraction form, and teachers in the Department of Statistics and Epidemiology and University Health Services Management and hospital specialists and health management experts confirmed their validity. The researcher, with the permission of the University's Vice-Chancellor and by visiting the studied hospitals in person, collected the necessary data (every month) from the Accreditation, Quality Improvement Unit and the statistics and medical records of the hospital. Fortunately, this study had no missing data regarding the 3 investigated indicators.
The study population to measure the indicators included all patients hospitalized in the hospitals of these 3 universities. In time series, the sample size equals the total number of observations. Our sample included 83 observations (i.e., one per month) starting 25 months before and ending 58 months after HTP.
The interrupted time series plan (segmented regression) was used in Stata software version 14 to investigate the effect of the health system transformation plan on performance indicators and data analysis. The data in the two periods before and after the implementation of the transformation plan were considered a time series, and the plan's effect on both the indicators and the trend of the changes after the plan was investigated.
Interrupted time series (ITS) analysis is a useful quasi-experimental design for evaluating the longitudinal effects of interventions through regression modeling. The term quasi-experimental refers to an absence of randomization. ITS analysis is principally a tool for analyzing observational data where full randomization, or a case-control design, is not affordable or possible (18).
In the interrupted time series model, 2 variables show the effect of a policy or experiment: one is the level variable that determines the immediate effect of the experiment, and the other is the trend variable that shows the long-term effect of the experiment. In other words, with this method, we find out what the level of the indicators has changed (immediate and short-term change) at the beginning of the project. Also, we can determine after each month following the implementation how the trend of the indicators has changed.
3.1. Statistical Analysis Method
To perform time series analyses, data stationarity must first be examined. If the data doesn’t have stationarity, we will make a mistake in the analysis. After entering the data in Stata software, Dickey-Fuller, Zivot, and Andrews tests, they examined the stationarity of time trends. Stata version 13 and Itsa package were used to estimate the model in interrupted time series studies. This package used Newey to estimate coefficients using ordinary least squares (OLS) regression and generates Newey-West standard deviation to counteract heterogeneity of variance and possible autocorrelation. Also, the Actest program was used in this software to determine the highest level of autocorrelation, and the results showed the existence of autocorrelation up to degree 12. Therefore, this issue was considered in estimating ITS models. This program examines autocorrelation using the Cumby-Huizinga test. The homogeneity of variance was confirmed using the Breusch–Pagan test, and the normality of residues of ITS models using the Jark Bra test.
4. Results
The results of this study are presented separately for 3 universities of Medical sciences in Sistan and Baluchistan (Zahedan, Zabol, Iranshahr) as follows:
Zahedan University of Medical Sciences:
4.1. Bed Occupancy Rate
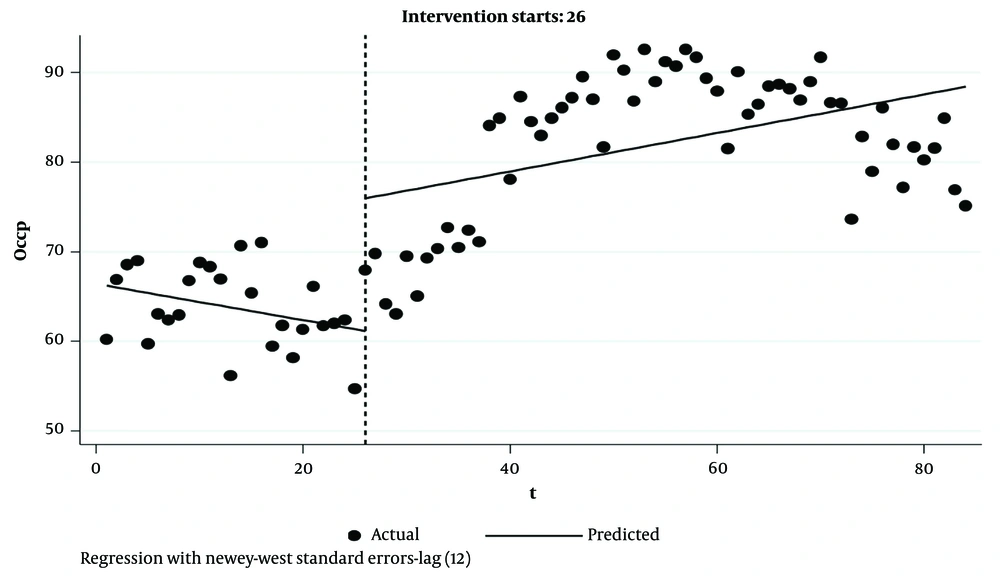
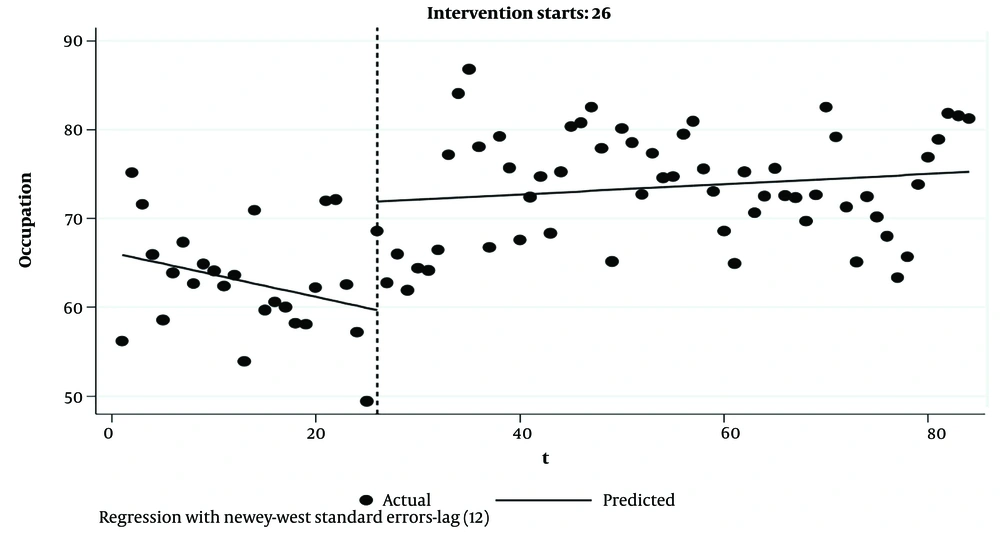
The plan's first month showed a significant increase in the bed occupancy rate of 14.8. In the annual and long-term time trend, an increase in the bed occupancy rate of 0.41 was observed, which was significant (P < 0.05). However, after the intervention, the bed occupancy rate increased to 0.21 annually, which was not significant (P > 0.05) (Table 1, Figure 1).
| Indicator and Variables | Mean ± SD | t | P-Value | Confidence Interval 95% | |
|---|---|---|---|---|---|
| Zahedan University of Medical Sciences | |||||
| Bed occupancy rate | |||||
| Basic occupancy rate | 66.4 ± 1.13 | 58.52 | 0.00 | 64.14 | 68.66 |
| Slop before intervention | -0.02 ± 0.077 | -2.64 | 0.01 | -0.355 | -0.048 |
| Changes in slop after intervention compared to before that (long-term effect) | 0.417 ± 0.196 | 2.12 | 0.037 | 0.026 | 0.8 |
| Immediate change in occupancy rate (short-term effect) | 14.81 ± 5.11 | 2.9 | 0.005 | 4.63 | 24.98 |
| Linear trend after intervention | 0.215 ± 0.1548 | 1.38 | 0.168 | -0.093 | 0.523 |
| F(3,80) | 24.33 | ||||
| P-value | < 0.0001 | ||||
| Bed turnover interval | |||||
| Basic occupancy rate | 1.63 ± 0.051 | 31.67 | 0.00 | 1.53 | 1.73 |
| Slop before intervention | 0.0076 ± 0.0035 | 2.15 | 0.035 | 0.00056 | 0.0146 |
| Changes in slop after the intervention compared to before that | -0.018 ± 0.0086 | -2.09 | 0.04 | -0.035 | -0.0008 |
| Immediate change in occupancy rate | -0.908 ± 0.215 | -4.21 | 0.000 | -1.33 | -0.47 |
| Linear trend after intervention | -0.014 ± 0.0066 | -1.56 | 0.12 | -0.02 | 0.0028 |
| F(3,80) | 44.68 | ||||
| P-value | < 0.0001 | ||||
| The average length of stay | |||||
| Basic occupancy rate | 3.27 ± 0.065 | 49.94 | 0.00 | 3.14 | 3.40 |
| Slop before intervention | -0.012 ± 0.004 | -2.94 | 0.004 | -0.02 | -0.003 |
| Changes in slop after the intervention compared to before that | 0.109 ± 0.0048 | 2.26 | 0.026 | 0.0013 | 0.020 |
| Immediate change in occupancy rate | -0126 ± 0.078 | -1.61 | 0.111 | -0.2828 | 0.0298 |
| Linear trend after intervention | -0.0013 ± 0.0016 | -0.79 | 0.42 | -0.0046 | 0.002 |
| F(3,80) | 28.33 | ||||
| P-value | <0.0001 | ||||
4.2. Turnover Interval
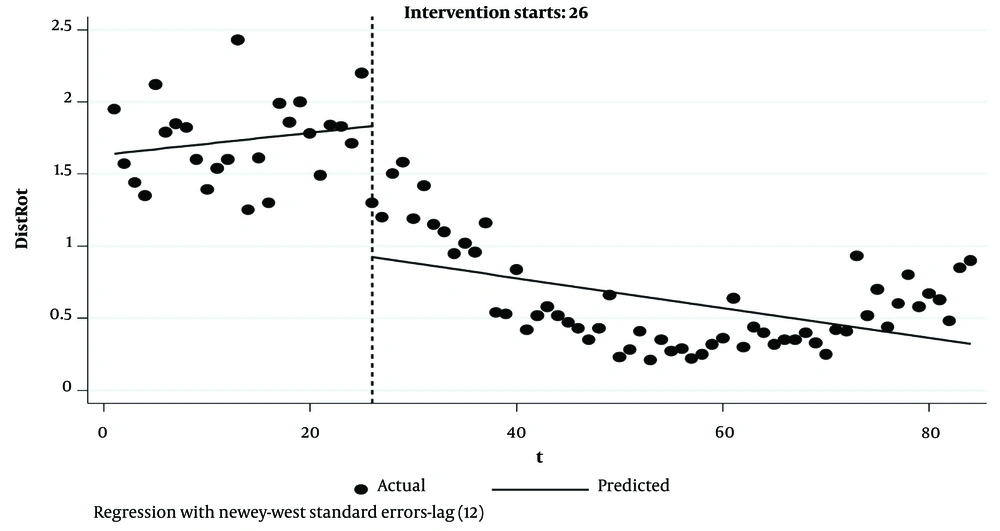
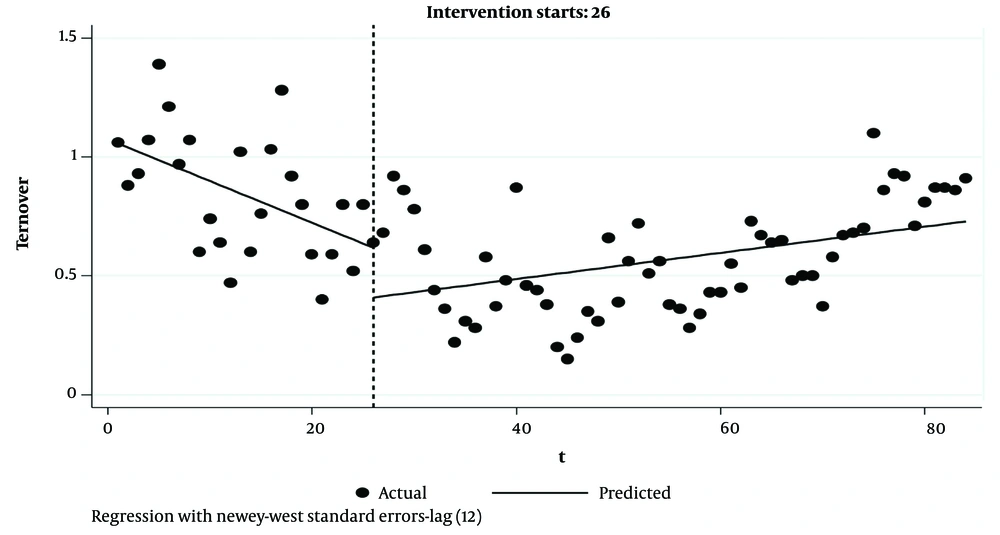
In the plan's first month, there was a significant reduction in the turnover interval of 0.9. A decrease in the turnover interval of 0.016 was observed in the annual and long-term time trend, which was significant (P < 0.05). After the intervention, the turnover interval was reduced to 0.01 annually, which was not significant (P > 0.05) (Table 1, Figure 2).
4.3. Average Length of Stay
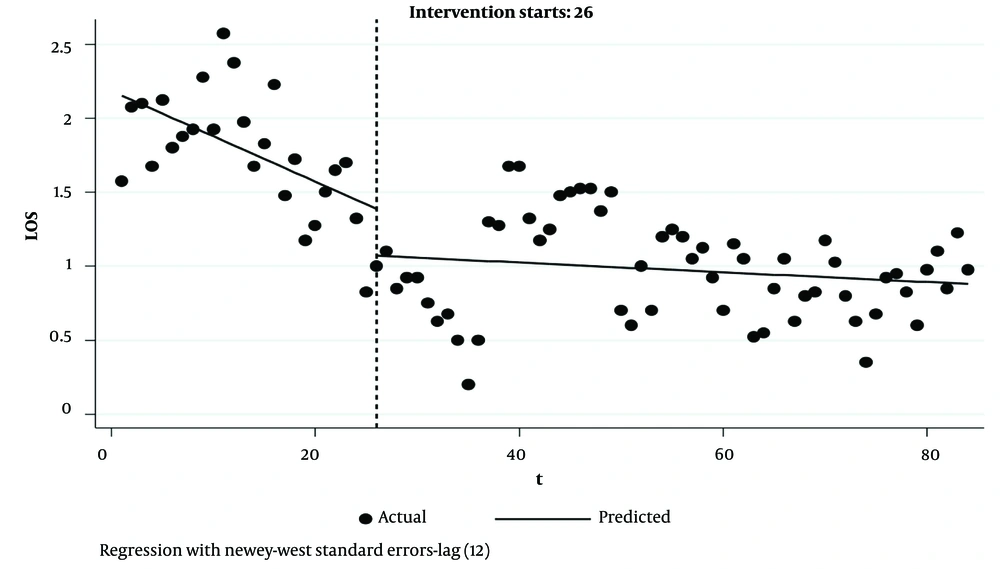
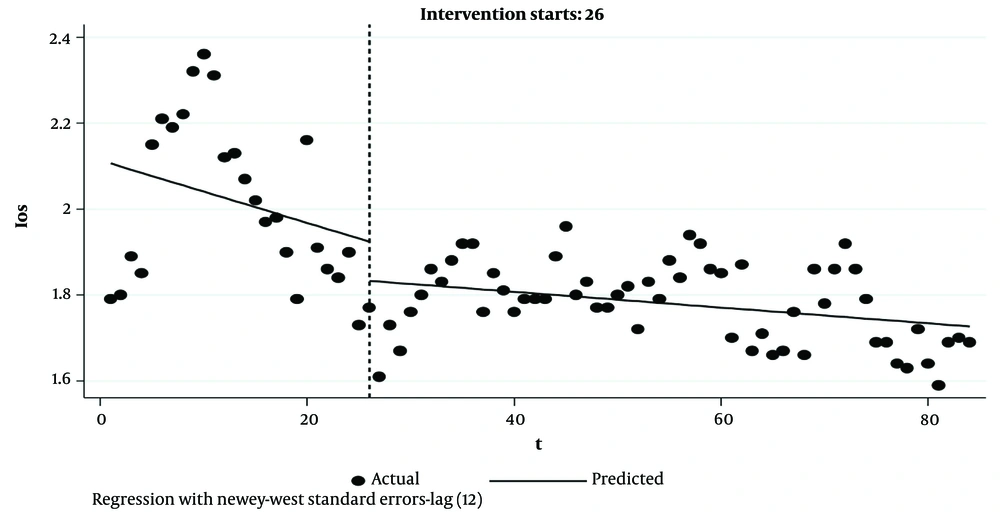
In the plan's first month, a decrease in the average length of stay of 0.12 was observed, which was not significant. There was a significant increase in the average length of stay equal to 0.01 in the annual and long-term time trend. After the intervention, the average length of stay decreased annually by 0.0013, which was not significant (P > 0.05) (Table 1 and Figure 3).
4.4. Iranshahr University of Medical Sciences
4.4.1. Bed Occupancy Rate
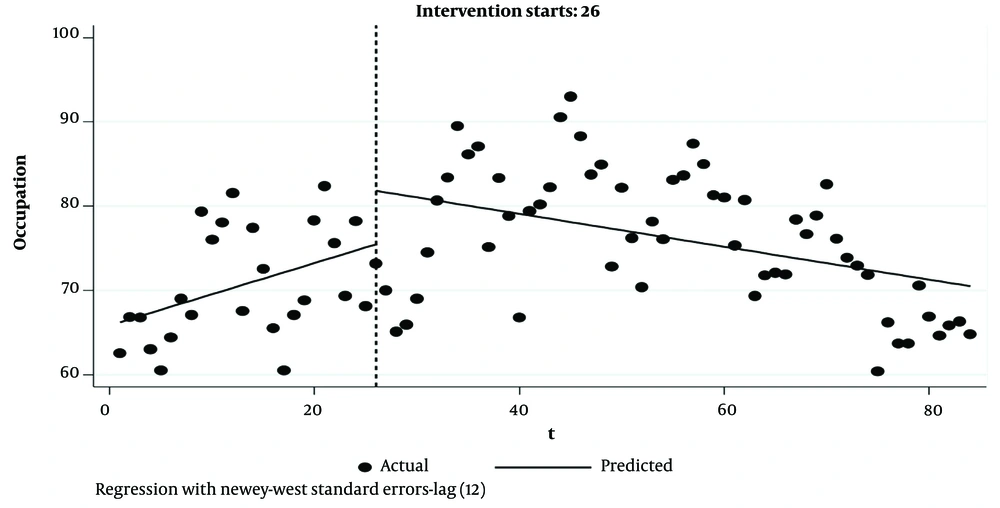
In the plan's first month, an increase in the bed occupancy rate of 6.35 was observed, which was not significant. A decrease in the bed occupancy rate of 0.56 was observed in the annual and long-term time trends, which was significant. After the intervention, the bed occupancy rate decreased annually to 0.19, which was not significant (P > 0.05) (Table 2, Figure 4).
| Indicator and Variables | Mean ± SD | t | P-Value | Confidence Interval 95% | |
|---|---|---|---|---|---|
| Iranshahr University of Medical Sciences | |||||
| Bed occupancy rate | |||||
| Basic occupancy rate | 65.8511 ± 2.049 | 32.13 | 0.000 | 61.77266 | 69.92954 |
| Slop before intervention | 0.3696077 ± 0.1257 | 2.94 | 0.004 | 0.11935 | 0.61985 |
| Changes in slop | -0.5648 ± 0.1875 | -3.01 | 0.003 | -0.93809 | -0.19162 |
| The immediate change in bed occupancy Level | 6.359202 ± 4.0844 | 1.56 | 0.123 | -1.769201 | 14.4876 |
| Linear trend after intervention | -0.1953 ± 0.1184 | -1.6495 | 0.1030 | -0.4308 | 0.0403 |
| F(3,80) | 4.92 | ||||
| P-value | <0.0001 | ||||
| Bed turnover interval | |||||
| Basic turnover interval | 1.0733 ± 0.047 | 22.65 | 0.000 | 0.9790009 | 1.167599 |
| Slop before intervention | -0.0175154 ± 0.0029 | -5.88 | 0.000 | -0.0234481 | -0.0115827 |
| Changes in slop after the intervention compared to before that | 0.0230227 ± 0.004459 | 5.16 | 0.000 | 0.0141491 | 0.0318963 |
| Immediate change in turnover interval | -0.2087983 ± 0.1260 | -1.66 | 0.102 | -0.4596571 | 0.0420605 |
| Linear trend after intervention | 0.0055 ± 0.0034 | 1.62 | 0.107 | -0.0012 | 0.0122 |
| F(3,80) | 19.76 | ||||
| P-value | <0.0001 | ||||
| Average length of stay | |||||
| Basic average length of stay | 2.11 ± 0.12 | 16.30 | 0.00 | 1.85 | 2.37 |
| Slop before intervention | -0.007 ± 0.007 | -0.94 | 0.35 | -0.02 | 0.008 |
| Changes in slop | 0.005 ± 0.008 | 0.67 | 0.5 | -0.01 | 0.02 |
| Immediate change in the length of stay | -0.09 ± 0.08 | -1.10 | 0.27 | -0.25 | 0.07 |
| Linear trend after intervention | -0.001 ± 0.001 | -1.67 | 0.09 | -0.004 | 0.0003 |
| F(3,80) | 7.50 | ||||
| P-value | <0.0001 | ||||
4.4.2. Bed Turnover Interval
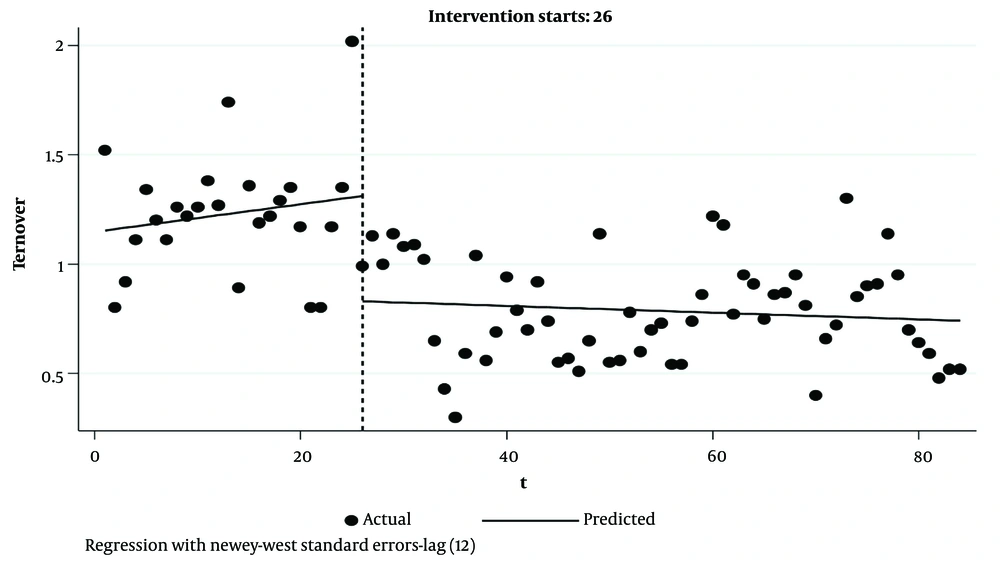
In the plan's first month, a decrease in the turnover interval of 0.20 was observed, which was not significant. An increase in the turnover interval of 0.023 was observed in the annual and long-term time trends, which was significant. After the intervention, the turnover interval increased to 0.005 annually, which was not significant (P > 0.05) (Table 2, Figure 5).
4.4.3. Average Length of Stay
In the plan's first month, a decrease in the average length of stay of 0.09 was observed, which was not significant. An increase in the average length of stay of 0.005 was observed in the annual and long-term time trend, which was not significant. After the intervention, the average length of stay decreased annually by 0.0018, which was not significant (P > 0.05) (Table 2, Figure 6).
4.5. Zabol University of Medical Sciences
4.5.1. Bed Occupancy Rate
In the plan's first month, an increase in the bed occupancy rate of 12 services was observed, which, of course, was significant. An annual and long-term significant increase of 0.30 items was observed (P < 0.05). After the intervention, the bed occupancy rate increased to 0.05 annually, which was not significant (P > 0.05) (Table 3, Figure 7).
4.5.2. Bed Turnover Interval
In the plan's first month, a decrease in the turnover interval of 0.48 was seen, which was significant. A decrease in the turnover interval of 0.007 was observed in the annual and long-term time trend, which was not a significant increase considering a P-value more than 0.05. After the intervention, the turnover interval increased to 0.0015 annually, which was not significant (P > 0.05) (Table 3, Figure 8).
| Indicator and Variables | Mean ± SD | t | P-Value | Confidence Interval 95% | |
|---|---|---|---|---|---|
| Zabol University of Medical Sciences | |||||
| Bed occupancy rate | |||||
| Basic services | 66.152 ± 1.103 | 59.96 | 0.000 | 63.956 | 68.348 |
| Slop before intervention | -0.2488 ± 0.0952 | -2.61 | 0.011 | -0.43844 | -0.0591 |
| Changes in slop after the intervention compared to before that | 0.3063 ± 0.120 | 2.54 | 0.013 | 0.0666 | 0.5460 |
| Immediate change in the number of patients | 12.215 ± 0.1204 | 4.03 | 0.000 | 6.1827 | 18.248 |
| Linear trend after intervention | 0.057 ± 0.070 | 0.816 | 0.416 | -0.082 | 0.197 |
| F(3,80) | 27.36 | ||||
| P-value | <0.0001 | ||||
| Bed turnover interval | |||||
| Basic services | 1.1477 ± 0.0610 | 18.80 | 0.000 | 1.0262 | 1.26204 |
| Slop before intervention | 0.0063 ± 0.00544 | 1.16 | 0.251 | -0.00453 | 0.01713 |
| Changes in slop after the intervention compared to before that | -0.0078 ± 0.00625 | -1.25 | 0.214 | -0.0202 | 0.00461 |
| Immediate change in the number of patients | -0.4809 ± 0.1216 | -3.95 | 0.000 | -0.7230 | -0.2387 |
| Linear trend after intervention | -0.0015 ± 0.0024 | -0.6286 | 0.6314 | -0.0064 | 0.0033 |
| F(3,80) | 27.26 | ||||
| P-value | <0.0001 | ||||
| Average length of stay | |||||
| Basic services | 2.2764 ± 0.0416 | 54.65 | 0.000 | 2.1935 | 2.3592 |
| Slop before intervention | -0.0144 ± 0.0026 | -5.38 | 0.000 | -0.0197 | -0.0090 |
| Changes in slop after the intervention compared to before that | 0.0169 ± 0.00318 | 5.21 | 0.000 | 0.0105 | 0.02327 |
| Immediate change in the number of patients | 0.2014 ± 0.0719 | 2.50 | 0.006 | 0.0582 | 0.3446 |
| Linear trend after intervention | 0.0025 ± 0.0020 | 1.233 | 0.2210 | -0.0015 | 0.0065 |
| F(3,80) | 11.67 | ||||
| P-value | <0.0001 | ||||
4.5.3. Average Length of Stay
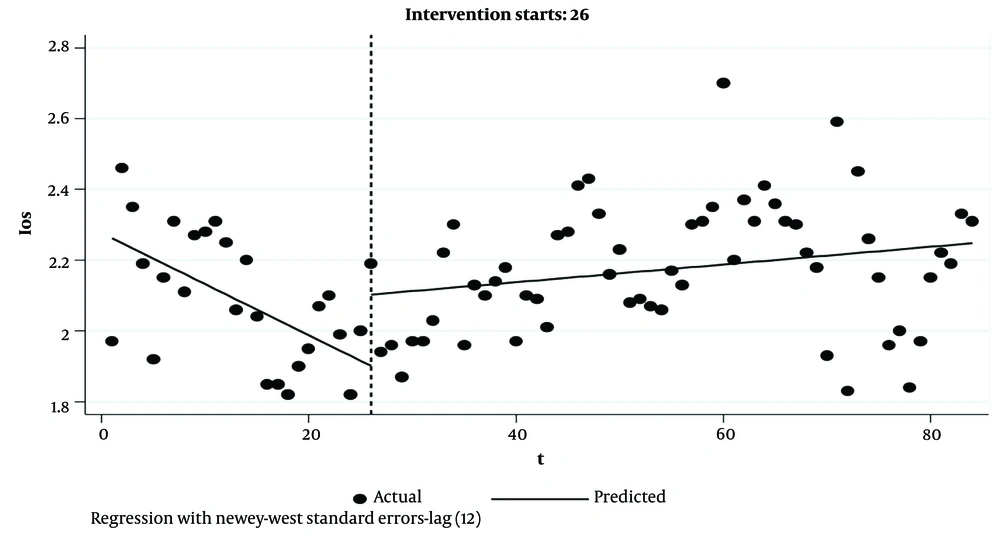
In the plan's first month, an increase in the average length of stay by 0.20 was observed, which was significant. An average length of stay increase of 0.016 was observed in the annual and long-term time trend, a significant increase considering the P-value less than 0.05. After the intervention, the average length of stay increased annually by 0.0025, which was not significant (P > 0.05) (Table 3, Figure 9).
5. Discussion
The health system transformation plan (HTP) was implemented in Iran in 2014 to improve the health system's performance. This study aimed to investigate and compare the status of performance indicators of hospitals in Sistan and Baluchistan province in the 2 periods before and after the implementation of this plan. This study analyzed data related to performance indicators through an interrupted time series.
According to the reports of the Ministry of Health and Medical Education of Iran, in implementing the transformation plan, the people's share of hospitalization expenses reached 5.4% from 37%. This reduction in payments increased access to health services, especially for low-income groups, ultimately leading to increased hospital admissions (19-21).
Undoubtedly, it should also be considered that if the increase in performance indicators due to the reduction of payments does not increase the induced demand for health service providers, it will cause the inefficiency of the health system (21).
Findings related to the bed occupancy rate (BOR) indicator demonstrated that in the studied universities of the province, HTP had a significant immediate effect on this indicator, and BOR increased in all hospitals. Also, the plan had a significant long-term effect on the indicator; BOR increased in the hospitals of Zahedan and Zabol Universities and decreased in the hospitals of Iranshahr University for a long time. Factors affecting the bed occupancy rate include financial access, clinic activity and regular attendance of physicians, physicians being obliged to refer hospitalized patients to their hospitals, and timely payment to physicians. These effective factors also had important sub-criteria, such as financial access and appropriate insurance coverage. Hospital specialization and hospital space were considered among the sub-criteria of hospital type and services. Sub-criteria related to active emergency, timely visits of specialists or residents, and appropriate triage have an important effect on bed occupancy rate (22). Hashemian reached a different conclusion to the present study and pointed out that implementing the plan did not significantly increase the productivity of hospital beds in deprived areas (23).
In Yaghoubi et al.'s study on the factors affecting the bed occupancy rate indicator, it was found that financial access had the highest geometric mean (priority) (0.214), and clinic activity had the lowest priority (0.129). Therefore, in addition to providing quality services and adequate insurance coverage, hospitals should also pay attention to activating the clinic and the hospital emergency department, which are the entrances to hospitals (24).
Findings related to the average length of stay (ALS) indicator showed that HTP had an immediate effect on this indicator at the hospitals of 3 Universities. ALS decreased in the hospitals of Zahedan and Iranshahr Universities and increased in those of Zabol University.
Also, the plan had a significant long-term effect on the indicator; ALS increased in the hospitals of Zabol University and decreased in hospitals of Zahedan and Iranshahr Universities for a long time.
Length of stay is often used as an indicator of efficiency. From a hospital perspective, decreasing the length of stay increases efficiency by increasing the output (number of patients) or decreasing the data (number of beds). Reducing unnecessary hospital stays can facilitate more services to more people and can reduce the pressure of investment and the establishment of new medical centers. Even if bed occupancy is low in hospitals, it should be a high priority for managers and planners in the hospital's strategic, financial, human, and physical planning (25). By reducing the length of stay, productivity increase, costs are reduced, and the depreciation of hospital resources are decreased (26). According to studies, the factors affecting this indicator can be gender (services rendered to women more than men), marital status (longer stay of singles), age (is directly related), and reasons for hospitalization of patients also affect their average length of stay. Also, the severity and type of the disease affect the patient's length of stay in the hospital (27). The standard rate of the average length of stay indicator in different hospitals and wards varies according to the type of specialization and the type of admitted patients (28).
Mousavi-Rigi et al. conducted a study titled “Investigation and Comparison of Some Hospital Performance Indicators Before and After Implementing the Health System Transformation Plan in selected Bushehr University of Medical Sciences Hospitals”. This research indicated that the patient's length of stay increased compared to before the implementation of the health transformation plan (29).
In a study conducted by Ghasemzadeh et al. (30) to evaluate the performance indicators of medical education centers in Qazvin city before and after the implementation of the health transformation plan, it was found that the implementation of the health transformation plan caused a 5.2% increase in the length of stay. These findings are in line with the study of Rezaei (15) at the hospital of Hamedan University of Medical Sciences and Dadgar et al. (14) at the hospitals of Lorestan University of Medical Sciences.
Findings related to the bed turnover interval (BTI) indicator showed that in the studied universities of the province, HTP had a significant immediate effect on this indicator, and BTI had decreased in all hospitals. Also, in the long term, BTI decreased in the hospitals of Zahedan and Zabol Universities and increased in Iranshahr University hospitals.
Dadgar et al.'s study showed that the bed turnover interval decreased after implementing the transformation plan. It can be said that the workflow of the studied hospitals increased with the implementation of the transformation plan, which significantly increased the bed occupancy rate indicator and reduced the turnover interval indicator (14). Rezaei also showed that the implementation of the transformation plan significantly reduced the bed turnover interval in the hospitals of Hamadan University of Medical Sciences (15). Possible reasons for increasing this indicator in hospitals of Iranshahr University for a long time are the deprivation of this area and the lack of hospital facilities.
This research is the first study that examines the impact of the Health Transformation Plan on several operational indicators of hospitals in Sistan and Baluchistan province as deprived regions of Iran. Also, the interrupted time series method was used to evaluate the longitudinal effects of interventions in this study.
This study had some limitations. For example, due to the lack of control over other influential and confounding factors in the study, the changes made in the indicators cannot be attributed to the transformation plan. However, no other effective intervention was implemented during the transformation plan.
Also, this study examined only 3 widely used performance indicators. The analysis of other indicators such as admission ratio per bed, surgery ratio to operating room bed, the ratio of deaths to hospitalizations, access, justice, quality, and effectiveness (re-admission rate, hospital infection rate, staff, and patient satisfaction, hospital complaints rate, medical error rate) in the form of future studies for the evaluation of the health system transformation plan can be useful.
5.1. Conclusions
According to the results of this study and similar studies, the positive effect of implementing the health transformation plan in relatively short conditions is somewhat clear. These changes are mainly related to patients who need treatment. Still, due to high direct out-of-pocket payments before the plan's implementation, they gave up the treatment or did not have access to physicians in the public sector. With the implementation of the transformation plan and reduction of franchise, they have more access to specialists in their treatment.
However, in the long run, the impact of the health transformation plan on all 3 functional indicators of the hospitals of Sistan and Baluchistan province that were examined in the present study was insignificant, and the positive and negative changes in the indicators were not significant; further analytical studies are needed to investigate the reason. Studies show that in most medical universities in the country, a positive change has been observed in most performance indicators.
