1. Background
Iran is the second most populated Middle East country. In the past four decades, Iran has experienced unprecedented events with great consequences on the political organization and economic development of the country. The period began with the Islamic Revolution that started in late 1978. Shortly after the success of the revolution, a military aggregation was opened by Iraq. The war lasted for 8 years (1980 - 1988) and was associated with immense damage to human, economic, and material terms (1).
Studies have shown, before the revolution, the gap between rural and urban areas was wide and the socio-economic condition in rural areas was substantially different from their urban counterparts (1, 2). Thus, to counter this trend, the post-revolutionary government gave a priority to rural areas aiming to decrease the inequalities. For this purpose, the construction crusade organization (Jihad-e Sazandegi) was established in 1979, which its activities included infrastructure projects including the expansion of piped water and electricity networks, construction of roads, building rural schools, public bathrooms, and health centers, and the distribution of agricultural machinery (1). These tasks were done by revolutionary engineers, teachers, and students of universities who volunteered and called Jihadgar or Jihad organization officers. These efforts led to improved environmental conditions in the rural areas.
Six years after the revolution, in 1985, the Ministry of Health and Medical Education (MoHME) decided to implement the primary health care program that had been planned by the previous regime. The goals of PHC were justice and access improvement in rural areas. Four years after the start of this program, the number of primary health care facilities dramatically increased to 7900 health houses. These the houses were staffed with a new cadre of community-based health workers, called Behvarz, who were responsible for providing basic preventive and primary health care, advice on nutrition and family planning, providing maternal and childcare, and monitoring environmental health conditions (3-7). In addition to health houses in rural areas, health centers were constructed in the urban areas. However, their activities were passive and could not reach the goals in the urban areas (1).
Indeed, after the revolution, a great ideological emphasis was placed on improving the status of the poor and decreasing the difficulty of the lower classes. Over the past 35 years, the Islamic Republic of Iran has made a considerable investment in infrastructures to reduce inequalities between rural and urban areas (8).
Infrastructure plays a key role in the agenda of sustainable development as it has done in achieving the millennium development goals (MDG). Studies support a close link between infrastructure development and poverty decrease (9-11). The lack of access to essential services such as piped water, housing, energy and basic health services prevent inclusive growth, decline poverty, and promote health (12, 13).
Regional infrastructure development is among the most important issues attracting the attention of planners in recent decades (14). Achieving integrated development is possible through the balanced distribution of various services between different regions of a country (15). Therefore, it is necessary to be aware of the country’s development status for pursuing the development goals.
As one of the main goals in Iran was to reduce deprivation and improve regional equities after the revolution, we evaluated the regional infrastructure development status between 1976 and 2011 in rural and urban areas at county and provincial levels.
2. Methods
2.1. Data
Our unit of observation is set at two levels: the first is at the county level, which is divided into rural and urban areas. Therefore, for each county, we have data of urban and rural areas, separately. The second is at the provincial level. Two sources of data are used for the analysis: the first is the national population and housing data in Iran, which was conducted in 1976, 1986, 1996, 2006, and 2011. The national census was performed every ten years until 2006 and after that, it was agreed to continue every 5 years. It is to gather information on the individual and household levels. We used the data to derive information about the infrastructure variables including piped water, electricity, piped gas, and bathrooms. We selected these years because they included the period before the revolution until now.
The second is census data on health houses. The health house census includes information compiled by the Iranian Ministry of Health and Medical Education (MOHME). When a health house was established and staffed formally by at least one Behvarz, the medical university responsible for its supervision reported this information to the Office of Network Development (OND), which then officially acknowledged it as a functioning health house. The MOHME compiled health house census data from the OND reports. We received information on the year and province of establishment for 16923 villages that had a health house by 2005. More than 90 percent of the rural populations are inhibited in these villages, comprising almost 30% of all villages of Iran. We received an introduction letter from Tehran University of Medical Sciences for getting all data.
For data cleaning, we first entered the census data into Excel files. Data of all urban areas for each variable were merged into one Excel file and data of all rural areas were merged into another Excel file for each census year. We inserted the name and code of each county in rows along with data according to the county division of the census year. At the end of this step, each census year had differences in the formatting of the file and the variables. Therefore, each file needed to be further homogenized to merge them across years. We had to have variables that could measure the same thing in each year with the same names. For this purpose, we wrote the lines of code to pull the variables together across years in a cohesive manner in STATA software. At the end of running the codes, we had a set of datasets for each type of variable (piped water, electricity, piped gas, and bathrooms). Piped water, electricity, piped gas, and bathrooms datasets were at the county-year level, so they had one row for each county in each year.
In addition, data on health houses were imported to STATA software. With writing the lines of codes, the health-house data were converted to the province-level panel with rows for each province in each year between 1973 and 2005 describing the cumulative number of health houses present in each province and each year.
2.2. Creating Crosswalk for Change Division
According to the country division, there were 162 Counties in Iran by 1976. During the time, these Counties were divided more and their number increased to 400 by 2011. In addition, until the 1990s, Iran was divided into 24 provinces, and then their number increased to 26 in 1996, to 30 in 2006, and to 31 in 2011.
What we needed to do was to construct variables for consistent geographic areas over time. Therefore, we obtained the country division of Iran for each census year. These files showed us each village is part of which county and each county is part of which province. Each county had a unique code over time; therefore, we could merge the division between years on the code of county to create a crosswalk between census years. We did this by writing the lines of codes in STATA software. At the end of this step, data of all census years had the same division based on the 1976 census.
In the file of health houses that we received, the location of each health house was according to the division province of the year of establishment. Therefore, we had to find the location of each health house according to the 1990s division file to create consistent geographic areas over time.
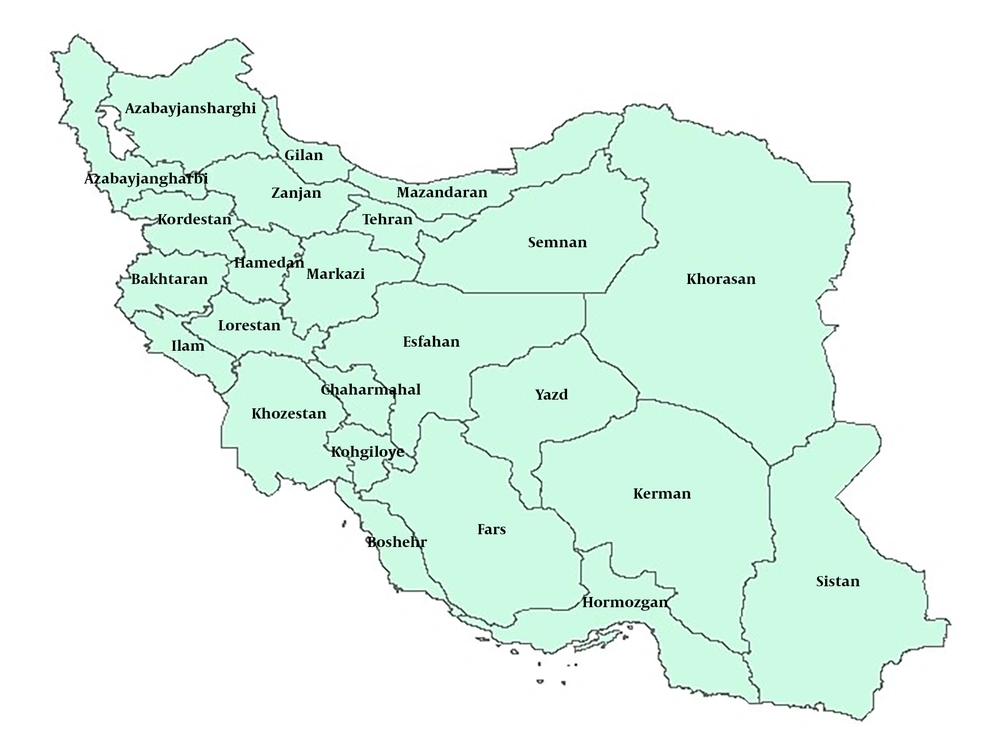
The country division of Iran in 1990s is presented in Figure 1.
2.3. Analysis
After preparing data in the uniform shape, we counted data for piped water, electricity, piped gas, and bathrooms. Therefore, we had to adjust variables according to the number of households for piped water, electricity, piped gas, and bathrooms. For this purpose, the share of variables was calculated, for example, the share of households that have piped water in rural areas of a county. In addition, for the provincial level, the means and standard deviations were calculated. For health houses data, we calculated the number of health houses per thousand at the provincial level.
3. Results
3.1. Piped Water
At the county level, the share of households that had piped water in rural areas ranged from 0.03% to 77% in 1976. However, in about 93% of the rural areas, less than 50% of households had piped water. The lowest access belonged to the rural areas of Lahijan while on the other hand, the rural areas of Semnan had the highest access. This range extended from 0.09% to 94% by 1986 and in 48% of the rural areas, the share of households that had piped water increased to more than 50%. In 1996, the lowest rate was 15% and belonged to Fuman, a county in Gilan, and in 58% of the rural areas, more than 70% of households had piped water. The lowest rate increased to reach 31% and 37% in 2006 and 2011, respectively. Zahedan, a county of Sistan and Baluchestan, and some counties of Gilan had the worst situation in the census years. In 2011, in almost 85% of the rural areas, the rate of households that had piped water raised to upper than 80%. In summary, access to piped water had an ascending trend during all census years.
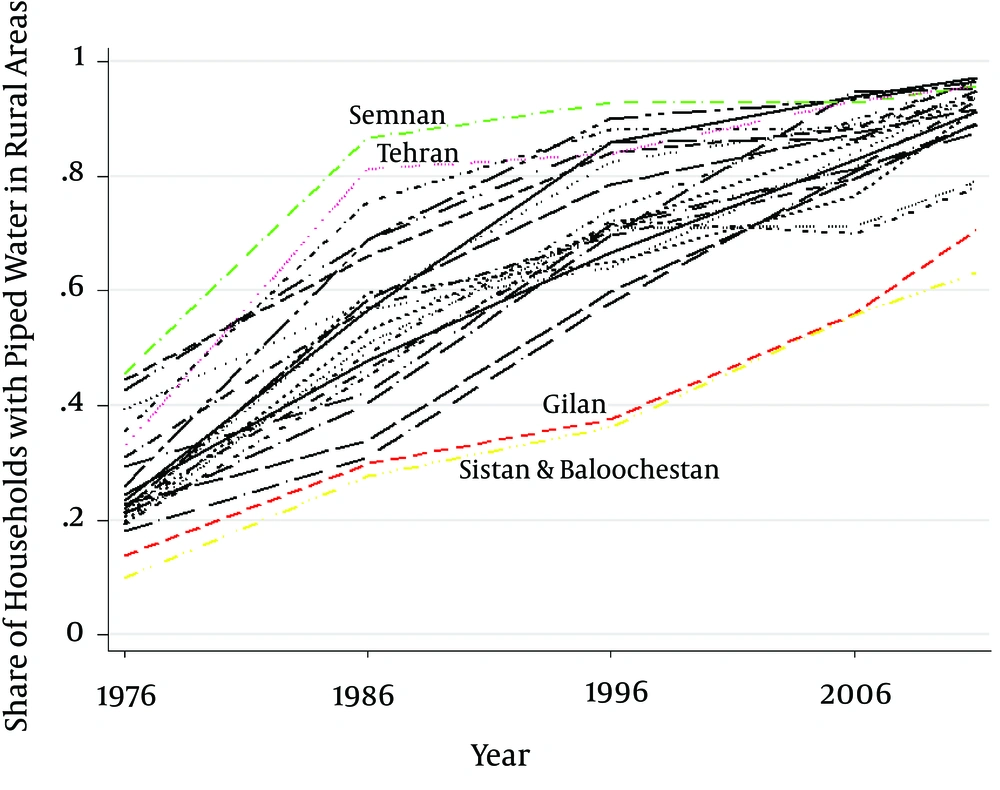
At the provincial level, as Figure 2 shows, the rural areas of Sistan and Baluchestan and Gilan had the lowest mean of access to piped water with 9.38 and 13.76 percent, respectively; and the rural areas of Semnan had the highest (45.55%) in 1976. However, simultaneously, Semnan had the highest standard deviation (22.30) and Sistan and Baluchestan had the lowest with 1.28 percent in this census year. In 1986, on the one hand, the mean of access in Semnan reached 86.68% and on the other hand, it’s standard deviation. decreased to 7.57%. After the war, in 1996, just the mean of Sistan and Baluchestan and Gilan was lower than 50% (36.19 and 37.59); and provinces such as Semnan, Isfahan, Fars, and Markazi, which are located at the center of the country, had the best situation. The lowest mean (55.76, 63.16) and the highest standard deviation (25.26, 24.94) belonged to Sistan and Baluchestan in 2006 and 2011.
In urban areas, the share of households that had access to piped water ranged from 62% (Bandar Anzali) to 100% in 1976 and in about 86% of urban areas, the rate of households that had access to piped water exceeded 90%. In 1986, the year of the Iran-Iraq war, the lowest access decreased to 44%. The rate belonged to Islamabad, Saghez, and Songhor. These counties are placed in Kermanshah and Kurdistan provinces. In addition, the percent of areas in which more than 90% of their households had piped water declined to 61%. Almost in all Counties, compared to the previous census, access to piped water had a downward trend. In 1996, the census year after the war, this trend was reversed and in most of the counties, the accessibility improved. Baneh, a county in Kurdistan, had the lowest access (55%) and in 83% of the urban areas, more than 90% of households had piped water. The lowest access still belonged to Baneh with 66% and 85% by 2006 and 2011, respectively. In addition, in more than 99% of the urban areas, more than 90% of households had piped water.
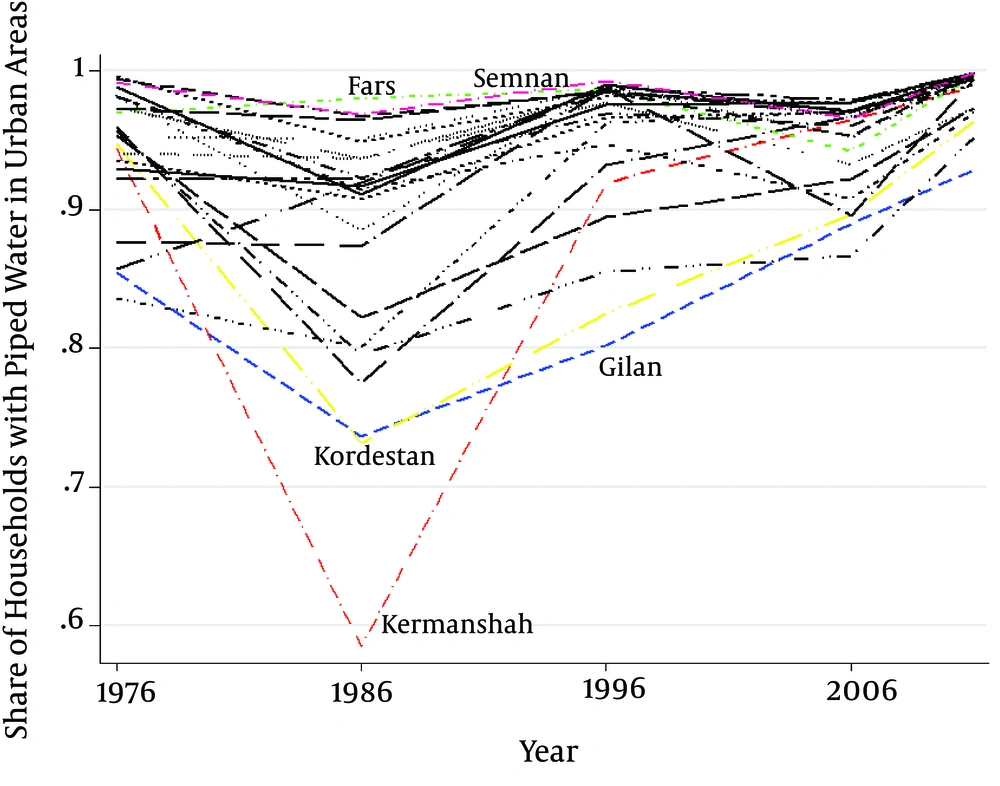
At the provincial level, as Figure 3 indicates, Gilan had the lowest access with 85.46 percent and provinces such as Semnan, Ilam, and Kohgiluyeh and Boyer-Ahmad had a mean more than 99% by 1976. In 1986, the mean access in most provinces decreased sharply: Kermanshah and Kordestan had the greatest decline and their access reached 58.50% and 73.17%, respectively. In addition, the standard deviation of these two provinces increased to 16.60 and 14.40 percent, respectively. After the war, in 1996, the situation of all provinces improved. In the census year, Gilan (80.22%), Kordestan (82.49%), and Sistan and Baluchestan (85.53%) had the lowest mean of access. In addition, the standard deviation in these provinces was high, between 12.69 and 17.24. In 2006 and 2011, Gilan and Sistan and Baluchestan still had the lowest access, but their standard deviation decreased to 5.72 and 4.54, respectively.
Concerning the gap between rural and urban areas, Sistan and Baluchestan (85.84%) had the most gap between urban and rural areas, while Chaharmahal and Bakhtiari (43.13%) had the least gap in 1976. The gap decreased in all provinces by 1986, but Kermanshah had a sharp decline and its gap reaching 1.48 percent in the census year. However, in 1996, the gap of this province increased to 22.34%. In all other provinces, the trend was descending. In addition, in most of the provinces, the gap decreased by 2006 and 2011 and just in Sistan and Baluchestan and Bushehr the trend reversed and their gap increased a little.
3.2. Piped Gas
At the county level, households in rural areas did not have piped gas in 1976. According to the result of the next census, in 1986, just in about 20% of counties, rural areas had access to piped gas; however, in more than 70% of these areas, the percent of households that had piped gas was less than 5%. Masjed Soleyman and Gachsaran counties in Khuzestan and Kohgiluyeh and Boyer-Ahmad provinces had the highest access with 22 and 20 percent, respectively. Until 1996, not only access to piped gas did not have any improvement but also the trend was descending in some areas. In the 2006 census, the access rate had a great progress and in about 78% of the counties, some rural areas had access to piped gas. However, in more than 35% of these counties, the share of households that had piped gas was less than 10% and just in 12% of the counties, the share was more than 50%. In 2011, access to piped gas ranged from 1% to 99% and in 33% of the Counties, more than 50% of their households in rural areas had piped gas.
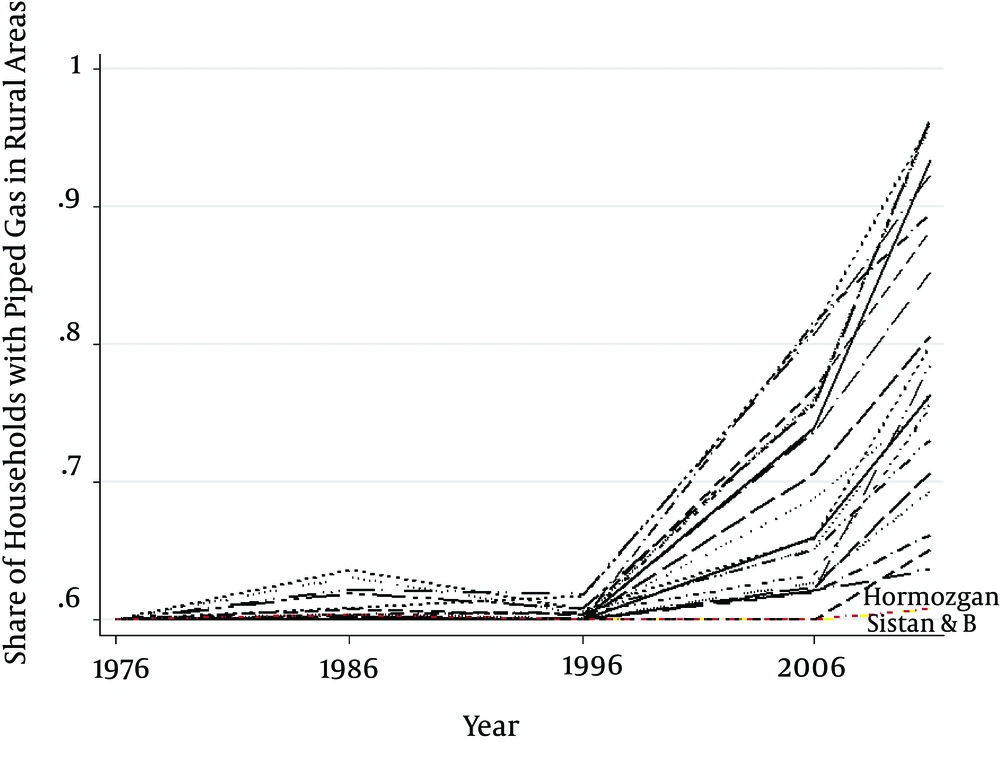
At the provincial level, as Figure 4 shows, in 12 provinces, rural areas did not have any access to piped gas and the highest mean of access belonged to Kohgiluyeh and Boyer-Ahmad (7.24%) in 1986. The access in rural areas of some provinces decreased in 1996, but the trend became ascending by 2006. Semnan had the best situation with 43.31% and Ilam, Sistan and Baluchestan, and Hormozgan had the worst with 0% in the census year. In 2011, the rural areas of Isfahan, Hamadan, Mazandaran, and Tehran had the highest access with a mean of 72.73%, 72.29%, and 72.10%, respectively. In addition, Sistan and Baluchestan and Hormozgan still had the lowest mean at 1.45% and 1.58%, respectively.
In urban areas, at the county level, in 1976, the households of urban areas did not have piped gas. Afterward, in almost 33% of the counties, urban areas obtained access to piped gas in 1986; however, in 62% of these counties, the share of households that had piped gas was less than 5% and only urban areas of four counties had an access rate of more than 50%. In addition, the highest access belonged to Behbahan, a county in Khuzestan province with 78%. In 1996, most of the counties had progressed and in 32% of the counties, the access rate of urban areas was more than 50%. However, still, there were 66 counties that none of their households had piped gas. Astara, a county in Gilan, had the highest access with 96%. In 2006, most of the counties had a great development. In about 36% of the counties, the access rate increased to more than 90%. However, some counties that mostly belonged to Sistan and Baluchestan, Kermanshah, Ilam, Hormozgan, and Khorasan provinces did not have piped gas until that year. The access rate reached more than 90% in urban areas of 94 counties by 2011.
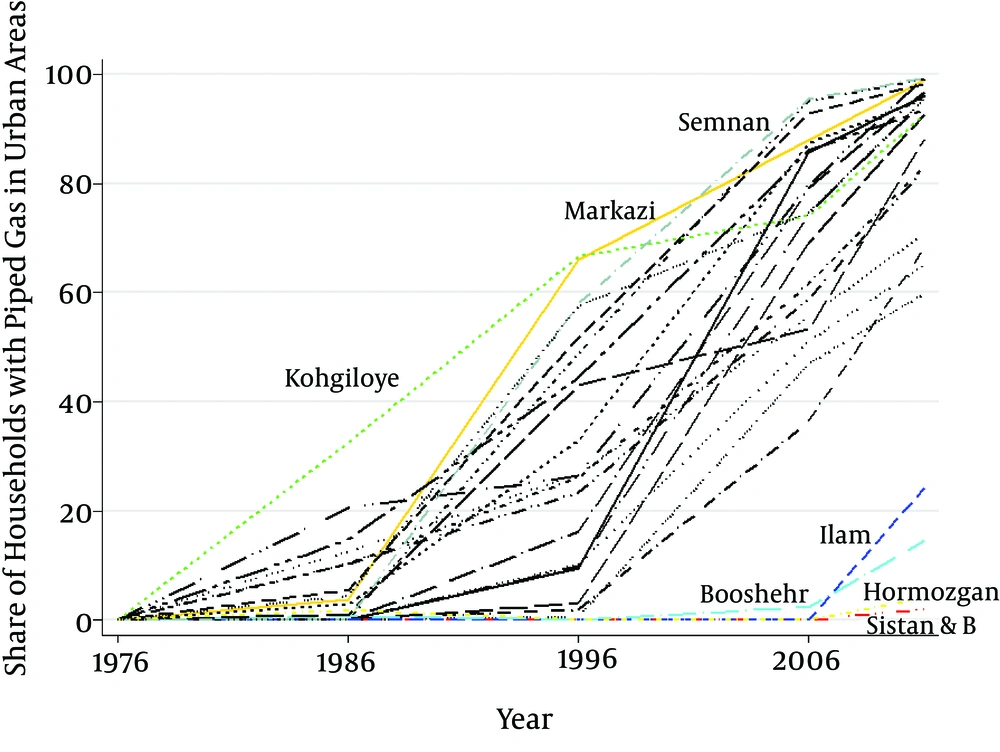
At the provincial level, as Figure 5 indicates, in 11 provinces in 1986, urban areas did not have piped gas, and in 7 provinces, the mean of households that had access was less than 10%. In addition, Kohgiluyeh and Boyer-Ahmad had the highest access with a mean of 32.53%. In 1996, the access rate improved with a steep slope in most of the provinces, and Semnan, Markazi, and Kohgiluyeh and Boyer-Ahmad had the sharpest slope among all provinces and their mean of access reached 57.99%, 66.10%, and 66.64%., respectively. Sistan and Baluchestan, Ilam, and Hormozgan still did not have any access to piped gas by 2006. In 2011, 1.89% and 3.99% of urban areas in Sistan and Baluchestan and Hormozgan received piped gas while 13 provinces had an access rate of higher than 90%.
Concerning the gap between urban and rural area, Kohgiluyeh and Boyer-Ahmad had the greatest gap with 25.29% in 1986. The gap sharply increased in all provinces by 1996. Markazi had the highest fracture with 66.06% in this year. In 2006, Tehran, Semnan, Markazi, Kohgiluyeh and Boyer-Ahmad, and Zanjan had a little decline in the gap; in other provinces, the break increased and Lorestan and Kordestan had the sharpest increase and reached 73.70 and 70.24%, respectively. The gap decreased in most of the provinces by 2011. Just Sistan and Baluchestan, Hormozgan, and Bushehr had a little increase in the fracture in this year.
3.3. Electricity
At the county level, rural areas of Khodabandeh and Meshginshahr counties in Zanjan and East Azerbaijan provinces did not have any electricity in 1976. In addition, in 52% of the counties, less than 10% of the households had electricity and just 6 counties had an access rate of more than 50%. Hamadan displayed the highest access (88%), followed by Semnan, Kashan, Bandar Anzali, Tehran, and Ardekan. In 1986, the access rate ranged from 12% to 99%. The lowest share belonged to Sardasht, a county in West Azerbaijan, followed by Zahedan (17%), a county in Sistan and Baluchestan. All provinces had a pointed development in access to electricity in the census year. In 1996, after the war, in almost 55% of the counties, more than 90% of the households had electricity. Zahedan had still the lowest access with 39% while in Golpayegan, a county in Isfahan, all households had electricity in this year. In 2006, just Zahedan, Khash (counties in Sistan and Baluchestan), and Masjed Soleyman (a county in Khuzestan) had an access rate of 80 - 90%, and access in all other counties was more than 90%. In 2011, only Zahedan had an access rate of lower than 90% that was 85%.
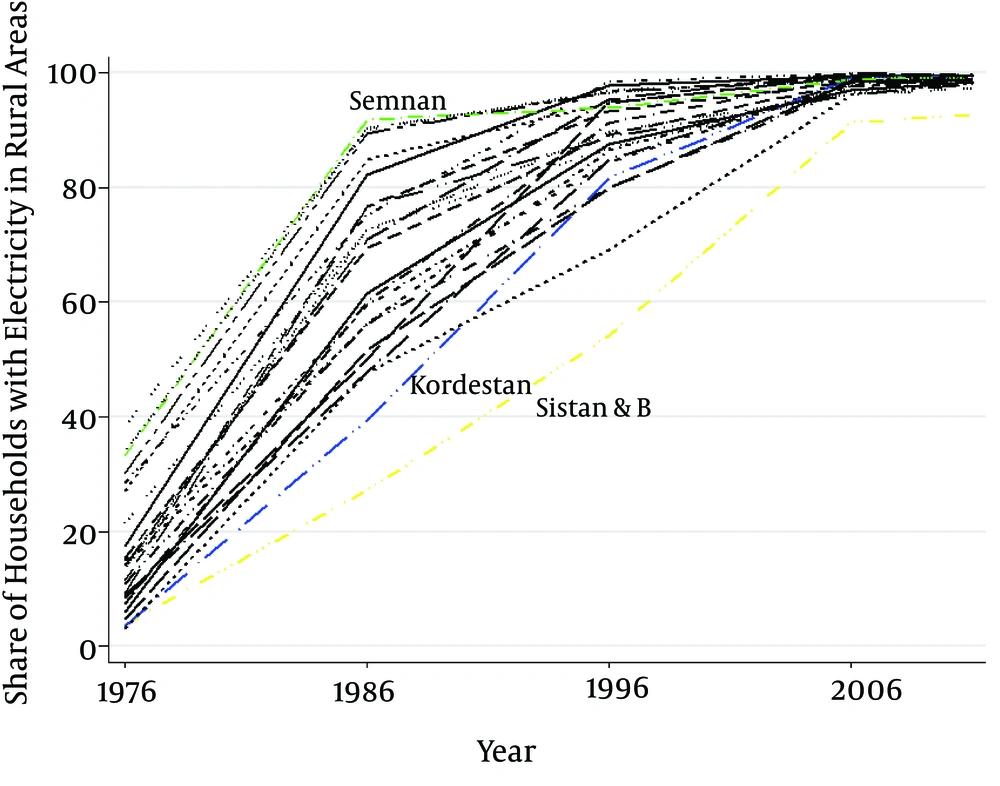
At the provincial level, Kordestan, Sistan and Baluchestan, and West Azerbaijan had the lowest mean of access to electricity with 3.43%, 3.74%, and 4.67%, respectively; while Yazd displayed the highest access with 38.47% followed by Tehran, Semnan, and Isfahan by 1976. In 1986, all provinces experienced a sharp upward trend and more than 90% of rural households in Semnan and Tehran had electricity; however, Sistan and Baluchestan had the worst situation with 27.16%. In 1996, the ascending trend had a mild slope; Hamadan reached the highest access rate with 98.42% and Sistan and Baluchestan reached 54.11%. In 2006 and 2011, in all provinces, more than 90% of the rural households had electricity and the standard deviation had the lowest range (0 - 6%) compared to the previous censuses (Figure 6).
In the urban areas at the county level, the share of households that had electricity ranged from 2% to 79% in 1976. Kohgiluyeh, a county in Kohgiluyeh and Boyer-Ahmad, and Khodabandeh, a county in Zanjan, had the lowest access rate to the electricity with 2% while Tehran displayed the highest with 79%, followed by Ghom and Isfahan. In 1986, all Counties experienced a great improvement so that just four counties had an access rate of lower than 90%. Urban households of Zahedan, Islamabad, Sanandaj, and Mahabad counties in Sistan and Baluchestan, Kermanshah, Kordestan, and West Azerbaijan provinces had the lowest access to the electricity with 83%, 87%, 89%, and 89%, respectively. In 1996, all counties had an access rate of more than 90% and the trend was constant by 2006 and 2011, with a little development.
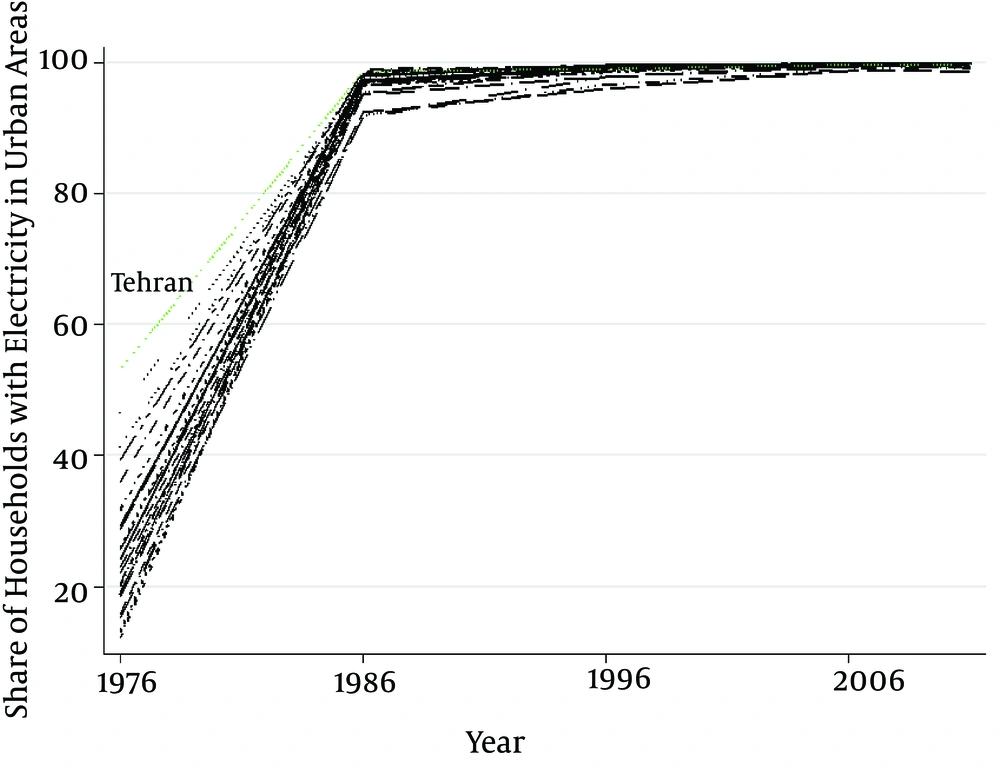
At the provincial level, urban areas of Hormozgan and Kohgiluyeh and Boyer-Ahmad had the lowest mean of electricity with 12.16% and 13.09%, respectively while, on the other hand, Tehran had the highest with 53.05% by 1976. Standard deviation ranged from 0.65 to 28.89% and Tehran had the maximum access in the census year. In 1986, all provinces had a pointed development and their access reached over 90%; at the same time, standard deviation sharply decreased and reached 0.01 - 5.81%. The trend was almost fixed by 1996, 2006, and 2011, with a little progress (Figure 7).
Concerning the gap between urban and rural area, Khuzestan and Lorestan with 25.04% and 23.23% had the highest gap between urban and rural areas by 1976. In 1986, the gap increased in all provinces and ranged from 7.18 to 64.75. Semnan displayed the lowest gap, followed by Tehran, Yazd, and Isfahan while Sistan and Baluchestan had the highest, followed by Kordestan. In 1996, the gap decreased in all provinces and was in the range from 0.96 to 42.55. The greatest gap declined to 7.70% and 6.62% in 2006 and 2011, respectively.
3.4. Bathroom
Having a bathroom had not been asked in the 1976 census. Therefore, we present the results of this section from 1986. In rural areas, at the county level, the share of households that had bathroom ranged from 1% to 86% in 1986. However, in about 45% of the counties, less than 10% of the households had a bathroom. Bandar Bushehr had the highest access to bathroom, followed by Bandar Lengeh, a county in Hormozgan. In 1996, all counties had improvements, their access increased with a mild slop, and the range varied from 4% to 97%. The lowest access belonged to Dargaz, followed by Quchan, Shirvan, Esfarayen, and Bojnord, counties in Khorasan province, while the highest belonged to Abadan located in Khuzestan and Bandar Bushehr. In 2006, access to bathroom developed with a more ascending trend and in almost 83% of the counties, more than 50% of the households had bathrooms. Jiroft, a county in Kerman, had the lowest bathroom with 19%, followed by Dargaz, Quchan, Shirvan, Esfarayen, and Bojnord. In 2011, just the rural areas of Jiroft, Bam, and Zahedan had an access rate of lower than 50% and in 52% of the counties, the access increased to more than 90%.
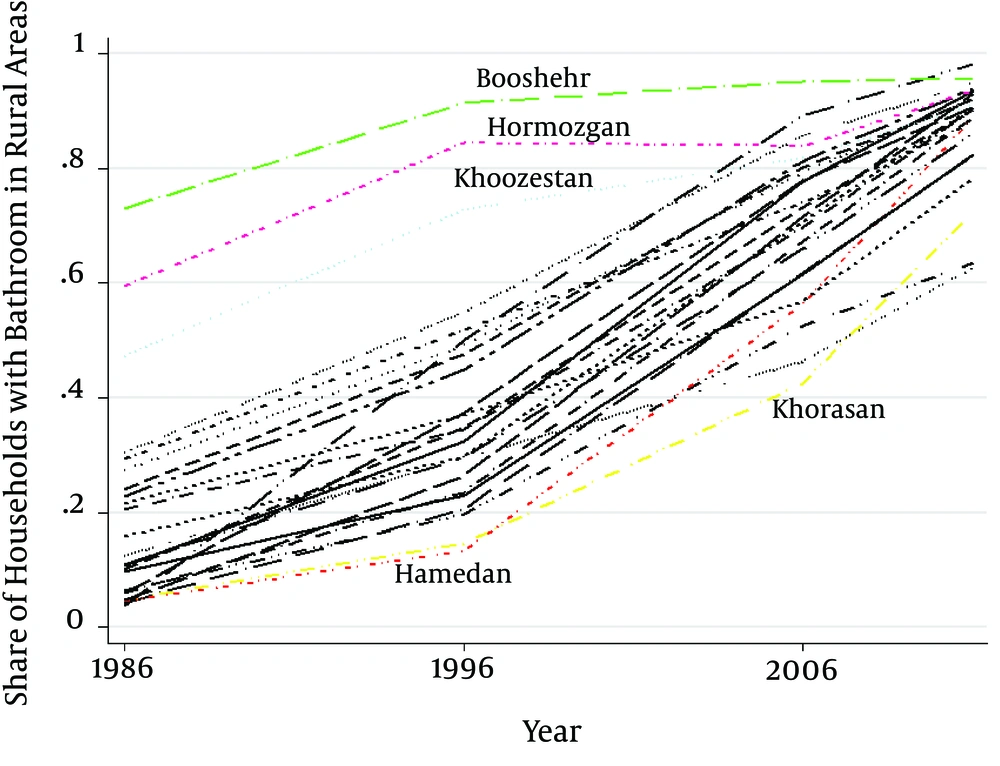
At the provincial level, in 1986, the rural areas of Kordestan had the worst situation with a mean of 3.61%, followed by East Azerbaijan, Hamadan, Zanjan, Khorasan, and Kermanshah while Bushehr had the best condition with 73.04%. In 1996, all provinces had progressed and their access ranged from 13.22% to 91.46%. Hamadan displayed the lowest access to bathroom, followed by Khorasan and Sistan and Baluchestan. Kordestan experienced a sharp ascending trend and the share of rural households that had bathrooms reached 50.3% in the census year. In 2006, just Kerman and Khorasan provinces had an access rate of lower than 50%, with 42.57% and 46.28%, respectively. In 14 provinces, more than 90% of the rural households had bathrooms in 2011. Kerman and Sistan and Baluchestan had the lowest access with 62.53% and 63.51%, respectively (Figure 8).
At the county level in urban areas, the share of households that had a bathroom ranged from 21% to 97% in 1986. The worst situation belonged to Dargaz, followed by Islamabad, Marivan and Bojnord counties in Khorasan, Kermanshah, and Kordestan while the best condition belonged to Dashteazadegan, a county in Khuzestan. In 1996, just the urban areas of Dargaz, Meshginshahr, Moghan, Songhor, Ardebil, and Bojnord counties in Khorasan, East Azerbaijan, and Kermanshah had an access rate of lower than 50% and all counties had developments compared to the previous census. In 2006, in about 67% of the counties, more than 90% of the households had a bathroom and in 2011 just Bam, Jiroft, and Dargaz counties in Kerman and Khorasan had an access rate of lower than 90%.
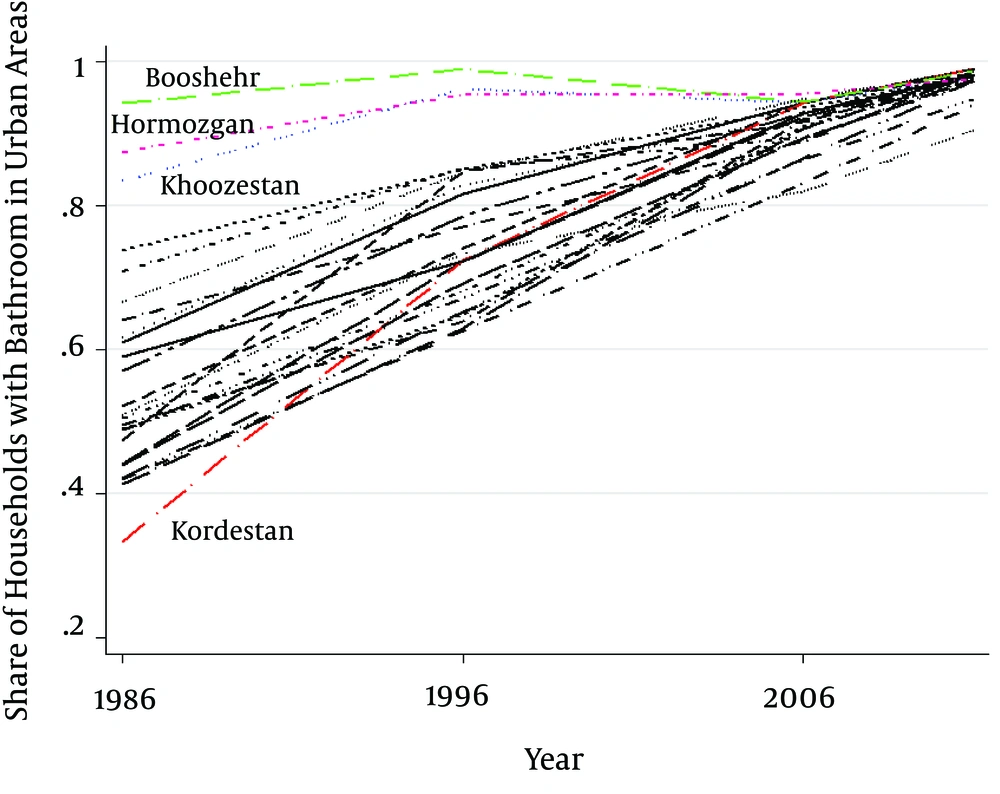
At the provincial level, as Figure 9 indicates, in 1986, the urban areas of Kordestan had the lowest bathroom with 33.32%, followed by East Azerbaijan and Khorasan while the highest share belonged to Bushehr located in the southeast of Iran. In 1996, Ilam and Kordestan showed the fastest development at 84.79% and 72.44% of their households had bathrooms in the census year, respectively. Khorasan, East Azerbaijan and Kermanshah had the worst situation with a mean of 62.60%, 63.04%, and 63.94%, respectively. In 16 provinces, more than 90% of the households had bathrooms by 2006, all provinces experienced more developments, and in all of them, the access rate increased to more than 90%.
Concerning the gap between urban and rural areas, Bushehr province had the lowest gap between urban and rural areas with 21.22% while Kohgiluyeh and Boyer-Ahmad had the greatest gap with 52.28%, followed by Markazi and Lorestan by 1986. In 1996, in Ilam, Hamadan, Sistan and Baluchestan, Kerman, East Azerbaijan, Zanjan, Chaharmahal and Bakhtiari, and Mazandaran, the gap increased between 12% and 1.99% compared to the previous census while it decreased in other provinces. The gap had a downward trend in all provinces except Hormozgan by 2006. Khorasan had the biggest gap with 40.64% in this year. Kordestan had the lowest gap with 0.87%, followed by Bushehr and Tehran while, on the other hand, Sistan and Baluchestan had the greatest gap with 31.36%, followed by Kerman and Khorasan in 2011.
3.5. Health House
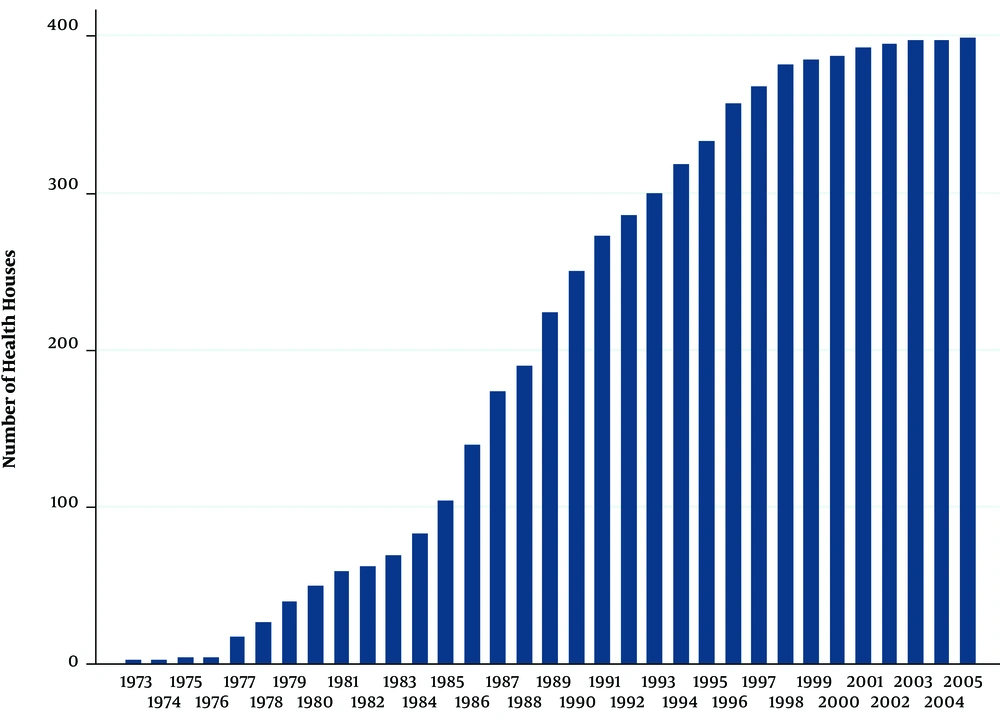
Figure 10 shows the distribution of health houses according to the year of establishment. The construction of health houses started before the revolution in 1973 and the first health house was built in Chonghoranloo, a village in West Azerbaijan province. As the indicates, indicates, the construction of heath houses continued at a low speed in later years. In 1976, the rural areas of Urmia, a county in West Azerbaijan, Shemiranat, a county in Tehran, Khoramabad, a county in Lorestan, and Shiraz, a county in Fars, had the highest number of health houses with 27, 19, 13, and 12, respectively. However, still, most of the Counties did not have any health house in their rural areas. After the revolution, in 1985, the law mandated the establishment of health houses infrastructure and the pace of health houses construction drastically increased. One year after implementing the law, the number of health houses in Kerman, Zabol, and Urmia increased to 116, 100, and 80, respectively. Although few counties such as Marand, Moghan, Piranshahr, Sardasht, Khalkhal (counties in East Azerbaijan and West Azerbaijan), Sarpole Zahab and Ghasreshirin (counties in Kermanshah), Khoramshar (a county in Khuzestan), and Aligudarz (a county in Lorestan) did not have any health house until that time. The ascending trend reached to its peak by 1989 so that just Khalkhal, Ghasreshirin, and Khoramshar did not have health house infrastructure and on the other hand, Kerman had the highest number of health houses with 185. After that, the pace of establishment of health houses decreased but this trend was still upward. By 2006, Khoramabad had the highest number of heath houses, followed by Gonbad-e Kavus and Kerman with 394, 339, and 327, respectively.
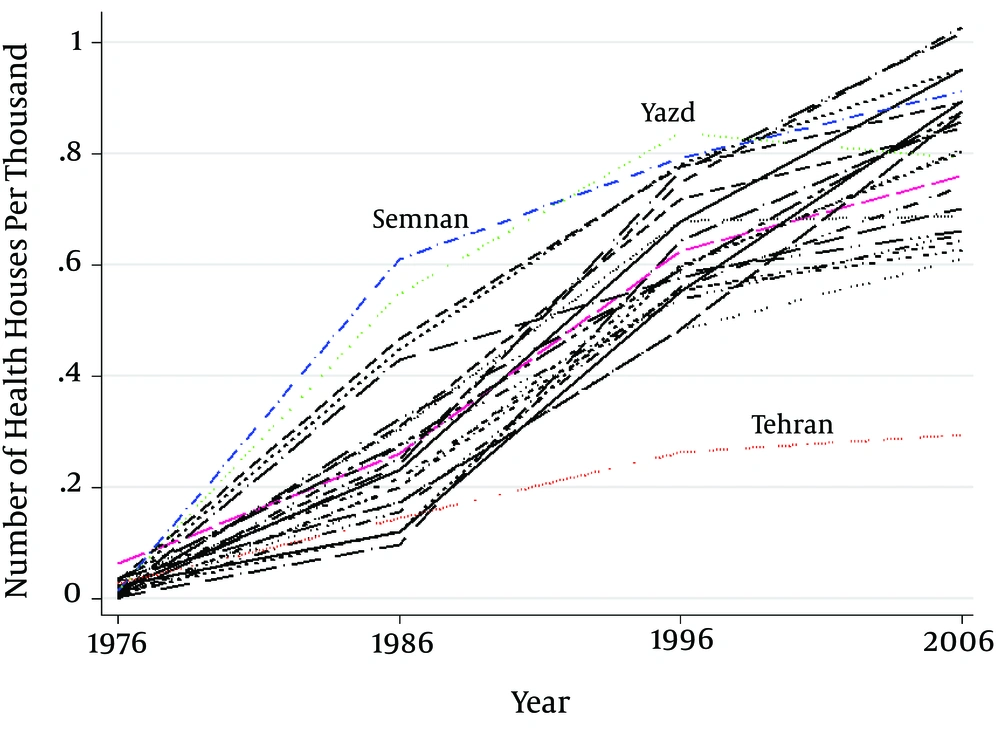
As the number of health houses is not a suitable index for making comparisons between geographical areas, we calculated the number of health houses per thousand of the population at the provincial level. As Figure 11 indicates, the index ranged from 0 to 0.062 in 1976. West Azerbaijan had the highest rate, followed by Isfahan while Sistan and Baluchestan had the lowest rate, followed by East Azerbaijan. In 1986, Semnan and Yazd had the best situation with 0.61 and 0.54 while East Azerbaijan had the worst condition with 0.09. In 1996, the gap between provinces decreased and except Tehran, the range varied from 0.48 to 0.83. Tehran had a little improvement compared to the previous census and reached the index of 0.26. In addition, Khuzestan, Zanjan, and Sistan and Baluchestan were among the worst provinces. In 2006, the gap between the rural areas of Tehran and other provinces increased so that its rate reached 0.29. Khozestan followed by Hormozgan and Fars had the lowest rate after Tehran with 0.60, 0.62, and 0.64, respectively. On the other hand, Kermanshah followed by Kordestan had the highest rate with 1.02 and 1.01, respectively (Figure 11).
4. Discussion
In this paper, we examined the situation of infrastructure variables from before the revolution until 2011 in Iran. Infrastructure development would contribute to the improved access to healthcare facilities and schools, increased investment, eliminated inequities, and decrease gender inequities (16-18).
The results showed that piped water had an ascending trend during all the census years in rural areas, but the line slop was more increasing between 1986 and 1996. The time coincided with the activities of crusade organization in rural areas, which contributed to expanding piped water over the rural areas of the country. We found that the standard deviation of provinces with the best situation was high in 1976 but over the time, it decreased and reached the lowest amount among all provinces. On the other hand, the standard deviation of provinces with the worst situation increased over the time and reached to the highest amount. Indeed in provinces that had a good condition at the beginning, the development was in line with decreased inequities between their counties and in provinces that had a bad condition at the beginning, the overall situation improved but the inequity between their counties increased and the development was not balanced.
We found that in the 1986 census, the year of Iran-Iraq war, the rate of access to piped water decreased sharply compared to the previous census in urban areas. Some counties of Kermanshah and Kordestan provinces had the greatest decline; these counties were involved in the war directly and had common borders with Iraq. In addition, the two provinces had a higher standard deviation in this census year because infrastructures in the counties that were involved in the war were destroyed and the gap with others that had a better situation increased. After the revolution, the reconstruction of war-torn began so that the access rate to piped water dramatically increased in all provinces by 1996. The trend was ascending; however, its speed decreased after that.
The results showed the gap between rural and urban areas for piped water access decreased over time but the decline was very sharp in 1986. Indeed, because of the war, the rate of access to piped water decreased in urban areas, especially areas involved in the war directly while on the other hand, the access to piped water improved in rural areas because these areas were not involved in the war directly and crusade organization had activities for developing piped water access. Therefore, the gap decreased dramatically. After this period, the gap decreased with a lower speed but in Kermanshah, it increased greatly because of the reconstruction of its urban areas after the war.
Studies show access to piped water for the rural population is much more restricted than for urban population (19). In addition, according to the report of WHO, the global access to piped water in rural areas was 29% and in urban areas was 80% by 2011 (20). Therefore, the situation of Iran was better than the global rate, especially in rural areas in this year.
We found that rural areas did not have a significant progress in access to piped gas until 1996 census and Khuzestan and Kohgiloyeh and Boyerahmad had the best situation in this period. The two provinces are the major oil and gas-producing regions of Iran and probably because of this issue, some of their rural areas accessed to piped gas. The speed of expanding piped gas was very slow and in some cases, it inversed between 1986 and 1996 that can be the result of allocating resources to other programs during the war and no partnership of Jihad-e Sazandegi in developing piped gas in rural areas. Although the speed of expanding piped gas sharply increased between the 1996 and 2006 census, still rural areas of some border provinces such as Ilam, Sistan and Baluchestan, and Hormozgan did not have any piped gas and the situation of the two last provinces was without change until 2011. Studies show that in many rural areas around the world, people still are dependent on wood and other biomass fuels for their household and managing traditional fuels is the responsibility of women. Therefore, this is an important factor in women’s disproportionate lack of access to education and income, and inability to run away from poverty (21).
We found the access rate to piped gas improved between 1986 and 1996 and the line slop increased dramatically after that in most urban areas, but unfortunately, like rural areas, urban areas of Ilam, Sistan and Baluchestan, and Hormozgan did not have progress in the access to piped gas and just after 2006, the situation of Ilam improved slightly.
We found the gap between urban and rural areas increased between 1986 and 1996. This is because of no improvement in the situation of rural areas on the one hand, and the progress in the conditions of urban areas, on the other hand. In addition, the gap increased between 1996 and 2006 because of a faster improvement in urban areas; however, in provinces like Tehran, Semnan, Markazi, Kohgiluyeh and Boyer-Ahmad, and Zanjan, the gap decreased because of a good progress in rural areas. After that, in 2011, the gap in most provinces declined.
The results showed that rural and urban areas experienced a sharp development in the access to electricity between the 1976 and 1986 census. Jihad-e Sazandegi had major activities for the expansion of electricity in rural areas in this period and on the other hand, the electricity developed in urban areas with a high speed; however, in some urban areas that were involved in the war directly, the rate of progress was slow. Indeed, although Iran’s oil export dropped because of air strikes in the war period and as a result, the income of Iran decreased, volunteer activates led to the development of access to the electricity. Afterward, the speed of expansion decreased between 1986 and 1996 in urban and rural areas, but this slowdown was lower in rural areas. In 2011, the rate of access in rural and urban areas was much closer together.
We found that the gap between urban and rural areas increased during 1976 - 1986. Indeed, although access to the electricity in both urban and rural areas developed dramatically, the rate of progress was more in urban areas; therefore, their gap increased. Then, the gap decreased between 1986 and 1996. Although the speed of improvement declined in both urban and rural areas in this period, it was lower in rural areas. Thus, their gap decreased and reached to less than 7% in 2011.
We found that Kordestan had the worst situation in access to a bathroom in urban and rural areas by 1986. One of its reasons may be that the province was involved in the war and another reason is its deprivation. After the revolution, probably because of the reconstruction of war-torn areas, its situation improved and access to bathroom sharply increased. An interesting point is that Khozestan province that was involved in the war had a high access rate to bathrooms in 1986. Probably it is the result of locating in the main oil-producing region. In addition, the condition of Bushehr was good, which is one of the two main petroleum-exporting seaports of Iran. Overall, all urban and rural areas had improvements in access to the bathroom over time. However, we found that the gap between urban and rural areas in some areas increased between 1986 and 1996; it was due to a higher speed progress in urban areas in these regions. Afterward, the gap sharply decreased in most areas until 2011.
Generally, the results showed the provinces that are at the central part of the country had a better situation in terms of the investigated variables and provinces at the borders like Sistan and Baluchestan had the worst situation. Our finding is in line with previous development studies in Iran (22).
We found that the construction of health houses started before the revolution but it had a very slow speed. During the war, in 1985, the law mandated the establishment of health houses infrastructure. However, in this period, Iran was involved in the war and most of its income was allocated to this issue, but motivated actors performed it despite the problems (23) and the trend reached its peak in 1989. The results showed that some counties that were involved in the war directly did not have health houses in that period, but after the war, they had a good progress. The remarkable thing is that the rural areas of Tehran, the capital of Iran, had a great distance from other provinces in terms of the number of health houses per thousand of the population. Although the gap between provinces decreased over time, Tehran had a very slow progress and its distance from other provinces increased sharply. This needs further investigation to determine its cause.
The research is the first study to investigate the health infrastructure status of Iran during a period of more than three decades. In addition, it compares the situation between rural and urban areas at the county level and this is a unique feature of the study. However, our research had a limitation because we could not have access to data before the 1976 year. Therefore, we could not study the trends before the year to compare with the later years.
4.1. Conclusion
Based on our finding, although Iran was involved in a war with Iraq between 1980 and 1988, it had a great development in the infrastructure variables like piped water, electricity (except in urban areas) and health houses, especially in rural areas. Indeed, in that period, simultaneously several voluntary organization began their activities in rural areas; therefore, the sharp progress could be due to these activities. In addition, results showed the decreased gap between urban and rural areas until 2011; however, inequity between provinces still is high and indicators have a weak situation in border provinces. Therefore, we suggest policymakers paying more attention to inequity between provinces, especially in the borders, and make some policies to improve their situation.
