1. Background
Due to the durability and versatility of plastics, they are widely used for various purposes, making our lives easier by providing convenient and economical options (1). In 2018, approximately 368 million tons of plastic were produced worldwide, and it is estimated that global plastic production will increase to 1.1 billion tons by 2050 (2, 3). Despite the benefits of plastics, there are also drawbacks, as microplastics (MPs) are released into the environment, raising concerns about their use. Microplastics are synthetic plastic particles between 1 and 5000 µm in size (4). They have been detected everywhere in the environment, including in animals and the human body (5). Studies estimate that about 51 trillion MPs are present in the ocean, which is approximately 500 times more than the number of stars in the galaxy (6). There is substantial evidence that MPs are harmful to aquatic organisms and humans (7). They can absorb and transmit microbial and chemical contaminants, posing risks to consumers (3, 8). Microplastics can be easily ingested by terrestrial and aquatic animals as well as humans, passing through the gastrointestinal tract and raising concerns about their potential toxicity (1, 9). Microplastics can cause blockage and perforation of the digestive tract, malnutrition, and even death (10). The toxicity of MPs depends on several factors, including size, polymer type, morphology, chemical additives, volume, and density (11). Size is particularly important in determining the toxicity of MPs (12) exposed the copepod Paracyclopina nana to MPs of different sizes and found that only smaller particles had negative effects. Microplastics smaller than 150 μm can enter the intestine, and those smaller than 50 μm can even reach the spleen and liver (1). Zhu et al. analyzed human placentas for MPs and found 2.70 ± 2.65 MPs per gram of placenta (13). Dalmau-Soler et al. investigated the presence of MPs in a water supply network and detected MPs in 38 samples, with a concentration of 0.01 MP/L (14).
Drinking healthy water is essential for human health as it helps maintain a balance of calories and nutrients in the diet, ensures adequate hydration, and supports bodily functions. Researchers have studied both tap and bottled water worldwide to examine MPs contamination (15). A key question in studies on MPs is the extent of their presence in the environment and the level of human exposure. Although numerous studies provide evidence of human exposure to MPs, the extent, variability, and lifetime accumulation of this exposure are not well understood. Exposure to MPs can occur through various pathways, including food, water, beverages, and air (9, 16).
2. Objectives
The aim of this study was to investigate the presence of MPs in tap water from a drinking water distribution system in Iran and to determine the exposure to MPs from consuming tap water.
3. Methods
The steps for MP measurement, including sampling, filtration, digestion, and qualitative and quantitative analyses, are described below.
3.1. Sampling
In this study, the concentration of MPs in a drinking water distribution system in Isfahan, Iran, was investigated. The water from this distribution system is supplied by the Baba Sheikh Ali Drinking Water Treatment Plant, which treats water from a reservoir behind the Cham Aseman Dam. This treatment plant is the largest drinking water facility in Iran, supplying water to 57 towns and more than 300 villages. It is located about 8 km downstream of the Cham Aseman Dam and 55 km from the Shahrekord-Isfahan road. The water transmission pipes are made of concrete and generally have a diameter of 1400 mm (17, 18).
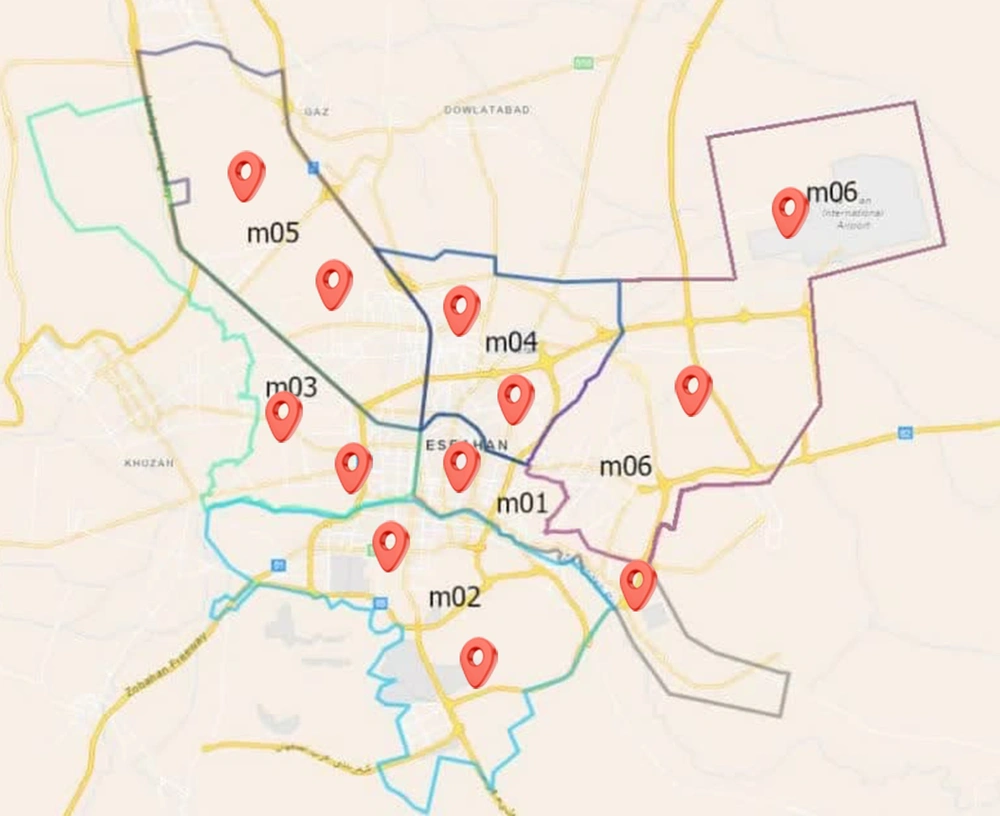
Sampling of this distribution system was conducted using grab sampling, randomly selecting 12 locations in October, January, and February 2020, in the city of Isfahan. Before each sample was taken, the tap water was allowed to run for 10 minutes, and then two liters of water were collected and brought to the laboratory in amber glass containers (19). The locations of the sampling points are shown in Figure 1.
3.2. Filtration and Digestion
It is important to note that there is currently no standardized method for measuring MPs (20). Filtration and digestion were performed using the WPO method according to the studies by Wang et al. and Mintenig et al. (21, 22). Samples were filtered using cellulose nitrate filters (Sartorius, 47 mm, 0.45 µm), and the filters were rinsed with distilled water into clean beakers. Subsequently, 30 ml of 35% H₂O₂ (Dr. Mojallali, Iran) was added to each beaker. The beakers were then placed in a 40°C oven for 24 hours. For quantitative analyses, one set of samples was filtered with PTFE-L filters (FILTERBIO, 47 mm, 0.45 µm), and for qualitative analyses, another set of samples was filtered using fiberglass filters (Whatman, 125 mm, 0.6 µm) (23-26). The filters were then dried at 25°C.
3.3. Qualitative and Quantitative Analyses
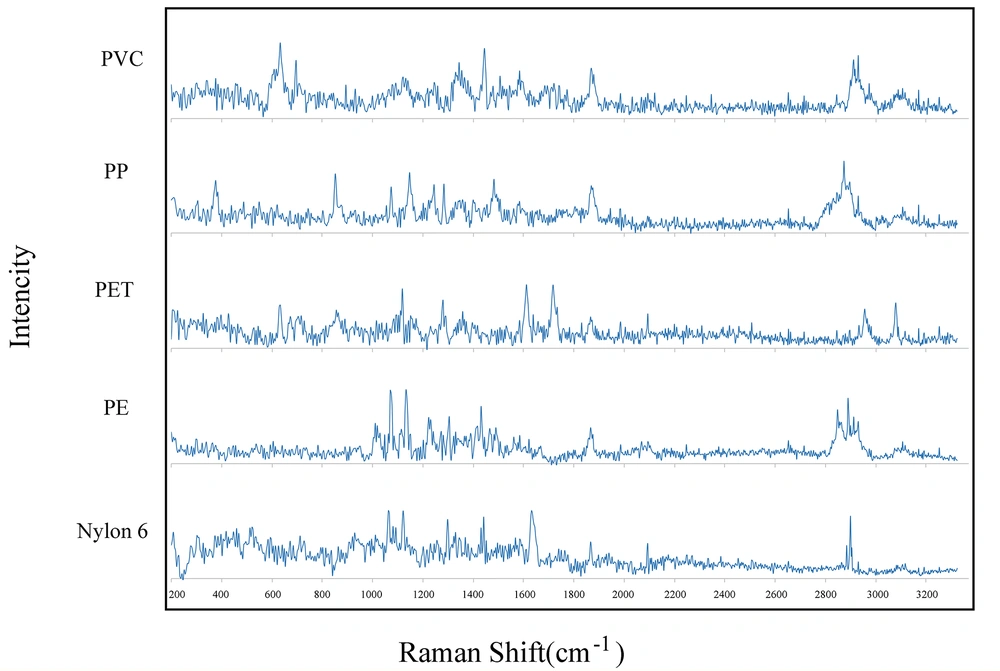
Qualitative analyses were conducted using a UniRAM Raman spectrometer (South Korea), equipped with a laser having an excitation wavelength of 785 nm and a power output of 200 mW (27, 28). Two filter samples were fixed on a gold-coated glass holder, and two spectra were recorded. Baseline correction of the spectra was performed using Origin Pro software (2019 version), and the polymer types were identified by comparing the spectra with reference spectra (4).
For quantitative analyses, four pieces of each PTFE-L filter (approximately 8 × 5 mm) were analyzed. A layer of conductive gold was sputtered onto the filters, and then the MPs on the filters were counted and photographed using a scanning electron microscope (SEM) (Netherlands, Philips XL30) (29). The MPs were classified based on their shape (fragments, fibers, oval, and spherical) and size distribution (< 10 µm, 10 - 50 µm, 50 - 100 µm, and > 100 µm). Precise measurements of the size of each PTFE-L filter were obtained using SEM. Subsequently, the abundance of MPs in each PTFE-L filter was determined by comparing the area of each filter piece with the area of the entire filter.
3.4. QA/QC
The concentration of MPs was adjusted based on blank sample corrections and qualitative analyses. All analytical and sampling equipment used were made of glass. Additionally, all equipment was washed with acid, covered with aluminum foil, and rinsed three times with distilled water. All tests were conducted under a laminar flow hood, with windows and doors kept closed to minimize air movement in the laboratory (4, 8).
3.5. Statistical Analyses
Statistical analyses were conducted using SPSS software (version 26), with statistical significance set at a P-value < 0.05. Quantitative variables with a normal distribution were presented as mean and standard deviation, while those with a non-normal distribution were reported as median and interquartile range. The descriptive report for qualitative variables was expressed in numbers and percentages. The average daily intake of MPs was calculated by multiplying the concentration of MPs in drinking water by the per capita consumption of drinking water.
4. Results
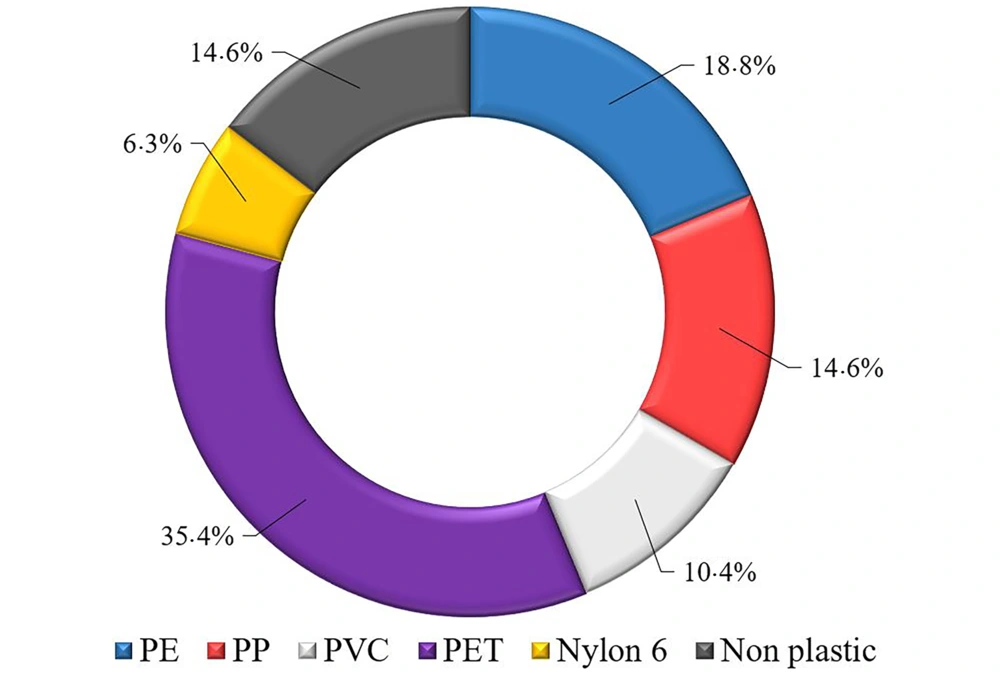
In this study, 48 spectra were recorded using micro-Raman and compared with reference spectra to identify polymer types. A total of 14.5% of the particles identified as non-polymers were excluded from the MPs concentrates. Polyethylene terephthalate, polyethylene, and polypropylene were the most frequently identified polymers. The percentage distribution of polymers identified by micro-Raman is shown in Figure 2, and the micro-Raman spectra of the samples are shown in Figure 3.
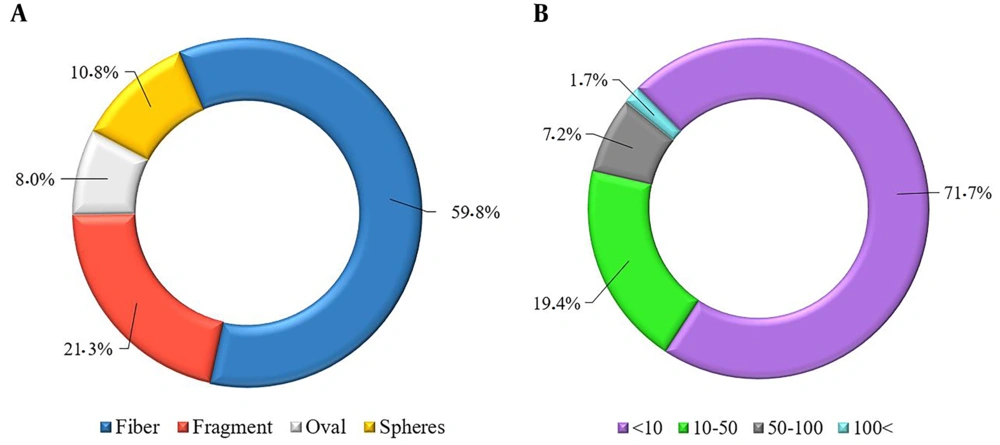
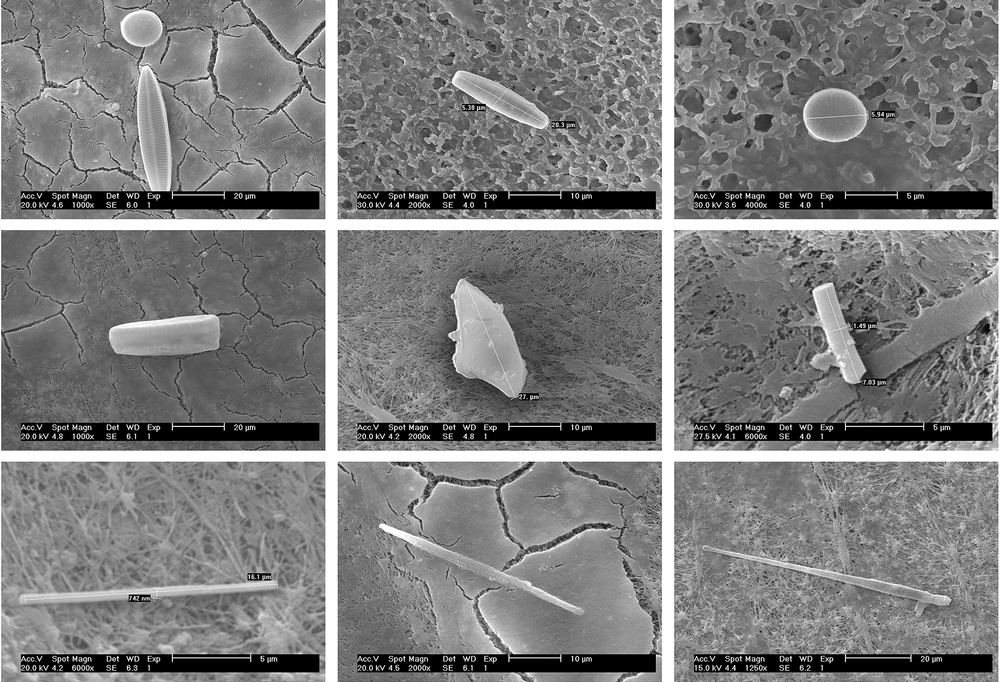
The concentration of MPs in this study was 287.0 ± 65.9 MPs/L. Microplastics smaller than 10 μm were the most dominant, accounting for 71.7%. Following this, 10 - 50μm MPs made up approximately 19.4%, 50 - 100 μm MPs about 7.2%, and MPs larger than 100 μm around 1.7%. The shape and size distribution of MPs are illustrated in Figure 4, and the SEM image is presented in Figure 5. The predominant shape of MPs in this study was fiber, constituting about 59.8%. Other shapes identified were fragments (approximately 21.3%), spheres (around 10.8%), and ovals (about 8.0%).
The average daily water intake in Iran through drinking and cooking is 7 - 15 liters (Table 1). Given that the mean concentration of MPs in tap water was 287.0 ± 65.9 MPs/L (Table 2), and considering that Iranians consume 7 - 15 liters of water per day, it is estimated that they are exposed to 2,009 - 43,051 MPs per day (Table 3). Overall, it is estimated that people could be exposed to approximately 730,000 - 15,700,000 MPs annually from drinking water alone.
| Consumption Route | Min - Max | Unit |
|---|---|---|
| Drinking | 2 - 5 | L/day |
| Cooking | 5 - 10 | L/day |
| Sum | 7 - 15 | L/day |
Daily Water Consumption in Iran (Based on Iranian Ministry of Energy, Water Resources Management Company Information, 100% of the People in this City Use tap Water)
| Samples | Total | Unit |
|---|---|---|
| 1 | 297.6 | MPs/L |
| 2 | 296.1 | MPs/L |
| 3 | 246.6 | MPs/L |
| 4 | 320.4 | MPs/L |
| 5 | 405.3 | MPs/L |
| 6 | 139.9 | MPs/L |
| 7 | 216.8 | MPs/L |
| 8 | 327.6 | MPs/L |
| 9 | 294.6 | MPs/L |
| 10 | 346.3 | MPs/L |
| 11 | 316.0 | MPs/L |
| 12 | 237.1 | MPs/L |
| Mean ± SD | 287.0 ± 65.9 | MPs/L |
The Concentration of Microplastics in an Urban Water Supply Network from Iran
| Exposure Route | Exposure Rate | Unit |
|---|---|---|
| Min- Max | MPs/day | |
| Drinking | 574.02 - 1435.05 | MPs/day |
| Cooking | 1435.05 - 2870.1 | MPs/day |
| Sum | 2009.07 - 43051.5 | MPs/day |
Daily Exposure to Microplastics Through Drinking and Cooking Water
5. Discussion
As mentioned above, 14.5% of the particles identified as non-plastics were excluded from the MP concentration. In other studies related to drinking water, around 20 types of MPs were identified (30), of which 5 types were identified in the present study. PET, PE, PP, PVC, and nylon 6 were the most frequently identified polymers. The types of MPs identified in this study align with the findings of Wang et al. and Sarkar et al. (21, 31), likely due to the high production and persistence of these polymers (32). The most produced plastics globally are PE, PP, and PVC, followed by PET, PUR, and PS (33).
The dominant shapes of MPs in this study were fiber, fragment, sphere, and oval, respectively. This strongly corresponds with the study by Shen et al. (34), in which fragments and fibers constituted the majority (> 70%). In this study, MPs < 10 μm were the most prevalent (71.7%), which aligns with the results of Pivokonsky et al. (35). Spheres and oval particles are likely primary MPs produced for specific products and applications, whereas fibers and fragments are secondary MPs produced by the breakdown of larger plastics (36).
As noted in the results section, the MPs concentration in this study was 287.0 ± 65.9 MPs/L. The concentrations of MPs in other drinking water studies are shown in Table 4. As evident from the table, MPs concentrations in drinking water varied from 7 × 10 -4 MPs/L in the study by Mintenig et al. (22) to 6292 ± 10521 MPs/L in the study by Ossmann et al. (37). The MPs concentration in the urban water supply network in this study was much higher than that found in bottled water from Iran. Makhdoumi et al. reported that the average number of MPs in Iranian bottled mineral water was around 8.5 ± 10.2 particles/L (25). This contrasts with the findings of Gambino et al. (38), where the MPs concentration in mineral water was higher than in tap water, which they attributed to the removal of MPs in drinking water treatment plants. They recommended drinking tap water instead of mineral water, which, based on this study, may not be the best advice.
| References | Method | Water Origin | Concentration (MPs/L) | Study Location | ||||
|---|---|---|---|---|---|---|---|---|
| Density Separation | Digestion | Detection | The Filter Pore Size (µm) | Counting | ||||
| Schymanski et al. (2018) (39) | - | - | Micro-Raman | 0.22 | Optical microscope | Bottled water | 11 ± 8 - 118 ± 88 | Germany |
| Osmann et al. (2018) (37) | - | SDS & EDTA | Micro-Raman | 0.4 | Optical microscope | Bottled water | 2649 ± 2857 - 6292 ± 10521 | Germany |
| Pivokonsky et al. (2018) (40) | - | - | Micro-FTIR & micro-Raman | 0.2 | SEM | Surface water | 443 ± 10 | Czech Republic |
| 338 ± 76 | ||||||||
| 628 ± 28 | ||||||||
| Mintenig et al. (2019) (22) | - | - | FPA-based FTIR-imaging | 0.2 | Stereo microscope | Ground water | 7 × 10⁻⁴ | Germany |
| Zhang et al. (2019) (19) | NaCl | - | ATR-FTIR | 0.45 | Stereo microscope | Surface water | 0.3-1.6 | China |
| Wang et al. (2019) (21) | - | WPO | Micro-Raman | 0.2 | SEM | Surface water | 930 ± 71 | China |
| Shruti et al. (2020) (41) | ZnCl2 | WPO | Micro-Raman & SEM-EDX | 0.22 | Fluorescent microscope | Surface water | 5 ± 2 - 91 ± 14 | Mexico |
| Pivokonsky et al. (2020) (35) | - | - | Micro-Raman | 0.2 | SEM | Surface water | 14 ± 1 | Czech Republic |
| 151 ± 4 | ||||||||
| Tong et al. (2020) (42) | - | WPO | Micro-Raman | 0.2 | Fluorescent microscope | Non-data | 440 ± 275 | China |
| Makhdoumi et al. (2020) (25) | - | - | Micro-FTIR & micro-Raman | 1.1 | Stereo microscope | Bottled water | 8.5 ± 10.2 | Iran |
| Sarkar et al. (2021) (31) | ZnCl2 | WPO | ATR FTIR | 25 | Optical microscope | Surface water | 2.75 | India |
| Present study | - | WPO | Micro-Raman | 0.45 | SEM | 287.0 ± 65.9 | Iran | |
The Concentration of Microplastics in Drinking Water Studies and the Methods of Measurement a
It is important to note that the average daily water intake can be accounted for differently across studies, leading to varying results. For example, in the study by Yadav et al., the average daily drinking water intake was assumed to be 3 liters (5). As previously mentioned, it is estimated that people are exposed to 2009 - 43051 MPs per day. In the study by Yadav et al., the average daily exposure was estimated at 382 ± 205 MPs from drinking water (5). Cox et al. (16) estimated the annual exposure to MPs to be 74,000 - 121,000 MPs per person, but our findings suggest that this number could be significantly higher. Based on our results, we estimate that individuals are exposed to approximately 7 × 10⁵ - 16 × 106 MPs annually through drinking water alone. Air, food, and beverages are additional direct routes through which people may be exposed to MPs and should be examined to assess the overall exposure level.
One of the limitations of MP studies is the lack of a standardized method for measuring MPs. The results regarding MP concentration and exposure are of limited reliability due to the different analytical methods used across studies, making them difficult to compare (36).
5.1. Conclusions
This research investigated the presence of MPs in the urban water supply network of one of the central cities in Iran, focusing on the exposure of MPs through drinking water. The concentration of MPs in the drinking water was found to be 287.0 ± 65.9 MPs/L. Polyethylene terephthalate, polyethylene, and polypropylene were the predominant polymers identified. Fibers were the most common shape, and MPs with a size ≤ 10 µm were the most frequently detected. Considering that the Iranian population consumes 7 - 15 liters of water daily for drinking and cooking, it is estimated that the average daily intake of MPs through drinking water ranges from 2009 to 43,051 particles, exposing individuals to approximately 730,000 to 15,700,000 MPs annually through drinking water alone.
