


1. Background
Due to human activities, especially in the industrial section, various chemical compounds may find their way in the environment, including water, soil, and air. Phenol is one of these highly toxic chemical compounds, which can be found in industrial wastewater, such as chemical, pharmaceutical, and petrochemical effluents (1, 2). This aromatic compound is commonly used in chemical industries in production of resins, plastics, fibers, and detergents (3). High concentrations of phenol can be lethal through inhalation, contact, ingestion, etc.
In the recent years, due to concerns arising from environmental pollution and water shortage, wastewater treatment and reuse is considered as an important issue. Wastewater treatment operations are carried out through physical, chemical, and/or biological processes to meet the current standards for discharge of effluent to the environment. There are various methods for phenol removal from aqueous solutions, such as Fenton-based technologies (3), ozonation (4), coagulation (5), biological processes (6), adsorption (7), electro-oxidation (8), and electrocoagulation (9).
One of the most commonly used techniques for phenol removal is adsorption. Cost-effectiveness, ease of operation, and lack of sensitivity to toxic substances are some advantages, which make this technique more efficient (10). Adsorption is a process, in which pollutant molecules are transferred from the liquid phase to a solid surface. Activated carbon is a traditional adsorbent, which has been widely used for removal of various pollutants (10). This material, however, has been accompanied by drawbacks, such as limited selectivity and low modification flexibility (11). As a result, a trend has been raised towards new adsorbents with fewer limitations. Aerogel is called “frozen smoke” due to its lightness. Aerogels were first synthesized in the 1930’s. Silica aerogel is one of the most common forms of aerogels, which contains small pores, such as micropores and mesopores, which result in a large specific surface area responsible for adsorption. Thus, Silica aerogel is a suitable candidate to substitute the traditional adsorbents, thanks to its high specific area (500 to 1000 m2/g), high porosity (up to 99%), and high modification capability (12-14). Up to now, this adsorbent has been widely applied to remove various toxic compounds, such as heavy metals (14), Benzene, Toluene, Ethylbenzene, and Xylenes (BTEX) compounds (15), dyes (11), and so on. As far as the authors are aware, however, there is a limited knowledge about the adsorptive behavior of silica aerogel for phenol removal under various conditions of operation. In a study conducted by Qin et al. (12), for example, silica aerogel with different extents of hydrophobicity was prepared and utilized to remove phenol while they focused only on kinetic/isotherm studies and ignored the effect of operational parameters on phenol adsorption.
2. Objectives
The aim of the present study, thereby, was to synthesize, characterize, and utilize silica aerogel for phenol adsorption by determining the effect of the most important operational parameters, including contact time, solution pH, phenol concentration, and adsorbent dose. The kinetics and isotherms of adsorption were also investigated.
3. Methods
All the chemicals used in this study were purchased from Merck. Phenol (C6H5OH, 99% purity) was used to prepare test solutions. NaOH or H2SO4 solutions (1N) were applied to adjust pH during the experiments using a pH meter (Sartorius, model PP-50). Sodium silicate (Na2SiO3, 99.5% purity) was used for preparation of sol-gel. Distilled water was prepared by a water distiller (Fater Electronic Water Distiller, model 2104, Iran).
3.1. Adsorbent Preparation
Silica aerogel preparation was carried out by the sol-gel process (13, 16-18). At first, the original sol was produced by preparing a saturated solution of Na2SiO3. Insoluble sediments and residues were separated from the solution by filtration. Then, 50 mL of 12N HCl was added to the saturated solution gradually, during one hour. The solution remained stable for 24 hours under acidic conditions. During this period, sodium silicate turned to sol-gel through polymerization. The obtained gel was slowly separated from the solvent by filtration. The separated gel was placed in ethanol for two hours at 50 °C. This treatment was repeated several times with fresh ethanol to ensure the replacement of accumulated water in gel sites. To prevent drying and folding after cooling, the wet gel was placed under high pressure and temperature (245 ºC and 12.50 MPa) to reach the supercritical temperature point of the solvent. Finally, the pressure was dropped to evacuate the solvents completely from the gel sites.
3.2. Adsorbent Characterization
Morphological and structural patterns of the adsorbent were examined using Scanning Electron Microscope (SEM, Philips model XL-C) and X-Ray Diffraction (XRD, Philips model X PER MPD) analyzer, respectively. Surface functional groups of silica aerogel were determined through Fourier Transform Infrared (FT-IR) spectroscopy (Perkin Elmer Spectrum 1600) in the range of 400 to 4000 cm-1. Nuclear Magnetic Resonance (NMR) spectroscopy analyzer (Avance 200 MHZ) was used to determine the molecular structure of the prepared aerogel. The zero-point charge pH (pHzpc) of adsorbent was determined according to Dastgheib et al. (19). Briefly, 0.5 g of silica aerogel was added to 30 mL of 0.1 M NaCl solutions. The pH of saline solutions were previously adjusted between two and twelve. After 48 hours of agitation at 120 rpm, the values of final pH of filtered solutions were measured and plotted against initial pH values to determine the pHzpc.
3.3. Adsorption Experiments
For all the batch experiments, glassware and bottles were washed and rinsed with HNO3 and then by distilled water before usage. Adsorption experiments were performed in a batch reactor to determine the effect of contact time (5 to 180 minutes), solution pH (3 to 12), initial phenol concentration (20 to 500 mg L-1), and adsorbent dose (0.4 to 8.0 g L-1) on the adsorption process. The volume of sample solutions was 250 mL and the speed of stirring was kept at 200 rpm. All the experiments were performed at room temperature (20 ± 1ºC), according to one factor at a time design. At the end of each experiment, the solid phase was separated from the solution by centrifugation (Sigma®-301 centrifuge apparatus) at 5000 rpm for five minutes. The kinetic study was conducted by using data obtained in contact time experiments within 180 minutes at initial phenol concentration of 50 and 100 mg L-1. The pseudo-first order and pseudo-second order kinetic models were employed to evaluate the experimental data.
3.4. Adsorption Isotherms
The isotherm study was carried out using the equilibrium data that were obtained by varying phenol concentrations (20 to 500 mg L-1). In this study, twelve isotherm models were employed to investigate the equilibrium adsorption of phenol onto silica aerogel. These isotherm models are summarized in Table 1. In all the equations, qe (mg g-1) denotes the loaded amount of adsorbate onto the adsorbent at equilibrium and Ce (mg L-1) represents the equilibrium concentration of adsorbate in the solution. In every equation, both qe and Ce are known from the experiments while the other parameters are revealed from the experimental data fitting the relevant equation. The fitting of data to the non-linear expression of isotherm models was carried out using the OrigingPro9 software®. In order to discover the best model, four error functions were utilized, including adjusted coefficient of determination (Adj. R2), sum of squared errors (SSE), nonlinear chi-square (χ2), and Akaike Information Criterion (AIC). The Adj. R2 values close to one along with SSE and χ2 values close to zero indicate a better description of experimental data by the model. The AIC is used for final judgment between the models. A model with lower AIC value, compared to the value of other models, is a more adequate model for experimental data description (20).
| Model | Non-linear expression | Parameters | References |
|---|---|---|---|
| Langmuir | b = Langmuir isotherm constant (L mg-1), qm=maximum monolayer coverage capacities (mg g-1) | (21) | |
| Freundlich | Kf = Freundlich isotherm constant (mg g-1) (L g-1)1/n, related to adsorption capacity, n = Freundlich isotherm constant related to adsorption intensity | (21) | |
| Jovanovic | qm = maximum adsorption capacity (mg g-1), Kj = Jovanovic isotherm constant (L mg-1) | (22) | |
| Halsey | KH = Halsey isotherm constant, nH = Halsey isotherm constant | (23) | |
| Hill | qSH = Hill isotherm maximum uptake saturation (mg L-1), nH = Hill cooperativity coefficient of the binding interaction, KD = Hill constant | (21) | |
| Sips | KS = Sips isotherm model constant (L g-1), BS = Sips isotherm model exponent, AS= Sips isotherm model constant (L mg-1) | (21) | |
| Koble-Corrigan | a = Koble-Corrigan isotherm constant (Lnmg1-n g-1), n = adsorption intensity, b = Koble-Corrigan isotherm constant (L mg-1)n | (21) | |
| Toth | KT = Toth isotherm constant (mg g-1), AT = Toth isotherm constant (L mg-1), T = Toth isotherm constant | (21) | |
| Redlich-Peterson | kRP = Redlich-Peterson isotherm constant (L g-1), aRP = Redlich-Peterson isotherm constant (mg L-1)-bRP, bRP = Redlich-Peterson isotherm exponent | (21) | |
| Radke-Prausnitz | aRP = Radke-Prausnitz isotherm model constant, rR= Radke-Prausnitz isotherm model constant, BR = Radke-Prausnitz isotherm model exponent | (21) | |
| Khan | qS = theoretical isotherm saturation capacity (mg g-1), bK = Khan isotherm model constant, aK = Khan isotherm model exponent | (21) | |
| BET | qS = theoretical isotherm saturation capacity (mg g-1), CBET = BET adsorption isotherm related to the energy of surface interaction (L mg-1), CS = adsorbate monolayer saturation concentration (mg L-1) | (21) |
A Summary of Non-Linear Expression of Isotherm Models for Describing the Experimental Equilibrium Data
3.5. Measurement and Calculations
Unknown concentrations of phenol were determined according to the method 5530D of standard methods for the examination of water and wastewater (24). Briefly, in this colorimetric method, 4-aminoantipyrine was added to the phenol-containing solution and the intensity of color resulting from the reaction was determined at maximum wavelength of λ = 510 nm, using a Hatch-DR 5000 UV-Vis spectrophotometer. The measured intensity was converted to phenol concentration using a calibration curve.
The phenol removal efficiency (R, %) and amount of phenol adsorbed on silica aerogel (qe, mg g-1) were calculated using the below equations:
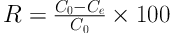
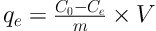
where C0 and Ce are the initial and final concentrations of phenol (mg L-1), respectively, m is the adsorbent mass (g), and V is the solution volume (L).
4. Results
4.1. Silica Aerogel Characteristics
The SEM image in Figure 1, which was obtained at two different magnifications, shows morphological characteristics of silica aerogel. The XRD pattern of silica aerogel in Figure 2 shows a broad peak close to 20° (2θ).

SEM image of prepared silica aerogel at 150x and 1000x magnifications

XRD pattern of silica aerogel
Figure 3 depicts the FTIR spectra of silica aerogel before and after phenol adsorption. As shown in Figure 3 A, there is a peak at 3400.72 cm-1 related to the hydroxyl functional group (-OH) before phenol adsorption (25). The peak that appeared around 1600 to 1700 cm-1 is related to stretching vibration of OH groups as a result of physical absorption of water on the particles (26). The absorption peak at 1158 cm-1 is attributed to O-Si-O vibration. The FTIR spectrum after phenol adsorption (Figure 3 B) shows a peak shifted to 3342 cm-1 and a new one appeared at 3213 cm-1. The peak at 1155.96 cm-1, assigned to O-Si-O, appeared more intense than the corresponding peak in the spectrum before adsorption. The peaks around 1075 cm-1 and 751 cm-1 may be attributed to aromatic C-H. Also, the peak at 799 cm-1 could be assigned to phenolic C-OH stretching (27). The peak around wave number of 619 cm-1 is due to the phenol ring (28). The shifted and new peaks appeared in this spectrum support the idea of phenol adsorption in the network of aerogel.
 and after phenol adsorption (B)")
FTIR spectra before phenol adsorption (A) and after phenol adsorption (B)
The NMR spectra of synthesized aerogel before and after phenol adsorption are given in Figure 4. In the spectrum before and after the adsorption, a chemical shift around 2.2δ was observed. In the spectrum after adsorption, however, a weak chemical shift was observed at 4.7δ and another shift in the region of 7.2δ.
 and after phenol adsorption (B)")
NMR spectrum before phenol adsorption (A) and after phenol adsorption (B)
The pHzpc of silica aerogel was determined to characterize surface chemistry of the adsorbent. The obtained results showed that the pHzpc was equal to 6.9.
4.2. Effect of Operational Parameters
4.2.1. Effect of Contact Time on Phenol Removal
In order to determine the effect of contact time on phenol adsorption onto silica aerogel, a series of contact time experiments were conducted at two different initial concentrations of phenol (50 and 100 mg L-1). Based on the obtained results, the maximum removal efficiency was obtained as 95.8% and 81.2% for 50 and 100 mgL-1, respectively (Figure 5 A). Also, it was observed that the time required to reach equilibrium was 45 minutes for concentration of 50 mgL-1 and 60 minutes for 100 mgL-1, which means the equilibrium time was a function of solute concentration.
4.2.2. Effect of pH on Phenol Removal
In the present study, the effect of solution pH on phenol adsorption was examined in the pH range of 3 to 12. According to Figure 5 B, phenol removal efficiency increased by rising pH and reached its maximum at pH 8.5. Then, it slightly decreased at pH 10 and reached its minimum at pH 12.
4.2.3. Effect of Initial Concentration of Phenol on the Adsorption Process
The obtained results on the effect of initial concentration of phenol are shown in Figure 5 C. As indicated, with an increase in initial phenol concentration, the removal efficiency decreased and on the contrary, the equilibrium adsorption capacity increased. For instance, at initial concentration of 20 mg L-1, the removal efficiency reached more than 99% with adsorption capacity of 9.95 mg g-1, whereas at initial phenol of 500 mgL-1, these values were 31.5% and 78.75 mg g-1, respectively.
4.2.4. Effect of Silica Aerogel Dosage on Phenol Removal
Figure 5 D shows the effect of various applied doses of silica aerogel on the removal efficiency and amount of loaded phenol. As indicated, the adsorption efficiency increased with an increase in adsorbent dose; with increasing silica aerogel from 0.4 to 8.0 g L-1, the removal efficiency increased from 23.3 to 98.8%. On the contrary, the loaded amount of phenol onto silica aerogel decreased from 58.3 to 12.5 mg g-1 by increasing adsorbent dose from 0.4 to 8.0 g L-1.
; B, solution pH (initial phenol = 100 mg L<sup>-1</sup>, silica aerogel = 2 g L<sup>-1</sup>, contact time = 60 min); C, initial concentration of phenol (silica aerogel = 2 g L<sup>-1</sup>, contact time = 60 min, solution pH = 7); and D, adsorbent dose (initial phenol = 100 mg L<sup>-1</sup>, solution pH = 7, contact time = 60 min)")
Adsorption of phenol onto silica aerogel as a function of: A, contact time (silica aerogel dose = 2 g L-1, solution pH = 7); B, solution pH (initial phenol = 100 mg L-1, silica aerogel = 2 g L-1, contact time = 60 min); C, initial concentration of phenol (silica aerogel = 2 g L-1, contact time = 60 min, solution pH = 7); and D, adsorbent dose (initial phenol = 100 mg L-1, solution pH = 7, contact time = 60 min)
4.3. Adsorption Kinetics
The kinetics of adsorption was determined to understand the nature of the adsorption process. In this study, the experimental data were analyzed using the non-linear forms of pseudo-first order and pseudo second order kinetic models. The pseudo-first order kinetic model is:
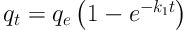
where qt and qe are the amount of solute loaded on adsorbent (mg g-1) at time t (min) and equilibrium, respectively, and k1 is the constant for pseudo-first order kinetic model (min-1). The pseudo-second order kinetic model is:
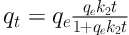
where k2 is the constant for pseudo-second order kinetic equation (g mg-1 min-1), and other parameters have been previously defined. The plots of data fitting the kinetic models are presented in Figure 6. As indicated, the higher amounts of phenol loaded onto silica aerogel were obtained at a concentration of 100 mg L-1 compared to 50 mg L-1. Table 2 lists the kinetic parameters and indicators of quality of fit. As observed, the pseudo-first order kinetic equation better described the experimental data for both investigated phenol concentrations, due to the higher values of Adj. R2 and lower values of χ2 and SSE. Also, the pseudo-first order kinetic equation could predict the experimental qe more accurately than the pseudo-second order kinetic equation.
")
The non-linear plots of kinetics for phenol adsorption onto silica aerogel (pH = 8.5, silica aerogel = 2 g L-1)
| Kinetic Model | Concentration (mg L-1) | Experimental qe (mg g-1) | Model Parameters | Statistical Indices | |||
|---|---|---|---|---|---|---|---|
| qe (mg g-1) | k | χ2 | SSE | Adj. R2 | |||
| Pseudo-first order | 50 | 23.95 | 25.10 | 0.043 | 3.61 | 25.28 | 0.9641 |
| 100 | 40.60 | 42.37 | 0.025 | 5.01 | 35.07 | 0.9807 | |
| Pseudo-second order | 50 | 23.95 | 29.67 | 1.6E-3 | 7.89 | 55.23 | 0.9215 |
| 100 | 40.60 | 53.76 | 0.4E-3 | 10.02 | 70.14 | 0.9614 | |
Kinetic Parameters for the Adsorption of Phenol onto Silica Aerogel
Intra-particle diffusion was also investigated by using the Weber-Morris model, as follows:

In this equation, qt (mg g-1) is the amount of dye adsorbed at time t (min), kid denotes the intra-particle diffusion rate constant (mg (g min1/2)-1), and C represents a constant (mg g-1). Figure 7 demonstrates the plot of qt versus t1/2 to quantify kid as the slope of the line and C as the intercept. As indicated, the experimental data give two distinct lines with different slopes.
")
Intraparticle diffusion plot for adsorption of phenol onto silica aerogel (Initial phenol = 100 mg L-1, pH = 8.5, silica aerogel = 2 g L-1)
4.4. Adsorption Isotherms
Adsorption isotherms are applied to describe the equilibrium of adsorbate fraction between solid and liquid phases. Freundlich and Langmuir are the most common isotherm models used for liquid adsorption systems. Moreover, ten other isotherm models that are less commonly used in adsorption studies were employed in the current research. Figure 7 depicts the experimental equilibrium data fitted to the Freundlich and Langmuir equations. The equation parameters and statistical indices for all adsorption isotherms are summarized in Table 3. As indicated, the Freundlich and Halsey equations generated a similar fit quality, and they were the most adequate two-parameter models for describing the behavior of the system by giving the lowest χ2, SSE, and AIC and the highest Adj. R2 values. However, the Langmuir equation also showed a reasonable fit by giving a calculated qm (75.23 mg g-1) close to the maximum experimental value (78.75 mg g-1). The b constant in the Langmuir equation was used to compute the separation factor, RL, from the following equation:
where C0 (mg L-1) is the highest initial concentration of adsorbate. Given C0 = 500 mg L-1 in the isotherm studies, RL = 0.06 was obtained, which indicates a favorable adsorption because of 0 < RL < 1.
Jovanovic isotherm, as a two parameter model, gave the poorest fit with the experimental data of this study. Three isotherms, including Hill, Sips, and Koble-Corrigan were the most efficient three-parameter models to fit the data. On the other hand, the Brunauer-Emmett-Teller (BET) isotherm was the poorest model examined in this study for prediction of equilibrium state in the phenol-silica aerogel system. The parameters of models and statistical indices for other isotherm models are listed in Table 3.
")
Equilibrium adsorption isotherms for phenol adsorption on silica aerogel (initial phenol = 20 - 500 mg L-1, pH = 8.5, silica aerogel = 2 g L-1, contact time = 180 min)
| Isotherm | BR46 Isotherm Parameters | ||||
|---|---|---|---|---|---|
| Constants | χ2 | SSE | Adj. R2 | AIC | |
| Langmuir | b = 0.06 L mg-1, qm = 75.23 mg g-1 | 37.45 | 299.64 | 0.9463 | 44.00 |
| Freundlich | Kf = 17.22 (mg g-1) (L g-1)1/n , n = 3.73 | 11.78 | 94.21 | 0.9831 | 32.43 |
| Jovanovic | qm = 67.99 mg g-1, Kj = -0.046 L mg-1 | 68.98 | 551.84 | 0.9011 | 50.11 |
| Halsey | KH= 2.4E-5, nH= -3.74 | 11.78 | 94.21 | 98.31 | 32.43 |
| Hill | qSH = 134.07 mg L-1, KD = 8.66, nH = 0.432 | 7.01 | 49.10 | 0.9899 | 31.91 |
| Sips | KS = 15.48 L g-1, AS = 0.11 L mg-1, BS = 0.432 | 7.01 | 49.10 | 0.9899 | 31.91 |
| Koble-Corrigan | a = 15.49 Lnmg1-n g-1, b = 0.115 (L mg-1)n, n = 0.432 | 7.01 | 49.10 | 0.9899 | 31.91 |
| Toth | KT = 21.76 mg g-1, AT = 1.38 L mg-1, T = 1.29 | 15.19 | 106.32 | 0.9782 | 39.64 |
| Redlich-Peterson | kRP = 28.24 L g-1, aRP = 1.27 (mg L-1)-bRP, bRP = 0.778 | 13.81 | 96.65 | 0.9802 | 38.68 |
| Radke-Prausnitz | aRP = 28.21, rR = 22.19, BR = 0.22 | 13.81 | 96.65 | 0.9802 | 38.68 |
| Khan | qs = 3.59 mg g-1, bK = 355.28, aK = 0.732 | 13.46 | 94.19 | 0.9807 | 38.42 |
| Bet | CBET = 158.53 L mg-1, qs = 59.09 mg g-1, Cs = 1267.14 mg L-1 | 24.18 | 169.27 | 0.9653 | 44.29 |
Values of Isotherm Models for Adsorption of Phenol onto Silica Aerogel
5. Discussion
5.1. Characterization of Silica Aerogel
In terms of morphology, SEM examination showed that silica aerogel has a rough surface composed of an interconnected network. The pore sizes are different, including macropores (50 to 1000 nm), mesopores (2 to 50 nm), and micropores (0.2 to 2 nm). Faghihian et al. (14) also defined the surface of prepared silica aerogel inconsistent and heterogeneous.
According to the XRD pattern of silica aerogel in Figure 2 that shows a broad peak close to 20° (2θ), the amorphous structure of SiO2 was confirmed. This finding is consistent with the obtained results by Thompson et al. (29) and Poureteda et al. (30).
The characterization of silica aerogel in FTIR spectra (Figure 3) indicated the disposition of hydroxyl group into silicate network, which turns sodium silicate to aerogel. After phenol adsorption, a peak shifted to 3342 cm-1 and a new one appeared at 3213 cm-1, which demonstrated the contribution of -OH functional group in the phenol uptake. The greater intensity of O-Si-O peak in the spectrum of phenol-loaded adsorbent implied a better developed silica network after phenol adsorption (31).
In the NMR spectra, illustrated in Figure 4, a chemical shift around 2.2δ appeared, which can be referenced to Si-OH (27). The weak chemical shift observed at 4.7δ in the spectrum after adsorption was probably due to the phenolic -OH group and the chemical shift in the region of 7.2δ can be attributed to phenolic aromatic ring (32). They both indicated adsorption of phenol onto the surface of silica aerogel.
Determination of pHzpc at 6.9 reveals that surface sorption sites of adsorbent are positively charged at medium pH below 6.9, neutral at pH equal to 6.9, and negatively charged at pH above 6.9. The pHzpc value around neutral pH has also been reported for silica aerogel in other studies (33).
5.2. Effect of Contact Time
As mentioned earlier, to determine the effect of contact time on the adsorption process, the experiments were carried out at two different initial concentrations of phenol. As observed in Figure 5 A, the removal rate was higher in the presence of lower phenol concentration (95.8% versus 81.2% at 50 and 100 mgL-1, respectively). The obtained results of this study is in accordance with the findings of Rodrigues et al. (34). The high removal rate of phenol during the first one-third of reaction time was attributed to the interfacial bonding of adsorbate on the empty and ready-to-adsorb binding sites of adsorbent surface (35). In a previous study, a removal efficiency of 60% was obtained for phenol (20 mg/L) in the presence of Luffa cylindrica fibers as adsorbent at 120 minutes of contact time (36).
5.3. Effect of Solution pH
Solution pH is one of the most effective parameters in the adsorption process because it directly affects ionization degree of solute and surface characteristics of adsorbent. As shown in Figure 5 B, the maximum removal rate was attained at pH 8.5. The effect of solution pH observed in the present study is similar to that observed by Abdelwahab and Amin (36) in a phenol adsorption system. To explain the findings, it should be noted that phenol as a weak acid has a pKa value around 10, which means that this molecule is predominantly found as phenoxide ion (the anionic form of phenol) at pH values above 10 (34). At the same time, due to the pHzpc of 6.9, silica aerogel also has negative sites on the surface. Therefore, in this pH region, electrostatic repulsive force between anions of phenoxide and negatively charged silica aerogel hindered the adsorption of solute onto the adsorbent. On the other hand, in media with pH below 10, phenol remained in its undissociated form, which could be attracted by negative (6.9 < pH < 10), neutral (pH = 6.9), and positive (3 < pH < 6.9) surface of silica aerogel due to dispersion interaction. The lower removal rate at pH ≤ 5.5 could be attributed to the competition of protons with phenol molecules to be adsorbed onto silica aerogel surface (35).
5.4. Effect of Initial Concentration of Phenol
The initial concentration of solute is of remarkable importance due to its role in the solid/liquid equilibrium. In this study, the reduction in the removal efficiency at higher phenol concentrations (Figure 5 C) could be due to the saturation of active sites of the adsorbent, which resists against phenol molecules uptake at high concentrations. On the other hand, a decrease in the adsorption capacity of silica aerogel was observed by decreasing phenol concentration in the solution. This trend has been previously reported in similar studies (35) and indicated unsaturated adsorption sites on silica aerogel surface in presence of low concentrations of phenol. In general, the adsorption process using silica aerogel synthetized in this study could remove phenol over 90% when initial phenol concentration was below 50 mg L-1. In comparison with other treatment processes for phenol removal, Davoudi et al. (8) reported removal rate of 78.14% in an electrochemical oxidation process, Asgari et al. (4) obtained the rate of 32% in sole ozonation process and 63% in catalytic ozonation process with modified zeolite, and Bazrafshan et al. (37) suggested efficiencies of 94.72% and 98% in electrocoagulation process with aluminum and iron electrodes, respectively.
5.5. Effect of Silica Aerogel Dosage
Different adsorbent dosages have an impact on the number of adsorption sites available for the adsorbate. According to Figure 5 D, adsorbent has a significant direct effect on the removal rate. The trend in this study can be related to the increased surface area and active sites of adsorbent in high applied doses of adsorbent. On the contrary, the loaded amount of phenol decreased by an increase in adsorbent dosage. This trend has also been reported by Rodrigues et al. (34) for removal of phenol by using carbon xerogel. A removal efficiency of 65% was obtained by Abdelwahab and Amin in presence of 3 g/L Luffa cylindrica fibers at 20 mg/L of phenol (36).
5.6. Adsorption Kinetics
Kinetics of adsorption were examined at two phenol concentrations of 50 and 100 mg L-1. The obtained results (Figure 6 and Table 2) indicated that the experimental data were better predicted by the pseudo-first order kinetic equation than pseudo-second order kinetic equation. This finding indicates the contribution of physical adsorption of phenol molecules onto silica aerogel was probably due to the driving force in presence of high initial concentrations (38).
The intra-particle diffusion was also investigated in the current study. As indicated by Figure 7, two lines with different slopes are distinguishable. From the first line that describes the adsorption process in the initial 60 minutes of the reaction, kid is 7.1735 mg (g min1/2)-1 and C constant is 6.7118 mg g-1. The C constant is of importance because it is proportional to the thickness of boundary layer in the interface of liquid-solid (39). The second line describes the behavior of the system between the reaction times of 60 and 2880 minutes. As observed, the slope of the line (kid value) is quite close to zero (= 6E-5) indicating that the system had reached an equilibrium. Under such circumstances, the amount of phenol adsorbed on 1 g of adsorbent (i.e. C constant value) was fixed at 47.398 mg g-1. In the literature, a single-step reaction was reported by Doltabadi et al. (20) for adsorption of cationic and anionic dyes onto sawdust-based adsorbent and a three-step plot was drawn by Witek-Krowiak for adsorption of malachite green onto beech sawdust (40).
5.7. Adsorption Isotherms
As previously mentioned for the isotherm study, the experimental equilibrium data were well-described by Freundlich and Halsey equations. This finding is in accordance with the finding of a previous study (23) and may be due to the fact that both models have been developed to explain multilayer coverage of adsorption of molecules onto an adsorbent with heterogeneous sorption sites. Similar to the current study, Qin et al. (12) introduced the Freundlich isotherm as the best adequate model in phenol-granular silica aerogel system, supporting the idea of physical adsorption of phenol on silica aerogel surface. A value of n > 1 in the Freundlich model shows the favorable adsorption of phenol onto silica aerogel (41). The maximum adsorption capacity of silica aerogel was found to be 75.23 mg g-1 in this study from the Langmuir equation, which is smaller than that reported by Abdoli et al. (35) for uptake of 4-Bromophenol (270.27 mg g-1) and 4-Chlorophenol (238.09 mg g-1) on nanoporous silica aerogel, while it is higher than the capacity of 32 mg g-1 observed by Rodrigues et al. (34) for adsorption of phenol onto carbon xerogel. Furthermore, in Faghihian et al. study, the maximum adsorption capacity of the modified silica aerogel was obtained as 47.6 mg/g for Cu(II) and 27.7 mg/g for Ni(II) (14), which is much smaller than what was obtained in this study. Regarding phenol adsorption on other adsorbents, Gokce and Aktas (42) reported adsorption capacity of 108.4 mg/g for activated carbon produced from waste tea, Han et al. (43) reported 36.2 mg/g for a functionalized porous material (PGMA), and Abdelwahab and Amin (36) obtained 10.37 mg/g for Luffa cylindrica fibers.
The reason for poor fitting of Jovanovich isotherm could be due to the fact that this equation is developed on the basic assumption of monolayer adsorption (22). Hence, it can be concluded that adsorption of phenol on silica aerogel could not be described as monolayer localized, specially without lateral interactions assumed by the Jovanovic isotherm.
Among three-parameter models, three isotherms of Hill, Sips, and Koble-Corrigan gave better fits with the data, which is in accordance with a previous study (44). As indicated, Hill, Sips, and Koble-Corrigan isotherms overlapped each other by producing similar values of statistical indices. This finding is in line with those reported by Doltabadi et al. (20) for removal of BR46 and RR196 dyes, using sawdust adsorbent. However, different values have been obtained in the statistical analysis of aforementioned models by Najafpoor et al. (41) for description of RR141 uptake on Melia sawdust. The Hill isotherm postulates that homogenous surface sites are responsible for adsorption of species. The Sips and Koble-Corrigan isotherms, however, have been written by combining the Langmuir and Freundlich models to overcome the limitation associated with rising pollutant concentration in the Freundlich isotherm. Sips can reasonably predict the monolayer adsorption capacity characterized by the Langmuir isotherm in presence of high concentrations of adsorbate; while at low concentrations, it approaches multilayer adsorption capacity similar to the Freundlich model.
The Toth isotherm has been developed to improve the traditional Langmuir isotherm. This model is useful for representation of the equilibrium data in heterogeneous adsorption systems. However, the Toth model could not explain the experimental data under the conditions of the current study.
Another isotherm model incorporating both Langmuir and Freundlich equations is the Redlich- Peterson model. This model is applicable for a wide range of adsorbate concentrations in homogeneous or heterogeneous kinds of adsorption systems. In the current study, it was somewhat efficient for prediction of experimental data because of giving Adj. R2 value of 0.9802 and AIC value of 38.68. Similar values were also calculated in case of the Radke-Prausnitz model, which is consistent with the findings of Hamdaoui and Naffrechoux (45) for adsorption of phenol and chlorophenols onto granular activated carbon.
Khan isotherm, suggested for pure solutions, also generated a reasonably good fit with the equilibrium adsorption data. Brunauer-Emmett-Teller (BET) isotherm gave the poorest outputs probably due to the fact that this isotherm is suitable for gas-solid systems while the current research dealt with phenol adsorption in a liquid system.
Data on the cost of adsorbents used for phenol removal are scarce in scientific articles. Silica aerogel is not an exception as well. It is believed that the cost of adsorbent depends on factors, such as its availability, materials used for processing, applied experimental conditions, recyclability, etc. In terms of cost-effectiveness, there is a rule of thumb that low-cost adsorbents have low adsorption capacities and vice versa. For instance, the adsorption capacities of 23.8, 59.2, and 350 mg/g were obtained for phenol removal by using Bagasse fly ash (cost: 20 US$/ton), Red mud (25 US$/ton), and Activated carbon (22000 US$/ton), respectively. By comparing the results, silica aerogel used in this study was more efficient (75.23 mg g-1 adsorption capacity) than Bagasse fly ash and Red mud and less efficient than activated carbon (46).
5.8. Conclusion
In this study, silica aerogel was prepared, characterized, and successfully used for phenol adsorption in a wide range of concentration (20 to 500 mg L-1). The removal efficiency reached above 90% for concentrations equal to or below 50 mg L-1. The equilibrium time also showed a relationship with initial phenol concentration as it decreased by decreasing initial concentration. The reaction kinetics followed the pseudo-first order model. The isotherm study showed that equilibrium adsorption data were well-described by Freundlich and Halsey equations, among two-parameter isotherms, and Hill, Sips, and Koble-Corrigan, among three-parameter isotherms. On the other hand, Jovanovic and BET were the worst isotherm models for prediction of experimental equilibrium data. Maximum adsorption capacity of 75.23 mg g-1 was calculated in the phenol-silica aerogel adsorption system. The chemical structural analysis confirmed -OH functional groups in amorphous SiO2 and proved the adsorption of phenol onto the surface of silica aerogel. It can be concluded that silica aerogel is an efficient adsorbent for removal of phenol from aqueous solutions and can be used for industrial wastewater treatment.
