


1. Background
Celiac disease (CD) is a chronic autoimmune disorder characterized by a lifelong intolerance to gluten, a protein found in wheat, rye, and barley. In recent decades, the global incidence of CD has increased notably (1, 2), now affecting approximately 1 - 2% of the population worldwide (2-4). In Iran, the prevalence is estimated at around 2% (4). The disease is more common in children than adults and occurs 1.5 to 2 times more frequently in females than males (5, 6). Patients with CD commonly exhibit a variety of gastrointestinal and extraintestinal symptoms, including vomiting, anorexia, failure to thrive, diarrhea, abdominal bloating, pain, constipation, and weight loss (1, 2, 7).
Currently, the only effective treatment for CD is strict, lifelong adherence to a gluten-free diet (GFD) (4, 8). In addition to improving gastrointestinal and systemic symptoms, GFD may lower the increased cardiovascular risk observed in untreated CD patients (9, 10). However, its effect on cardiometabolic risk remains debated. Some studies show benefits on systolic blood pressure, HDL cholesterol, and inflammation (11), while others raise concerns about the high fat, sugar, and salt content in many gluten-free products, which may lead to poor lipid profiles, insulin resistance, and higher rates of overweight and obesity (12, 13). While GFD adherence is associated with improved clinical outcomes, it may also impact the quality of life (QoL) of patients and their families (1, 4).
Quality of life in individuals with CD is influenced by various factors, including education level, employment status, disease severity, age at diagnosis, disease duration, presence of comorbidities, and duration of GFD adherence (4, 14). Several studies have consistently shown that QoL is significantly diminished prior to diagnosis (8, 15). However, after diagnosis and the initiation of a GFD, QoL improves significantly, often reaching levels comparable to those of the general population (4). Adherence to a GFD has also been associated with reductions in depressive symptoms (16), and symptom severity is strongly correlated with QoL (4). Yet, maintaining a strict GFD can be challenging — especially in low-income populations — due to the limited availability and higher costs of gluten-free products (17).
Some surveys have explored the impact of GFD on QoL among children, consistently reporting improvements in physical, psychological, and social dimensions, significantly enhancing QoL (16, 18). Despite these findings, limited research has specifically focused on children, particularly the interplay between GFD adherence and QoL (19).
2. Objectives
Understanding the factors that influence QoL in this population is crucial for providing comprehensive, patient-centered care. Therefore, the present study aimed to evaluate the relationship between GFD adherence and QoL among children with CD and to explore associations with demographic variables, disease-related characteristics, and perceived financial burdens.
3. Methods
3.1. Type of Study, Sample Size, and Sampling
This cross-sectional survey was conducted in 2021 and involved 409 children aged ≤ 10 years with CD. Using a census sampling method, all children meeting the inclusion criteria from the CD clinics at Boali and Ali-Ibn-Abitalib hospitals in Zahedan, southeastern Iran, were recruited. This approach minimized selection bias and enhanced the representativeness of the findings. Participation was voluntary, and informed consent was obtained from all parents or legal guardians.
3.2. Inclusion and Exclusion Criteria
The inclusion criterion was a confirmed diagnosis of CD and the exclusion criterion was lack of consent to participate in the study.
3.3. Research Tools
In this study, a researcher-designed questionnaire including demographic information, symptoms, comorbidities, GFD costs perception, GFD adherence (24 items), and QoL (35 items) was used. The content validity of the final questionnaire was confirmed through expert review by six specialists and evaluated using statistical indices, including the Kendall’s coefficient of concordance. The content validity ratio (CVR) was 0.9, and the Content Validity Index (CVI) ranged from 0.83 to 0.94. Reliability was assessed via a pilot study involving 20 participants, and internal consistency was determined using Cronbach’s alpha coefficient. To minimize the rate of missing data, efforts were made to ensure data completeness by supervising questionnaire completion and encouraging responses to all items.
Responses were recorded on a 5-point Likert scale. The total QoL score was categorized into five levels, with a range from 35 to 175. All QoL and dimension items were negatively oriented, meaning that lower scores indicated better QoL. Adherence to the GFD was also categorized into five levels based on the total score (range: 24 - 120).
3.4. Statistical Analysis
All statistical analyses were performed using SPSS software version 23. The normality of data distribution was assessed using the Kolmogorov-Smirnov test. Categorical variables were presented as frequency (percentage), while continuous variables were reported as mean ± standard deviation (SD). To assess differences in QoL and GFD adherence across subgroups, the analysis of variance (ANOVA) was used and chi-square test was used to analyze the relationship between categorical variables. Pearson’s correlation coefficient was employed to examine correlations between numeric variables. A significance level of P < 0.05 was considered statistically significant.
4. Results
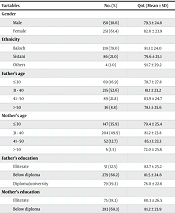
In the present study, 409 children aged ≤ 10 years with CD were included. The mean ± SD of age and disease duration were 6.81 ± 2.46 years and 2.94 ± 2.19 years, respectively. The results comparing QoL and GFD adherence across demographic subgroups are presented in Table 1.
| Variables | No. (%) | QoL (Mean ± SD) | P-Value | GFD Adherence (Mean ± SD) | P-Value |
|---|---|---|---|---|---|
| Gender | 0.26 | 0.78 | |||
| Male | 158 (38.6) | 79.3 ± 24.8 | 69.0 ± 6.9 | ||
| Female | 251 (61.4) | 82.0 ± 23.9 | 68.9 ± 6.5 | ||
| Ethnicity | 0.58 | 0.003 | |||
| Baloch | 319 (78.0) | 81.1 ± 24.0 | 68.3 ± 6.2 | ||
| Sistani | 86 (21.0) | 79.6 ± 25.1 | 71.1 ± 7.7 | ||
| Others | 4 (1.0) | 91.7 ± 29.2 | 71.75 ± 5.85 | ||
| Father’s age | 0.51 | 0.85 | |||
| ≤ 30 | 69 (16.9) | 78.7 ± 27.8 | 68.9 ± 6.5 | ||
| 31 - 40 | 215 (52.6) | 81.1 ± 23.2 | 69.2 ± 6.6 | ||
| 41 - 50 | 89 (21.8) | 83.9 ± 24.7 | 68.5 ± 6.8 | ||
| > 50 | 36 (8.8) | 78.1 ± 25.6 | 69.2 ± 7.6 | ||
| Mother’s age | 0.44 | 0.624 | |||
| ≤ 30 | 147 (35.9) | 79.4 ± 25.4 | 68.9 ± 5.6 | ||
| 31 - 40 | 204 (49.9) | 81.2 ± 23.8 | 68.9 ± 7.2 | ||
| 41 - 50 | 52 (12.7) | 85.1 ± 23.3 | 69.5 ± 7.4 | ||
| > 50 | 6 (1.5) | 72.0 ± 25.6 | 65.0 ± 4.7 | ||
| Father’s education | 0.48 | 0.003 | |||
| Illiterate | 51 (12.5) | 82.7 ± 25.2 | 67.9 ± 5.6 | ||
| Below diploma | 279 (68.2) | 81.5 ± 24.6 | 68.5 ± 6.4 | ||
| Diploma/university | 79 (19.3) | 78.0 ± 22.8 | 71.4 ± 7.6 | ||
| Mother’s education | 0.95 | 0.01 | |||
| Illiterate | 75 (18.3) | 80.3 ± 26.5 | 68.4 ± 6.9 | ||
| Below diploma | 283 (69.3) | 81.2 ± 23.9 | 68.7 ± 6.1 | ||
| Diploma/university degree | 51 (12.4) | 81.3 ± 23.7 | 71.6 ± 8.9 | ||
| Father’s job | 0.22 | 0.09 | |||
| Unemployed | 68 (16.6) | 87.1 ± 31.4 | 69.4 ± 6.7 | ||
| Employee | 58 (14.2) | 81.4 ± 24.2 | 70.4 ± 8.6 | ||
| Retired | 6 (1.5) | 70.0 ± 10.4 | 72.6 ± 4.2 | ||
| Self-employed | 277 (66.7) | 80.0 ± 22.8 | 68.3 ± 6.2 | ||
| Mother’s job | 0.39 | 0.01 | |||
| Housewife | 381 (93.2) | 80.6 ± 24.5 | 68.8 ± 6.2 | ||
| Others | 28 (6.8) | 84.4 ± 22.8 | 72.1 ± 1.8 | ||
| Years since diagnosis (y) | 0.007 | 0.93 | |||
| < 1 | 96 (23.5) | 74.7 ± 23.6 | 69.1 ± 7.1 | ||
| 1 - 3 | 165 (40.3) | 81.1 ± 25.5 | 69.0 ± 6.5 | ||
| > 3 | 148 (36.2) | 84.7 ± 22.6 | 68.8 ± 6.6 |
Comparison of Quality of Life and Gluten-Free Diet Adherence Across Demographic Subgroups
The gender distribution showed that females (61.4%) outnumbered males (38.6%). The majority of participants were from the Baloch ethnic group (78.0%). Most parents were in the 31 - 40 age range, with an education level below a diploma. A higher proportion of mothers were homemakers (93.2%), while most fathers were self-employed (66.7%). A significant trend was observed based on the number of years since diagnosis (P = 0.007): Patients diagnosed within the past year had better QoL scores. It’s important to note that the QoL score was inversely scaled, meaning that lower scores indicate better QoL. Regarding GFD adherence, significant associations were found with ethnicity (P = 0.003), father’s education (P = 0.003), mother’s education (P = 0.01), and mother’s occupation (P = 0.01). Specifically, patients whose parents had higher educational attainment and those whose mothers were employed outside the home showed better adherence to the GFD.
As shown in Table 2, the most prevalent symptom among celiac patients was abdominal pain (75.6%), followed by weight loss (64.1%) and diarrhea (44.7%). No significant gender differences were observed for most of the presenting symptoms (all P > 0.05). However, hair loss was significantly more common among female patients compared to males (P = 0.004). The most commonly reported comorbidities were aggression (17.1%), followed by depression (11.5%) and dermatitis (5.1%). No significant gender differences were found in the diagnostic procedures.
| Symptoms a | Male (N = 158) | Female (N = 251) | Total (N = 409) | P-Value |
|---|---|---|---|---|
| Abdominal pain | 122 (39.6) | 187 (60.4) | 309 (75.6) | 0.63 |
| Weight loss | 99 (37.9) | 163 (62.1) | 262 (64.1) | 0.67 |
| Diarrhea | 66 (36.3) | 117 (63.7) | 183 (44.7) | 0.35 |
| Nausea and vomiting | 50 (35) | 93 (65) | 143 (35.0) | 0.28 |
| Anorexia | 43 (38.1) | 70 (61.9) | 113 (27.6) | 0.9 |
| Flatulence | 34 (32.1) | 72 (67.9) | 106 (25.9) | 0.10 |
| Constipation | 25 (31.3) | 55 (68.7) | 80 (19.6) | 0.12 |
| Short stature | 29 (40.3) | 43 (59.7) | 72 (17.6) | 0.79 |
| Chronic fatigue | 11 (32.4) | 23 (67.6) | 34 (8.3) | 0.46 |
| Irritability | 9 (40.9) | 13 (59.1) | 22 (5.4) | 0.82 |
| Headache | 6 (33.3) | 12 (66.7) | 18 (4.4) | 0.80 |
| Hair loss | 1 (5.9) | 16 (94.1) | 17 (4.2) | 0.004 |
| Skin rashes | 5 (41.7) | 7 (58.3) | 12 (2.9) | 0.52 |
| Depression | 4 (36.4) | 7 (63.6) | 11 (2.7) | 0.56 |
| Concentration disorder | 0 (0.0) | 2 (100) | 2 (0.5) | 0.52 |
| Comorbidities | ||||
| Aggression | 30 (42.9) | 40 (57.1) | 70 (17.1) | 0.50 |
| Depression | 16 (34.0) | 31 (66.0) | 47 (11.5) | 0.52 |
| Dermatitis | 9 (42.9) | 12 (57.1) | 21 (5.1) | 0.81 |
| Hypothyroidism | 5 (38.5) | 8 (61.5) | 13 (3.2) | 0.97 |
| Liver disease | 4 (36.4) | 7 (63.6) | 11 (2.7) | 0.95 |
| Epilepsy | 2 (40) | 3 (60) | 5 (1.2) | 0.98 |
| Type 1 diabetes | 3 (75) | 1 (25) | 4 (1.0) | 0.30 |
| Autoimmune disease | 0 (0) | 2 (100) | 2 (0.5) | 0.52 |
| Type 2 diabetes | 1 (100) | 0 (0) | 1 (0.2) | 0.38 |
| Diagnostic tests | ||||
| Blood test | 144 (38.7) | 229 (61.3) | 373 (91.2) | 0.85 |
| Endoscopy | 153 (39.4) | 236 (60.6) | 389 (95.1) | 0.33 |
| Bone density | 30 (39.0) | 47 (61.0) | 77 (18.8) | 0.99 |
| Genetic | 20 (36.4) | 35 (63.6) | 55 (13.4) | 0.76 |
Distribution of Symptoms, Comorbidities, and Diagnostic Tests Utilization by Gender in Patients with Celiac Disease
The results in Table 3 show that, overall, nearly three-quarters of the participants had a favorable perception of their QoL. Additionally, the majority of patients (72.6%) demonstrated a moderate level of GFD adherence.
| QoL Dimensions | Very Low | Low | Moderate | High | Very High |
|---|---|---|---|---|---|
| Physical health | 7 (1.7) | 47 (11.5) | 105 (25.7) | 190 (46.5) | 60 (14.7) |
| Emotional health | 12 (2.9) | 34 (8.3) | 96 (23.5) | 104 (25.4) | 163 (39.9) |
| Activity | 4 (1.0) | 21 (5.1) | 63 (15.4) | 149 (36.4) | 172 (42.1) |
| Relationship | 9 (2.2) | 36 (8.8) | 99 (24.2) | 213 (52.1) | 52 (12.7) |
| Total QoL | 2 (0.5) | 35 (8.6) | 77 (18.8) | 190 (46.5) | 105 (25.7) |
| Adherence to the GFD | 1 (0.2) | 92 (22.5) | 297 (72.6) | 19 (4.6) | 0 (0.0) |
Levels of Quality of Life and Adherence to the Gluten-Free Diet in Celiac Disease Patients
The results in Table 4 reveal a significant positive correlation between advancing age (r = 0.240, P < 0.01), longer disease duration (r = 0.148, P < 0.01), lower GFD adherence (r = 0.244, P < 0.01), and the presence of additional comorbidities (r = 0.159, P < 0.01) with reduced QoL. Importantly, the QoL score is inversely scaled — higher scores indicate poorer QoL.
Correlation Coefficients Between Age, Gluten-Free Diet Adherence, Disease Duration, Number of Medical Problems, and Total Quality of Life
These findings, as shown in Table 5, suggest that patients who use a shopping cart for payment (P = 0.001), along with those experiencing fewer financial difficulties (P = 0.001), less distress (P = 0.001), and fewer financial struggles (P = 0.001) related to the cost of gluten-free products, tend to exhibit better adherence to the GFD. Furthermore, patients who reported paying for recommended gluten-free foods themselves or using a shopping cart (P = 0.001), as well as those who never experienced distress or frustration (P = 0.003) and never struggled financially to afford the GFD (P = 0.001), demonstrated significantly better QoL compared to other groups.
| Patients’ Views | GFD Adherence | QoL | |||
|---|---|---|---|---|---|
| No. (%) | Mean ± SD | P-Value | Mean ± SD | P-Value | |
| Methods of payment for gluten-free foods | 0.001 | 0.001 | |||
| I pay myself | 142 (34.7) | 69.2 ± 6.41 | 89.16 ± 23.27 | ||
| I have a shopping cart | 39 (9.5) | 73.0 ± 8.0 | 90.9 ± 35.4 | ||
| Both cases | 228 (55.7) | 68.1 ± 6.4 | 74.0 ± 20.1 | ||
| Patients’ views on the financial burden of CD treatment | 0.001 | 0.45 | |||
| It is fair | 10 (2.4) | 76.0 ± 5.3 | 73.1 ± 28.8 | ||
| It is relatively high | 26 (6.4) | 77.2 ± 9.6 | 86.9 ± 20.1 | ||
| Very high but I can afford | 77 (18.8) | 69.2 ± 6.3 | 81.0 ± 22.0 | ||
| Very high and I cannot afford | 296 (72.4) | 67.9 ± 5.8 | 80.7 ± 25.0 | ||
| Feelings of distress or frustration related to the cost of gluten-free food alternatives | 0.001 | 0.003 | |||
| Never | 12 (2.9) | 75.9 ± 7.0 | 56.1 ± 21.6 | ||
| Sometimes | 35 (8.5) | 76.5 ± 7.7 | 78.6 ± 16.6 | ||
| mostly | 107 (26.2) | 70.4 ± 5.0 | 80.8 ± 21.1 | ||
| Always | 255 (62.3) | 67.0 ± 6.0 | 82.5 ± 25.9 | ||
| Struggling financially to afford a GFD | 0.001 | 0.001 | |||
| Never | 12 (2.9) | 76.5 ± 7.9 | 55.9 ± 22.0 | ||
| Sometimes | 29 (7.1) | 77.0 ± 7.9 | 75.1 ± 12.2 | ||
| mostly | 100 (24.4) | 70.7 ± 5.3 | 79.5 ± 19.2 | ||
| Always | 268 (65.6) | 67.1 ± 5.9 | 83.2 ± 26.2 | ||
| Total | 409 (100) | 69.0 ± 6.7 | 80.9 ± 24.3 | ||
Patients’ Views on the Cost of Gluten-Free Products and Their Impact on Gluten-Free Diet Adherence and Quality of Life
5. Discussion
This study included 409 children aged ≤ 10 years with CD, with a mean age of 6.81 ± 2.46 years and a median disease duration of 3 years. The majority of participants were female, and most were of the Baloch ethnic group. Parents were predominantly aged 31 - 40 years. Parental education emerged as a significant factor in CD management, potentially improving understanding, enhancing GFD adherence, and providing greater family support. The most common symptoms among children with CD were abdominal pain, weight loss, and diarrhea, with aggression, depression, and dermatitis reported as the most frequent comorbidities. Blood tests and endoscopy with biopsy were the primary diagnostic tools used. The average QoL score was high, while GFD adherence was moderate. Older age, longer disease duration, and more comorbidities were associated with poorer QoL, which was inversely linked to GFD adherence. Overall, these findings highlight the substantial influence of financial factors on both GFD adherence and QoL in individuals with CD.
In the current study, the majority of CD patients were female, which aligns with previous findings. For instance, Singh et al. reported a female-to-male ratio of 2.5 (P < .001) (6), Saeed et al. observed a higher prevalence among Saudi girls (55.5% vs. 44.5%) (20), Van Kalleveen et al. reported 67% female participants with a 2: 1 ratio (21), and Stahl et al. found a 1.4 times higher prevalence in females (22). This consistency across studies underscores the higher prevalence of CD among females, which is well-documented in the literature.
The prevalence of symptoms can vary across individuals. Stahl et al. found common symptoms in children with CD to include stomach aches, constipation, vomiting, diarrhea, and weight loss (22). Similarly, Van Kalleveen et al. identified recurrent abdominal pain and distension as predominant symptoms, with about one-third of children presenting the classical triad of failure to thrive, abdominal distension, and chronic diarrhea (21). Saeed et al. also noted that failure to thrive was the most common presentation in Saudi children, followed by short stature, abdominal distension, and chronic diarrhea (20). These findings are consistent with the results of the present study, where abdominal pain was the most commonly reported symptom, followed by weight loss, diarrhea, and vomiting.
Interestingly, the most commonly reported comorbidities in this study were aggression and depression, which contrasts with Saeed et al.’s findings, where type 1 diabetes was reported as a common comorbidity in Saudi children (20). The high frequency of aggression and depression highlights the need to consider the broader systemic impact of CD, which necessitates comprehensive management strategies addressing both gastrointestinal and extraintestinal manifestations.
Regarding diagnostic methods, blood tests were used in 91.2% of cases, slightly lower than the 100% reported by Van Kalleveen et al. (21). Endoscopy with biopsy, the diagnostic gold standard, was performed in 95.1% of participants, which is higher than the rates reported by Singh et al. (70%) (6) and Van Kalleveen et al. (60%) (21). Combining serological testing with biopsy remains the most reliable method for confirming CD.
The data showed high overall QoL scores across physical health, emotional well-being, activity, and relationships. However, this contrasts with studies by Burger et al., who reported slightly lower QoL in CD patients compared to healthy controls (18), and Simsek et al., who observed significantly lower emotional well-being scores in children with CD (16). These discrepancies may be attributed to the challenges of maintaining a strict GFD, which can significantly affect daily life and overall QoL (23).
The present study found moderate adherence to the GFD, which is consistent with the findings by Gladys et al., who reported that 24% to 52% of participants did not adhere to the diet adequately (24). Poor adherence remains a major challenge due to factors such as limited availability, high cost, and suboptimal quality of certified gluten-free products (24-26). Interestingly, several studies have indicated that strict adherence to a GFD can negatively impact QoL, particularly in the social and emotional domains (27, 28). Research has shown that individuals following a GFD often face increased stress when dining out, due to fears of gluten cross-contact, discomfort in repeatedly questioning food preparation, and frustration over the GFD being perceived as a trend rather than a medical requirement (28).
A key finding of the present study was the link between financial strain and both lower GFD adherence and reduced QoL among CD patients. Previous studies in the UK by Fry et al. and Burden et al. reported that gluten-free foods were, on average, 159% to 400% more expensive than regular products (17, 29). These costs adversely affect adherence to the GFD and the QoL of patients. Similarly, Posterick and Ayars found that individuals with lower incomes had the poorest adherence, which increased their risk for disease progression and complications (30). These findings emphasize the significant impact of economic barriers on CD management. The high costs of gluten-free foods and hospitalizations call for policy interventions (31), such as subsidies, to improve adherence and overall well-being for individuals with CD.
5.1. Conclusions
In summary, this study highlights the complex challenges faced by children with CD and their parents, particularly in relation to QoL and GFD adherence. Despite relatively high QoL scores, GFD adherence was only moderate, with significant variations observed based on demographic and socioeconomic factors. Parental education, maternal employment, disease duration, age, comorbidities, and especially financial burden were strongly associated with both adherence and QoL. These findings underscore the crucial role of parental support and socioeconomic stability in managing CD effectively. Notably, the high cost of gluten-free foods and the associated financial stress emerged as critical barriers to optimal adherence and QoL. This reinforces the urgent need for policy-level interventions aimed at improving the affordability and accessibility of gluten-free products. Integrating these insights into family-centered care (FCC) approaches (32) and public health strategies could enhance disease management and promote better long-term outcomes for pediatric patients with CD.
5.2. Research Limitations
A key limitation of this study is that children aged ≤ 10 years were unable to complete the questionnaires themselves, so parents were required to respond on their behalf. To reduce bias and enhance validity, census sampling, standardized questionnaires, and confidentiality assurances were implemented.
