


1. Background
Colorectal cancer (CRC) is a common and serious public health threat. It is the third leading cause of cancer deaths worldwide, significantly impacting developed countries (1). In 2020 alone, colon and rectal cancers were the third most diagnosed cancers, with nearly 2 million new cases, and the second deadliest, with over 916,000 deaths (2). In Iran, CRC ranks as the fourth most common cancer overall, affecting men more than women (and ranking as the second most prevalent cancer among females) (3). Unfortunately, limited participation in screening programs and lifestyle changes are contributing to a concerning rise in CRC prevalence, incidence, and mortality rates in Iran (4).
Colorectal cancer’s significant health burden and potential for early detection make it an ideal candidate for screening programs (5). Early identification through screening allows for more manageable treatment and can significantly reduce mortality rates (6). The Iranian program, IraPEN, recommends CRC screening for individuals between 50 and 69 years old. While fecal immunochemical tests (FIT) and colonoscopies are the most common screening methods, other approaches are also available (7).
Many countries follow a two-step approach: An initial FIT followed by a colonoscopy if the FIT results are positive (8). While CRC screening options exist in Iran, many patients lack awareness of their cancer risk and available tests, often neglecting to consult a doctor (9). This highlights the importance of identifying factors influencing the intention to undergo CRC screening (4). Theories and models from health education can be valuable tools in pinpointing these factors (10). By identifying limitations in current screening programs, these models can guide interventions to improve CRC screening rates (11). Protection motivation theory (PMT) offers a particularly effective framework to understand and potentially modify behaviors related to cancer prevention and early detection (12, 13).
In 1975, Rogers developed the PMT based on the concept of value expectancy. This theory explains how fear influences health attitudes and behaviors, particularly how fear motivates specific choices. The PMT has become a widely used tool in health communication research to understand and predict behaviors related to health issues. The theory focuses on two key appraisal processes: Threat and coping. Threat appraisal examines the perceived severity and vulnerability of a health threat, as well as the potential rewards (both internal and external) for taking action. Coping appraisal, on the other hand, assesses perceived efficacy (including both the effectiveness of the recommended action and one’s belief in their ability to perform it) and the perceived costs associated with taking action (14). Thee PMT has been used in the development of several cancer screening tools, except those for CRC (15, 16).
Currently, there appears to be a lack of validated instruments specifically designed to assess the factors influencing CRC screening through the PMT. Developing a reliable and valid tool based on PMT subconstructs could significantly increase screening participation among high-risk populations.
2. Objectives
The present study aims to create a questionnaire grounded in these PMT subconstructs to evaluate the acceptability and key determinants of CRC screening for individuals aged 50 to 69.
3. Methods
3.1. Tool Development
To develop a questionnaire grounded in the PMT, the research team conducted a thorough review of existing literature, including textbooks and relevant studies. This review focused on knowledge, perceptions, and practices surrounding various non-communicable diseases (14, 17, 18). Based on a comprehensive literature review, established guidelines, and expert consultation, a 58-item questionnaire across eight factors was created: Perceived reward (7 items), response efficacy (6 items), fear (7 items), self-efficacy (8 items), perceived sensitivity (7 items), response cost (9 items), protection motivation (6 items), and perceived severity (8 items).
3.2. Study Design and Participants
This cross-sectional study recruited participants aged 50 - 69 from the Chaharmahal and Bakhtiari region of Iran, between July 15 and August 21, 2023. Individuals with a history of cancer or colorectal diseases were excluded. We used convenience sampling and collected data through direct, in-person interviews using a questionnaire.
3.3. Sample Size
In our study, we progressively recruited eight participants per question, resulting in a sample size of 250 for exploratory factor analysis (EFA) and another 250 for confirmatory factor analysis (CFA). This approach aligns with best practices in factor analysis, which recommend a minimum of 5 - 10 participants per question (19). Adherence to the STROBE checklist, a framework for robust cross-sectional study design and reporting, guided the development of this article (20). Following the STROBE checklist improved both the design and the reporting quality of this manuscript for cross-sectional studies. We precisely defined our study cohort, data sources, and outcome measures. Moreover, we clearly described the statistical methodologies used, how we managed potential sources of bias, and the limitations of this study. With these actions, we strive to improve clarity in our results and ensure their reproducibility.
3.4. Face Validity
Qualitative and quantitative methods were used to assess face validity. Ten participants commented on the difficulty, relevance, and ambiguity of responding to questions via interview in the qualitative assessment. In the quantitative assessment, the impact score (IS) of each item was measured. This score reflects both how important participants found the item (using a 5-point Likert scale: 1 = not suitable at all, 5 = completely suitable) and how many participants rated it highly (4 or 5). Items with an IS greater than 1.5 were considered acceptable (21).
3.5. Content Validity
To assess content validity, a panel of ten experts in health education, epidemiology, statistics, and gastroenterology was utilized. The scale’s content validity was evaluated through the use of the content validity ratio (CVR), Content Validity Index (CVI), and modified kappa statistic (K*). The CVI does not account for the possibility of chance agreement; therefore, the K* value was employed to correct the CVI (22). To assess content validity, each expert rated the necessity of each item on a 3-point scale (1 = not necessary, 2 = useful but not essential, 3 = essential). The CVR reflects the proportion of experts who deemed an item “essential”. A score exceeding 0.62 indicates acceptable content validity (according to Lawshe) (23).
The CVI assesses item relevance using a 4-point scale (1 = irrelevant to 4 = extremely relevant). Both the average CVI for individual items (I-CVI) and the overall scale CVI (S-CVI) were evaluated. A score of 0.78 or higher for I-CVI and 0.90 or higher for S-CVI suggests satisfactory relevance (24).
K* considers agreement beyond chance and incorporates both the CVI and the probability of chance agreement. Kappa values exceeding 0.75 indicate excellent agreement, scores between 0.60 and 0.74 suggest good agreement, and scores between 0.40 and 0.59 represent fair agreement (23).
3.6. Construct Validity
This study examined construct validity using EFA and CFA.
3.6.1. Exploratory Factor Analysis
The Kaiser-Meyer-Olkin (KMO) test assessed sample adequacy, while Bartlett’s test assessed variance homogeneity. The KMO test evaluates the adequacy of the sample for factor analysis. A KMO value greater than 0.5 is considered acceptable, indicating that the sample is suitable for factor analysis. Bartlett’s test checks whether the correlation matrix is significantly different from the identity matrix. A significant result (P < 0.05) suggests that factor analysis is appropriate. The ideal KMO value is greater than 0.70 (25).
A scree plot, principal axis factoring (PAF), and ProMax rotation were used to extract factors. Non-normal data justified the use of PAF (26). The formula for estimating the minimal acceptable factor loading value is:
Where n is the sample size and CV is the critical value for factor extraction (27). In this study, the calculated CV was 0.33. Finally, factor extraction was based on eigenvalues greater than 1 and communalities greater than 0.3 (28).
3.6.2. Confirmatory Factor Analysis
Confirmatory factor analysis is used to test the hypothesized factor structure and confirm whether the data fit the proposed model. CFA, using AMOS version 24, tested the extracted model's fit through the most standard model fit indices. Due to data non-normality, we ran the model using the Bootstrap method. Evaluation of model goodness of fit included the following criteria: Comparative Fit Index (CFI) > 95% considered good and > 90% acceptable; root mean square error of approximation (RMSEA) < 0.05 considered good and < 0.08 acceptable; Incremental Fit Index (IFI) > 95% considered good and > 90% acceptable; Parsimonious Normed Fit Index (PNFI) > 0.5 considered good; and discrepancy divided by degrees of freedom (CMIN/DF) < 3 considered good and < 5 acceptable (27, 29).
3.7. Convergent and Divergent Validity
We assessed the convergent and divergent validity of the extracted factors by estimating the average variance extracted (AVE), the maximum shared squared variance (MSV), and the composite reliability (CR). Convergent validity is established if CR is greater than AVE and AVE is greater than 0.5. Discriminant validity is confirmed if MSV is less than AVE (30).
3.8. Reliability
Reliability was assessed in two forms: Internal and external. For internal reliability, Cronbach’s alpha and McDonald’s omega (Ω) were used. External reliability was checked by the test-retest method. The correlation coefficient (Pearson’s r) was used to assess the test-retest reliability. A high positive correlation coefficient (closer to 1) indicates good test-retest reliability, meaning the scores on the test and retest are consistent. Additionally, a statistically significant P-value (less than 0.05) suggests that the observed correlation is not due to chance (31).
3.9. Normality
Univariate and multivariate normality were assessed using the Kolmogorov-Smirnov test and Mardia’s tests, respectively.
3.10. Ethical Consideration
The proposal for this study received approval from the Ethics Committee of Shahid Sadoughi University of Medical Sciences, with the ethical code IR.SSU.SPH.REC.1401.178. All participants in the study provided informed consent. Anonymity and confidentiality were assured to them.
4. Results
4.1. Characteristics of Participants
The participants’ mean age was 58.60 ± 5.48 years. Most of them (53.6%) were women, married (90.6%), illiterate (49.6%), and lived in rural areas (61.8%). Approximately 54% of them had incomes of less than 100 dollars per month, and 45.8% were housekeepers. More details are provided in Table 1, separately for EFA and CFA participants.
| Variables | Total (N = 500) a | EFA (n = 250) a | CFA (n = 250) a |
|---|---|---|---|
| Age (y); mean ± SD | 58.60 ± 5.48 | 58.64 ± 5.61 | 58.56 ± 5.37 |
| Gender | |||
| Male | 232 (46.4) | 114 (45.6) | 118 (47.2) |
| Female | 268 (53.6) | 136 (54.4) | 132 (52.8) |
| Residence | |||
| Urban | 191 (38.2) | 94 (37.6) | 97 (48.8) |
| Village | 309 (61.8) | 156 (62.4) | 153 (51.2) |
| Marital statues | |||
| Married | 453 (90.6) | 230 (92.0) | 223 (89.2) |
| Single/ divorced/ widow | 47 (9.4) | 20 (8.0) | 27 (10.8) |
| Education | |||
| Illiterate | 248 (49.6) | 122 (48.8) | 126 (50.4) |
| Lees than college | 230 (46.0) | 115 (46.0) | 115 (46.0) |
| College | 22 (4.4) | 13 (5.2) | 9 (3.6) |
| Income means (per mo); dollars | |||
| < 100 | 271 (54.2) | 133 (53.2) | 138 (55.2) |
| 100 - 200 | 205 (41.0) | 108 (43.2) | 97 (38.8) |
| > 200 | 24 (4.8) | 9 (3.6) | 15 (6.0) |
| Job | |||
| Unemployed | 45 (9.0) | 26 (10.4) | 19 (7.6) |
| Freelance job | 166 (33.2) | 78 (31.2) | 88 (35.2) |
| Employee | 33 (6.6) | 17 (6.8) | 16 (6.4) |
| Housekeeper | 229 (45.8) | 116 (46.4) | 113 (45.2) |
| Retired | 27 (5.4) | 13 (5.2) | 14 (5.6) |
Abbreviations: EFA, exploratory factor analysis; CFA, confirmatory factor analysis.
a Values are expressed as No. (%) unless otherwise indicated.
4.2. Face Validity
In the qualitative step, a panel of experts examined the level of difficulty, relevance, and ambiguity of the items. Based on the participants’ input, necessary corrections were made for several items. For example, items that were difficult to understand were reworded to make them clearer, ambiguous words were replaced with more precise ones, and questions not directly related to the study objectives were either deleted or reworded for better alignment. These changes aimed to make the tool more comprehensible and trustworthy. In the quantitative step, all items had an IS above 1.5, which was considered acceptable (Appendix 1 in Supplementary File).
4.3. Content Validity
The CVR for all items was greater than 0.62 and considered acceptable. In terms of content validity, necessary amendments were made based on the expert panel’s opinions. During the qualitative step, a panel of experts reviewed all items to ensure that they were relevant, clear, and aligned with the objectives of the study. Most items were revised based on the feedback obtained from pilot respondents. In light of the research questions being addressed, some items were reworded to reduce the possibility of misunderstanding. Additionally, less important items were either revised or removed to allow for the inclusion of new items that filled gaps identified in the tool. These changes ensured that the tool accurately measured what it was intended to measure and was easy to understand. The value of the S-CVI was 0.98, and the value of K* for all items was greater than 0.75. Details of the CVR, CVI (I-CVI and S-CVI), and K* are presented in Appendix 1 in Supplementary File.
4.4. Construct Validity
4.4.1. Exploratory Factor Analysis
The KMO value was 0.92, and Bartlett’s test value was 6674.18 (P < 0.001), indicating sampling adequacy. Using PAF and ProMax rotation, eight factors-perceived reward (7 items), response efficacy (6 items), fear (7 items), self-efficacy (8 items), perceived sensitivity (8 items), response cost (9 items), protection motivation (6 items), and perceived severity (5 items) - were extracted, explaining 57.25% of the total variance. In this step, two items (factor 8: Q1 and Q2) were removed due to cross-loading (Table 2).
| Factors | Factor Loading | h2 | Eigenvalue | Variance (%) |
|---|---|---|---|---|
| 1. Perceived reward | 7.717 | 13.036 | ||
| Q1. Not doing the FIT test screening will reduce my worries. | 0.768 | 0.638 | ||
| Q2. Not doing a colonoscopy will reduce my worries. | 0.775 | 0.621 | ||
| Q3. I will have more peace in life by not doing the FIT test screening. | 0.891 | 0.738 | ||
| Q4. By not having a colonoscopy, I will have more peace in my life. | 0.893 | 0.757 | ||
| Q5. Not doing CRC tests (especially colonoscopy) saves me money. | 0.637 | 0.475 | ||
| Q6. By not getting a CRC screening I will be more focused on my life. | 0.799 | 0.709 | ||
| Q7. I will be less stressed by not having CRC screening. | 0.821 | 0.758 | ||
| 2. Response efficacy | 6.761 | 11.379 | ||
| Q1. Performing screening (colonoscopy, FIT test) is effective in preventing CRC. | 0.809 | 0.671 | ||
| Q2. Early detection of CRC with screening (colonoscopy, FIT test) will reduce cancer growth. | 0.849 | 0.713 | ||
| Q3. Colorectal cancer screening (colonoscopy, FIT test) allows early diagnosis of this disease. | 0.831 | 0.700 | ||
| Q4. Early detection of CRC by screening (colonoscopy, FIT test) increases the chances of successful treatment. | 0.789 | 0.662 | ||
| Q5. Colorectal cancer screening (colonoscopy, FIT test) reduces the possibility of complications from this cancer. | 0.904 | 0.762 | ||
| Q6. Regular and timely screening of CRC provides the opportunity to detect cancer in the early stages. | 0.887 | 0.796 | ||
| 3. Fear | 4.656 | 7.532 | ||
| Q1. When I think about colon cancer, I get worried. | 0.703 | 0.519 | ||
| Q2. When I think about CRC, I can’t sleep or have disturbed dreams. | 0.763 | 0.578 | ||
| Q3. I get anxious when I think about colon cancer. | 0.805 | 0.669 | ||
| Q4. When I think about CRC, my heart beats faster. | 0.764 | 0.594 | ||
| Q5. The thought of CRC scares me. | 0.729 | 0.561 | ||
| Q6. I’m afraid the colorectal screening test will confirm my cancer. | 0.772 | 0.605 | ||
| Q7. The high cost of possible CRC treatment scares me. | 0.706 | 0.554 | ||
| 4. Self-efficacy | 4.189 | 6.722 | ||
| Q1. I can get CRC screening even if the doctor or health worker doesn’t give me much information. | 0.521 | 0.341 | ||
| Q2. I can get CRC screening even if the people around me don’t give me the necessary support. | 0.748 | 0.580 | ||
| Q3. I can get CRC screening even if my family doesn’t give me the necessary support. | 0.683 | 0.523 | ||
| Q4. I can get CRC screening even if it is hard to do. | 0.701 | 0.483 | ||
| Q5. I can get CRC screening even if spend a lot of time. | 0.781 | 0.612 | ||
| Q6. I can get CRC screening even if I have to pay for it. | 0.765 | 0.610 | ||
| Q7. I can get CRC screening even if be painful (colonoscopy). | 0.740 | 0.610 | ||
| Q8. I can get CRC screening even if I am very busy or I have a lot of work. | 0.684 | 0.510 | ||
| 5. Perceived severity | 3.725 | 5.925 | ||
| Q1. Colorectal cancer is a severe and dangerous disease. | 0.361 | 0.375 | ||
| Q2. Physical complications of CRC can be unbearable for me. | 0.621 | 0.510 | ||
| Q3. If I get CRC, I will have problems in terms of my job. | 0.819 | 0.613 | ||
| Q4. If I have CRC, I will have many problems. | 0.778 | 0.553 | ||
| Q5. If I get CRC, it will be difficult for me to continue living | 0.808 | 0.587 | ||
| Q6. Colorectal cancer can be fatal. | 0.600 | 0.409 | ||
| Q7. My family will suffer if I get CRC. | 0.716 | 0.596 | ||
| Q8. Colorectal cancer is a serious threat to my health. | 0.721 | 0.528 | ||
| 6. Response cost | 3.376 | 5.325 | ||
| Q1. FIT test screening is time consuming for me. | 0.598 | 0.370 | ||
| Q2. It is costly for me to have the FIT test screening. | 0.614 | 0.413 | ||
| Q3. Because doing the FIT test is disgusting, I don’t do it. | 0.631 | 0.413 | ||
| Q4. Colonoscopy screening is too time consuming for me. | 0.622 | 0.525 | ||
| Q5. It is costly for me to have the Colonoscopy screening. | 0.630 | 0.480 | ||
| Q6. Because during the colonoscopy, my genital area is seen by the examiner, I am embarrassed to do it. | 0.485 | 0.412 | ||
| Q7. Because CRC screening (colonoscopy, FIT test) and its results worry me and my family, I don’t do it. | 0.757 | 0.600 | ||
| Q8. There is no value in participating in the screening program (colonoscopy, FIT test) due to the lack of hope to cure this disease. | 0.611 | 0.482 | ||
| Q9. Because colon cancer screening needs to be repeated, it is difficult for me to do it several times. | 0.703 | 0.475 | ||
| 7. Protection motivation | 2.587 | 3.945 | ||
| Q1. I am going to do the FIT test. | 0.629 | 0.483 | ||
| Q2. I am going to do a colonoscopy. | 0.724 | 0.539 | ||
| Q3. I have planned to perform the FIT test screening. | 0.610 | 0.450 | ||
| Q4. I have planned to do screening colonoscopy if needed. | 0.764 | 0.585 | ||
| Q5. I decided to go to health and treatment centers every 2 years to perform FIT test screening. | 0.728 | 0.564 | ||
| Q6. I decided to do colonoscopy screening if needed. | 0.880 | 0.762 | ||
| 8. Perceived sensitivity | 2.328 | 3.383 | ||
| Q1. I am at risk of colon cancer (removed). | - | - | ||
| Q2. It is possible that I will get colon cancer in the future (removed). | - | - | ||
| Q3. I am confident that I will not get CRC. | 0.764 | 0.572 | ||
| Q4. I will not get CRC because I have no problem. | 0.858 | 0.695 | ||
| Q5. God will not, I will not get CRC. | 0.777 | 0.612 | ||
| Q6. Because no one in my family has CRC, I will not get this cancer either. | 0.731 | 0.584 | ||
| Q7. I don’t think about cancer at all. | 0.637 | 0.522 |
Abbreviations: FIT, fecal immunochemical tests; CRC, colorectal cancer.
4.4.2. Confirmatory Factor Analysis
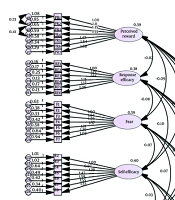
The 56-item tool was entered into CFA. As shown in Figure 1, to improve the model, five pairs of measurement errors were allowed to freely co-vary (e1 with e2, e3 with e4, e29 with e30, e38 with e39, e46 with e48, e48 with e51, and e52 with e53). In the next step, the indices calculated were as follows: CFI = 0.94, PNFI = 0.67, CMIN/DF = 2.22, RMSEA = 0.08, and IFI = 0.92. The model’s goodness-of-fit was confirmed by these indices. In this step, three items were removed due to their standardized factor loadings being less than 0.50 (Figure 1).
 screening based on the theory of protection motivation (n = 250)")
Confirmatory factors analysis of colorectal cancer (CRC) screening based on the theory of protection motivation (n = 250)
4.5. Convergent and Divergent Validity
The results of AVE, MSV, and CR confirmed that convergent validity was established for all factors except the response cost factor. Divergent validity was confirmed for all factors (Table 3).
| Dimension | CR | AVE | MSV |
|---|---|---|---|
| Protection motivation | 0.888 | 0.572 | 0.095 |
| Perceived sensitivity | 0.862 | 0.562 | 0.059 |
| Perceived severity | 0.897 | 0.526 | 0.177 |
| Perceived reward | 0.892 | 0.548 | 0.120 |
| Response cost | 0.846 | 0.456 | 0.120 |
| fear | 0.894 | 0.551 | 0.075 |
| Self-efficacy | 0.894 | 0.554 | 0.064 |
| Response efficacy | 0.943 | 0.734 | 0.177 |
Abbreviations: CR, construct reliability; AVE, average variance extracted; MSV, maximum shared squared variance.
4.6. Reliability
The reliability of this questionnaire was confirmed by McDonald’s omega and Cronbach’s alpha (α and Ω > 0.80). The details of the reliability analysis are presented in Table 4. The test-retest reliability analysis revealed good external reliability for perceived reward (r = 0.826, n = 30, P < 0.001), fear (r = 0.912, n = 30, P < 0.001), perceived sensitivity (r = 0.923, n = 30, P < 0.001), response cost (r = 0.826, n = 30, P < 0.001), and protection motivation (r = 0.917, n = 30, P < 0.001). These factors demonstrated strong positive correlations (r > 0.8) between the initial and retest administrations (P < 0.001), indicating that scores remained consistent and the observed relationships were not due to chance.
| Factors | Number of Items | Alpha (95% CI) | Omega |
|---|---|---|---|
| Perceived reward | 7 | 0.918 (0.901 - 0.932) | 0.918 |
| Response efficacy | 6 | 0.939 (0.919 - 0.955) | 0.939 |
| Fear | 7 | 0.895 (0.876 - 0.911) | 0.897 |
| Self-efficacy | 7 | 0.892 (0.868 - 0.910) | 0.890 |
| Perceived severity | 8 | 0.886 (0.869 - 0.909) | 0.893 |
| Response cost | 7 | 0.849 (0.822 - 0.871) | 0.849 |
| Protection motivation | 6 | 0.879 (0.855 - 0.897) | 0.881 |
| Perceived sensitivity | 5 | 0.873 (0.850 - 0.894) | 0.874 |
Moderate external reliability was found for perceived severity (r = 0.593, n = 30, P = 0.001), self-efficacy (r = 0.637, n = 30, P < 0.001), and response efficacy (r = 0.632, n = 30, P < 0.001). These factors showed positive correlations (r between 0.59 and 0.64) that were statistically significant (P < 0.001), suggesting some consistency in scores across administrations, although to a lesser degree compared to the first group.
4.7. Normality
The Kolmogorov-Smirnov test showed that there was no univariate normality (P < 0.001). Mardia’s tests indicated that there was no multivariate normality (Appendix 2 in Supplementary File).
5. Discussion
In this study, the CRC Screening Determinants Questionnaire based on the PMT was developed, and its validity and reliability were assessed. Face validity was confirmed through qualitative and quantitative analyses, leading to necessary corrections and acceptable ISs for all items. The CVR and S-CVI values indicated high content validity. Construct validity was examined using EFA, which identified eight factors explaining a significant portion of the variance. The CFA confirmed the goodness-of-fit of the model. Convergent and divergent validity were established, and the reliability of the questionnaire was found to be very good. Overall, the questionnaire demonstrated satisfactory validity and reliability, making it a suitable tool for future research in this field.
The study employed PMT to create a robust theoretical framework for the prediction of psychological concepts such as self-efficacy, perceived sensitivity, perceived severity, and protection motivation. This approach is similar to that employed by Weller et al., who examined intentions, attitudes, and beliefs regarding CRC prevention (32). However, the present study integrates these concepts into a composite instrument that differs from the original.
Wolf et al. aimed to create a questionnaire to measure knowledge and attitudes regarding CRC screening but did not use the extended theories of PMT nor explore some of the psychological determinants of screening behavior (33). Additionally, while Altomare et al. examined biomarkers such as VOCs for CRC diagnosis, the current study differs in that it is psychological and behavioral in orientation (34).
The research titled "Screening Intention Prediction of CRC among Urban Chinese Based on the Protection Motivation Theory" shares similar assumptions with this study but differs in the type of population studied (18). It focused on more urban populations with higher income levels, whereas the current study was conducted among rural, low-income populations. This brings valuable diversity to the application of PMT in studies of CRC screening.
The tool developed in this study demonstrates good psychometric characteristics. It is highly content valid (CVR > 0.62, S-CVI = 0.98) and highly reliable, as indicated by Cronbach’s alpha and McDonald’s omega estimates greater than 0.80. These results are in line with those reported by Wolf et al., which also indicated high reliability levels (33). Additionally, the use of sophisticated statistical procedures, including CFA, in this study significantly enhances validity testing.
The French qualitative study examined why individuals do or do not receive CRC screening (35). The present study, however, employs quantitative methods to design a validated measure that identifies which activities are associated with specific behaviors. This study also identified eight psychological factors through EFA and verified a good model fit (CFI = 0.94, RMSEA = 0.08), indicating that it is methodologically stronger than the qualitative study.
The majority of participants in the present study had high levels of illiteracy (49.6%), lived in rural settings (61.8%), and faced financial challenges (54% earned below $100 monthly), with an average age of 58.6 years. This group differs considerably from the educated, affluent, and urbanized sample studied in the urban Chinese study (18).
The population targeted by Wolf et al. consisted of United States veterans (33). This population is likely to be more educated and have better access to healthcare than the participants in the current study. The same was true for the French qualitative study, which sampled a population with better healthcare access (35). However, the current study can be particularly useful for rural populations, and it addresses an important area of research that must be conducted.
The results of this research indicate that the questionnaire is valid and reliable. Therefore, it can serve as an effective instrument for assessing CRC screening practices among individuals in need of further assistance. Unlike the study by Altomare et al., which focused on diagnostic biomarkers, this instrument can be applied in educational interventions as well as in evaluating the success of behavior change programs aimed at enhancing CRC screening (34).
The French qualitative study also provided information on participation barriers (35). That study offers a straightforward tool that not only identifies the barriers but also investigates motivation and psychological issues. In contrast to the study by Wolf et al., which focused only on knowledge and attitudes, the present study incorporates considerations of motivation and protection thoughts (33). This approach is more appropriate for research and public health practice.
Cultural factors can influence the emphasis placed on different aspects of the PMT model (36). This questionnaire targets a specific population in Iran: Individuals aged 50 - 69 who have been eligible for free CRC screening (via FIT test) at health centers since 2011 (37). Due to sustained public health efforts and healthcare worker education about the benefits of early detection, this age group might have a heightened awareness of the potential benefits associated with screening, such as early diagnosis (38).
However, in the context of the PMT model, "perceived reward" refers to the benefits individuals perceive from avoiding the screening behavior, such as comfort, the avoidance of anxiety, or the saving of time and costs. Cultural factors, such as societal views on health and personal privacy, may influence how individuals weigh these perceived rewards. For instance, in some cultures, there may be a stronger emphasis on avoiding inconvenience or discomfort, which could make individuals more likely to perceive avoiding screening as a reward.
Similarly, "response costs" in PMT refer to the perceived barriers or costs associated with engaging in protective behavior. In cultures where there is limited access to healthcare or where the screening process is perceived as time-consuming or burdensome, individuals may perceive the response costs as higher, thus reducing their willingness to participate in screening programs.
This cultural context could explain why "perceived reward" and "response costs" were given significant weight in our study findings, as these cultural and personal factors may influence participants despite public health education efforts.
Concerns about developing the disease and the screening process itself can motivate self-care behaviors (39). Since this age group has greater awareness of CRC, they might experience a heightened fear of contracting the disease and its potential complications. These anxieties could serve as a motivator for undergoing the screening test. Since the FIT test is available free of charge at health centers for the target population, perceived response costs might be more important in this study (40).
This study offers a reliable and valid tool to assess CRC screening behavior in individuals aged 50 - 69. It adds to the growing field of research that uses well-established theories to evaluate cancer screening instruments. Moreover, it emphasizes the importance of considering cultural factors and specific contexts when developing and testing these tools.
Our study has limitations. Firstly, it focused on individuals aged 50 - 69, so the results may not be generalizable to other age groups. Secondly, this study was performed in Iran, and cultural and contextual factors specific to this region might have influenced the findings. Finally, while PMT proved valuable in understanding CRC screening behavior, other theoretical frameworks could offer additional insights into this complex behavior.
The CRC Screening Determinants’ Questionnaires can be valuable tools for understanding health behaviors related to screening (41). This study aimed to fill a gap in existing research by developing a questionnaire specifically designed to assess CRC screening behavior through the lens of PMT. The validation process confirmed that the questionnaire possesses sufficient reliability and validity for measuring factors influencing CRC screening decisions.
5.1. Conclusions
This study evaluated the Persian version of the CRC Screening Tool among individuals aged 50 - 69 using PMT as a framework. The results confirm the tool's validity and reliability for this target population. As PMT is a well-established framework for understanding factors influencing CRC screening, this tool has the potential to significantly improve screening rates and reduce the disease burden in Iran. Further research is needed to validate these findings and explore the applicability of the tool in different populations and contexts.
