1. Introduction
Cities and towns are characterized with dense population and traffic together with industrial activities. Therefore, they are exposed to high levels of contamination and in sequence hazardous effects. Awareness and control of air pollution in these locations is very important and difficult. Generally, for particulate with primary or secondary origin, study of the concentration of particles is necessary to identify the source and process of their formation (1-3). Particles larger than 10 µm are inhalable but do not penetrate the respiratory system depth. These particles create problems for the upper respiratory tract. Generally, these particles have led to a great concern on the terrestrial environment at local, regional and global scale (4, 5). Settle able particles usually have aerodynamic diameters of more than 10 µm (6). Dust fall, affects not only the air quality of cities, but also public health (7). Dusts and dust fall can lead to diseases such as tonsillitis, allergy, daily pneumonia, asthma and eye irritation (8-10). Dust events have been seen as a risk factor for daily hospitalization for respiratory and cardiovascular diseases (9, 11, 12). Therefore, the study of characteristics and permanent and temporary variations of dust fall is important. Compared to particulate matter, permanent and temporary variations of dust fall is more sensitive to climate conditions and atmospheric emissions (13). In a study by Yongxian et al (2008), they researched the transportation and precipitation of aerosols during the passage from the Pacific Ocean. They proved that the passage of particles can lead to plankton mass increase (14). In a study by Qiongzhen et al. (2011), 21 dust event days (DS), from March-May in 2006, March-April in 2007, April in 2008 and 61 nondust days (NDS) were researched. In NDS, the daily concentration of TSP ranged from 25.0 to 369.1 μg/m3. The average concentration was 160.3 μg/m3, higher than the health-based national air quality standard of 120 μg/m3. The average TSP concentration in DS was 591.0 μg/m3 (ranging from 104.3 to 1464.3 μg/m3), 3.7 times of that in NDS (15). In a study conducted by Yongxiang et al. (2009), the results showed that dust storms occur with high frequency and raise dust particles into the troposphere from the ground level to a height of 5–9 km to modulate the hydrologic cycle in the TP. There are significant negative correlations between dust aerosol and precipitation in the dust source regions during the period of both 40 and 200 years (16).
Based on environmental monitoring data in 93 major cities and meteorological records at 398 weather stations in China from 1981 to 2007, total suspended particle (TSP) concentration, the intensity of dustfall, and sand and dust storm frequency (Fd) were analyzed. Annual average intensity of dustfall (Id) was 240.5 t km_2 a_1, decreased from northern to southern China and from inland to the coast areas with the maximum value of 717.2 t km_2 a_1 in Baotou. In the 1980s, 1990s and 2000s, annual average Ids were 334.8, 220.9, and 146 t km_2 a_1 respectively. Annual average Id in the Loess Plateau region was commonly higher than 200 t km_2 a_1. Annual average Id had a positive linear association to annual average CTSP (R2 = 0.96). Simultaneously, the intensity of dustfall was consistent (R2 = 0.94) with Fd. Sand and dust storm might be a major factor affecting the temporal variability and spatial distribution of TSP and dustfall in China (17).
Pakseresht and Naddafi et al (2006) measured the amount of dust fall in Tehran University in 1975 and Yazd (Iran) in 2005, respectively. Variation of particles was determined as a function of the size distributions (18, 19). Imandel et al. (1981) investigated the anion content of dust fall in Tehran. This study showed that the inhalable constituent of airborne dust have adverse effects on human health (20). During the last years, air quality of Kerman city has been deteriorated due to urban and industrial development as well as population growth. Kerman city is located in southeast of Iran (Latitude 30°15´ N, Longitude 56°58´W) and its altitude is 1753.8 m above the sea level. Kerman is surrounded by vast desert and is characterized with dry weather and occasionally dust storms.
2. Objectives
The aim of this study was to evaluate the dust fall events in Kerman city as an arid region.
3. Materials and Methods
3.1. Instruments
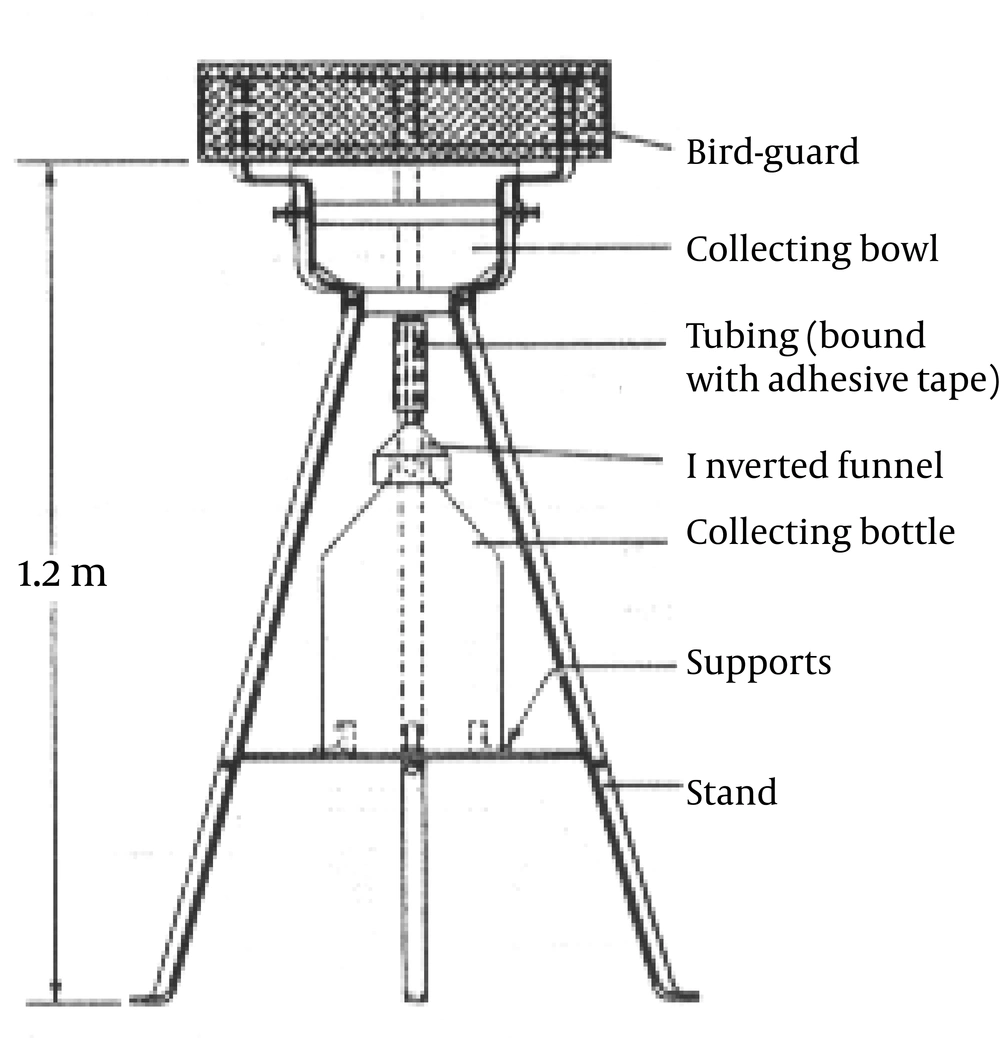
This study was performed by British Jar Test assembly method. Figure 1 has shown British Standard (BS) dust fall sampler set up (21).
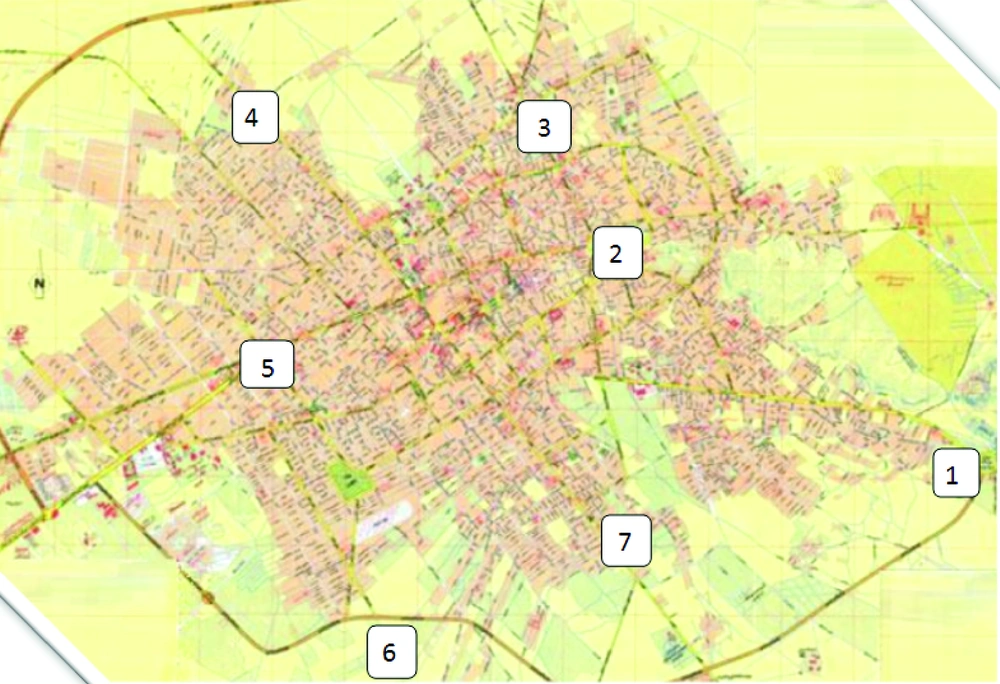
The sampling stations were located at seven spots of Kerman city which are shown in Figure 2. The height of jar containers was 3 m above the ground. The sampling stations were selected based on the ASTM (D1739-94) standard test method for collecting and measuring the dust fall (22, 23).
3.2. Analyses of Dust Fall
The meteorological parameters including the mean wind speed and the wind direction were obtained from the Kerman Meteorological Department. Forty two dust fall samples were monthly collected during 6 months (May-November, 2009). The collected dust was analyzed in the laboratory for soluble and insoluble, volatile and fix fraction.
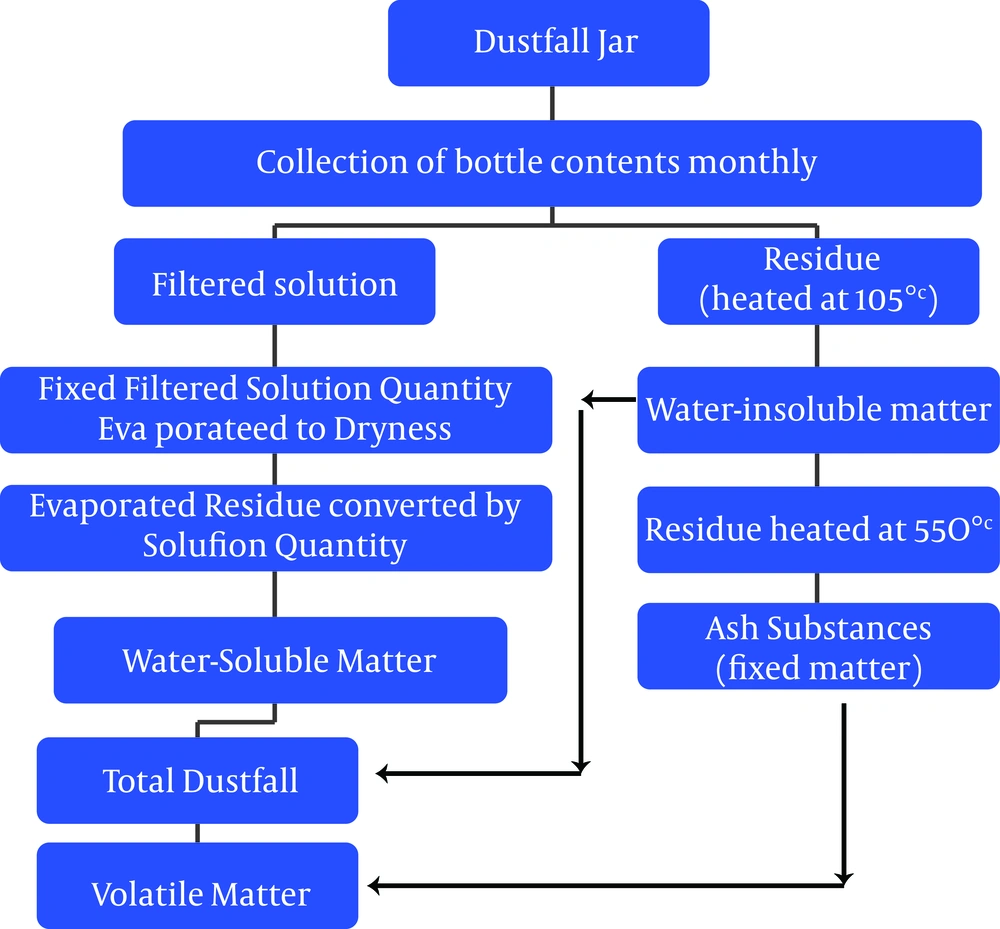
The loaded filters were gravimetrically analyzed. The dust fall amount was determined by subtracting the weight of the filters before and after the sampling periods. All test methods have been taken from the ASTM guideline and Air Sampling Method and Analysis book (8, 9). Jar containers (cylindrical plastic vessels) with standard dimensions (20cm diameter and 40cm height) were filled with distilled water with EC < 1 (based on standard ASTM D 1193) and sealed in a laboratory and opened in sampling points. The volume of water was measured by a graded cylinder at sampling points. If necessary, antifreeze, algaecide and fungicide were added to the jar container before putting at the sampling points. After one month, the containers were closed and returned to the laboratory. The collected samples were dried in crucible at 105 ˚C for determining insoluble and soluble fraction. The detailed protocol of deposited dust analysis is shown in Figure 3 (22, 23).
3.3. Calculation
Equation 2.3.1:
The following equation was used to calculate the total dust fall concentration (TDF):
TDF = SDF + INSDF / A
TDF: Total dust fall Concentration (g/m2.month)
A: Opening cross section of dust fall container (m2)
Equation 2.3.2:
The total fix (TFDF) and volatile (TVDF) dust fall were calculated based on the following equations:
TFDF = (w4 - w3) / A
TFDF: Total fix dust fall concentration (g/m2.month)
w4: filter weight with insoluble matter and crucible after heating at 550 (gr)
w3: filter weight with insoluble matter and crucible after heating at 105 (gr)
Equation 2.3.3:
TVDF = TDF - TFDF
TVDF: Total Volatile Dust Fall concentration (g/m2.month)
The Spearman and Pearson correlation were used to analyze the data by SPSS software. The correlation between variation of dust fall concentration and humidity, temperature, wind speed and precipitation as well as the correlations of fix and volatile fraction with the dust fall concentration was surveyed. On the other hand, One Way-ANOVA Test was used to compare the mean of dust fall at different sampling periods and points.
4. Results
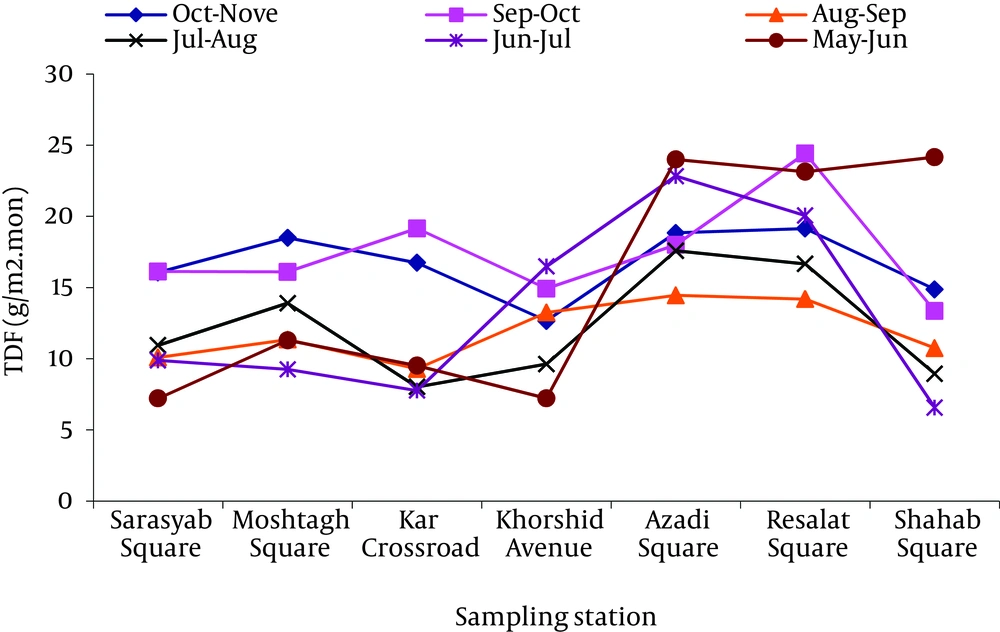
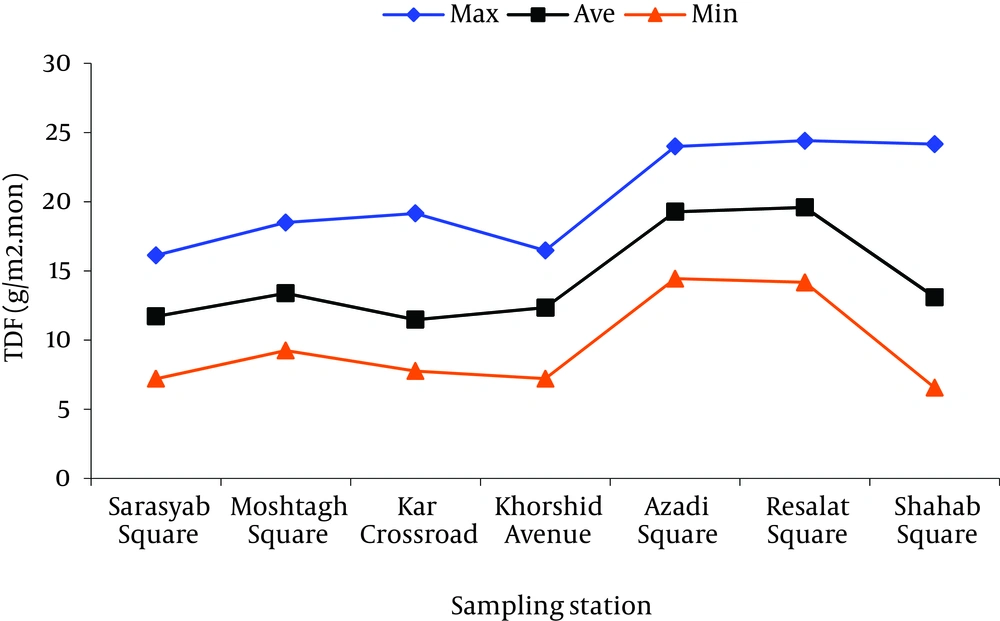
Results obtained for dust fall concentration in different sampling periods are shown in Figure 4. According to Figure 4, the maximum monthly concentration of TDF belonged to the fifth period (Sep-Oct) at Resalat Square which was 24.42 g/m2.mon. The minimum monthly concentration of TDF belonged to the second period (Jun-Jul) at Shahab Avenue station which equaled 6.56 g/m2.mon.
Figure 5 illustrates the maximum, minimum and mean of dust fall at different sampling stations. According to Figure 5, the average of monthly concentration of TDF had its maximum in the fifth period (Sept-Oct) which was 17.44 g/m2.mon. The average of monthly concentration of TDF had its minimum in the fourth period (Aug- Sep) which was 11.9 g/m2.mon. TDF average concentration in the 6 month period of taking sample was 14.41 g/m2.mon.
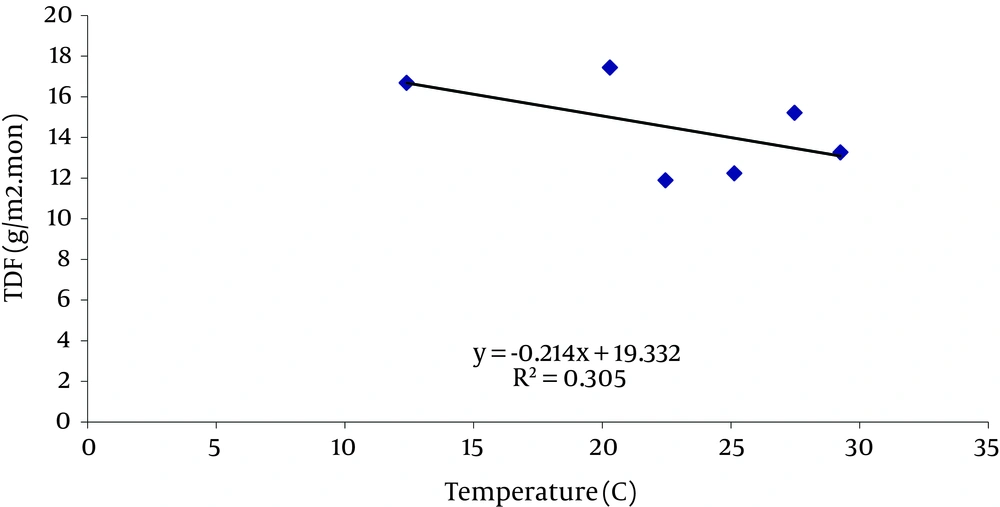
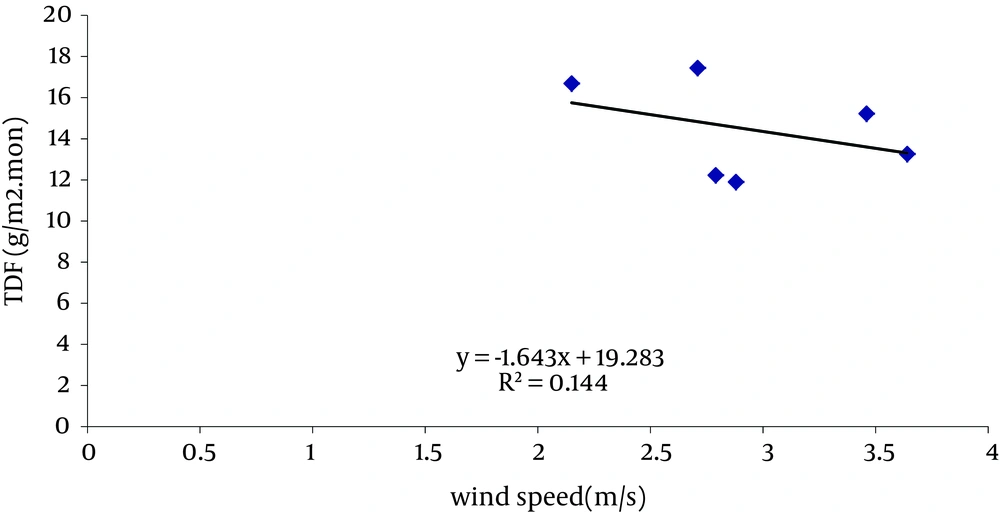
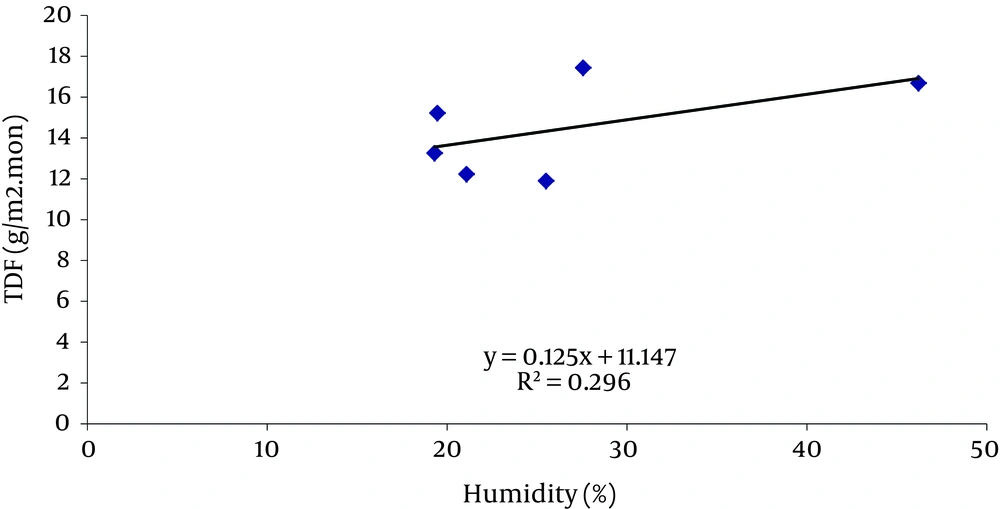
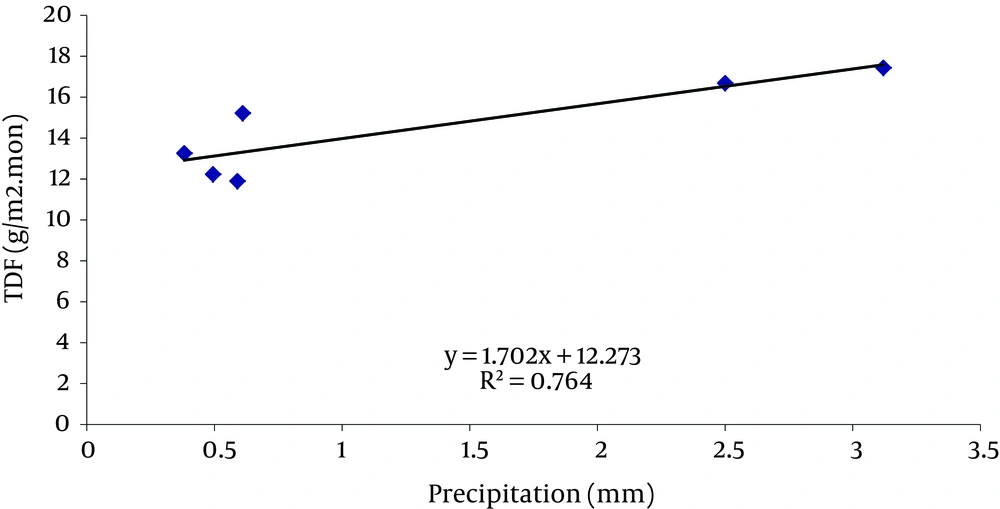
According to the average concentration of TDF in different stations and analyzing them with One –Way ANOVA test (P-value = 0.04, P-value < 0.05), It was shown that there is a significant difference in the confidence limits of 95% between the TDF values in different stations. The results of calculated correlation coefficient (Spearman) between the TDF concentration and metrological parameters such as; temperature, wind speed, humidity, precipitation are shown in Table 1. According to Table 1, the correlation between TDF concentration and precipitation is significant, but between TDF concentration and humidity and temperature and wind speed is not significant.
| Correlation | R | P-value |
|---|---|---|
| Dust Fall Concentration | ||
| Temperature | -0.429 | 0.256 |
| Wind Speed | -0.38 | 0.458 |
| Humidity | 0.429 | 0.264 |
| Precipitation | 0.771 | 0.023 |
The correlation coefficient values between the TDF concentration and metrological parameters are shown in Figures 6, 7, 8 and 9.
By calculation the multivariable regression between the TDF concentration and metrological parameter,
TDF = 0.0323 Tem + 0.096 Humi + 2.59 Precipit + 0.087 wind speed -2.2
Based on the results, it can be observed that 58.38% of the TDF in the total sampling periods is related to the soluble dust fall fraction and 41.62% to the insoluble dust fall fraction. 62.2% of the TDF in the total sampling period is related to the volatile fraction and 37.8% to the fixed fraction. Cluster analysis calculation based on the dust fall concentration between groups of sampling period time was shown in Figure 10. From 6 month of sampling, the periods 2, 3 and 4 (June-July, July-Aug, Aug-Sep) were put in one cluster and periods 1, 5 and 6 (May-June, Sep-Oct , Oct-Nov) in another.
5. Discussion
According to the data obtained from this research, the average concentration of dust fall in overall 6 periods of sampling was 14.41 g/m2.mon. Based on Table 2, values obtained in Tehran (1981), Tehran (1975) (19), N-NW in India (24), Negev desert (25) and California (26) were more than amounts obtained in Kerman. The amounts of dust fall in studies performed by Nadafi, et al. (2005) in Yazd (18), Lanzhou in west of China (27), eastern south of California and south of Nevada during 1984- 1989 (26), south of California, Arizona in 1991 and in Lubbock in Texas during 1997-2002 (28) were less than the reported amounts in Kerman. In one study in an opencast coalmine area in Bina of India, the most annual amount of dust fall was 96.2 ± 3.6 g/m2.mon (29). In a study by Wangquan et al. in 2004 in Gansa province of China, the amount of dust fall was 18.23 – 69.34 ton/km2.month (30). In another study by Midelton in 1997 in Sub-Saharan region, the amount of dust fall was 0.3 – 16.7 ton/km2.month (31) which was more than the amounts obtained in Kerman. Total emissions of eastern Asia were 10.4 ×10⁶ ton/year for PM10, 27.6 ×10⁶ ton/year for PM30 and 51.3 × 10⁶ ton/year for PM50 (32).
| Author | Year of Publication | Location of Study | Dust Fall Concentration (g/m2.mon) | Current Study Dust Fall Concentration (g/m2.mon) |
|---|---|---|---|---|
| Malakootian , et al. | 2013 | Kerman city | 14.41 | |
| Imandel, et al. (20) | 1981 | Around Tehran University | 16.85 | 14.41 |
| Pakseresht , et al. (19) | 1975 | Eastern South | 17.257 | |
| Pakseresht, et al. (19) | 1975 | West Areas | 17.97 | |
| Yadav, et al. (24) | 2006 | India | 21 | |
| Offer, et al. (25) | 2001 | Negev Desert | 17 | |
| Reheis, et al. (26) | 1995 | California | 30 | |
| Nadafi, et al. (18) | 2006 | Yazd | 6.486 | |
| Liu, et al. (27) | 2004 | Lanzhou | 11.08 | |
| Reheis, et al. (26) | 1995 | South of Nevada | 0.358 - 1.308 | |
| Crabtree , et al. (28) | 2005 | California | 0.385 - 2.825 | |
| Crabtree, et al. (28) | 2005 | Arizona | 4 | |
| Crabtree, et al. (28) | 2005 | Lubbock in Texas | 8.558 | |
| Pandey, et al. (29) | 2008 | Bina of India | 96.2 ± 3.6 |
By using one-way ANOVA analysis, it was appeared that there is a significant deference between dust fall concentrations for various sampling stations. The highest concentration was observed in Resalat station and the least in Shahab Avenue (P = 0.04). In a study performed by Nadafietal, there was no meaningful deference between concentrations of dust fall in various sampling stations. The high concentration of Resalat station is probably due to the vicinity of ring way road and transportation and also the vicinity to margin, dry and arid areas of city.
By using the one-way ANOVA analysis, it was appeared that there is a meaningful deference between various times of sampling. The highest concentration was corresponded to the fifth period (Sept-Oct) and the least was related to the second one (Jun-Jul) (P = 0.013). In a study performed by Nadafi, et al. there was a meaningful deference between various times of sampling. A high concentration of dust falls in the fifth period was presumably due to the start of educational programs, and therefore an increase in transportation. Emissions of vehicles, resus pension of dust and particles along with road traffic, in urban areas are the most important manmade sources of particles. Air pollution levels may be more in vicinity of emission sources such as roads, power plants and big stationary sources. Therefore, to protect people living in these areas, special measurements may be required to decrease the amounts of air pollutants up to agreement with guidelines. The Spearman correlation factor between dust falls in air of Kerman city and air temperature (r = -0.429), indicates the invert association between them. It means that when temperature increases, the amount of dust fall decreases and vice versa. This matter cannot be universalized to the society and specified areas (P = 0.256). In a study, performed in an open air mine in Bina of India, no meaningful association was observed between dust falls and temperature (29). According to another study in north of China with semidry climate, temperature was meaningfully and negatively related to dusts frequency in a decade scale (32). In a study which was performed in Yazd city, no meaningful association was observed between dust falls and temperature. The Spearman correlation factor between dust falls in air of Kerman city and humidity of air (r = 0.429) indicates the direct association between them. It means that the increase of each one increases the other, and the opposite is true. This matter cannot be universalized to the society and specified areas (P = 0.264). In a study which was performed in Yazd city, a negative meaningful association was observed between dust falls and humidity.
The Spearman correlation factor between dust falls in air of Kerman city and falls (r = 0.771), indicates the direct association between them. It means that the increase of each one, increases the other, and opposite. This matter cannot be universalized to the society and specified area (P = 0.023). In a study which was performed in Yazd city, a negative meaningful association was observed between dust falls and falls. In another study in north of China with semidry climate, falls were meaningfully and negatively related to dusts frequency in a decade scale (32). In another research, performed in an open air mine in Bina of India, a strong invert association was observed between dust falls and fall (29). No rainfall was accrued during the sampling period in Kerman city; so long term data of meteorological was used to calculate the correlation factor. Perhaps the reason of this positive association is inadequate distribution of rainfall in Kerman city.
The Spearman correlation factor between dust falls in air of Kerman city and wind speed (m/s) (r = -0.38), indicates the invert association between them. It means that when one increases, the other decreases and opposite. This matter cannot be universalized to the society and specified area (P = 0.458). Perhaps the reason of negative association between dust falls and wind speed is high diameter of particles which results in quick settling in stable climate and when wind blows very speedy, particles exit from urban areas with wind. In the study about Yazd city, a direct and meaningful association was observed between humidity and concentration of dust falls.
6. Conclusions
To sum up, there was no significant association between variables such as temperature, humidity, wind speed and dust concentration, but a significant association was observed between precipitation variable and dust concentration. One –Way ANOVA Test demonstrated meaningful difference between mean of the TDF values in different stations and sampling periods.
Finally this point is important which using British Standard (BS) dust fall sampler is applicable and useful for desert regions such as Kerman city. And British Standard (BS) sampler described in BS 1774 (British Standards Institution 1969) recommend for the desert regions.
