1. Background
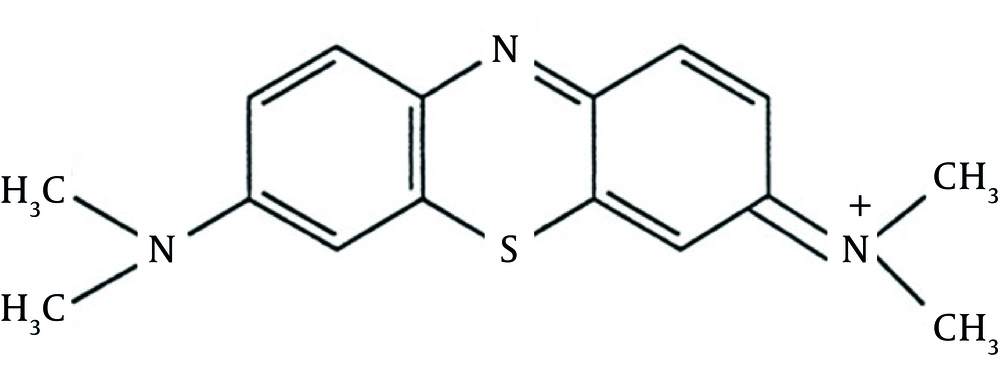
Industrial wastewater is considered as one of the major pollutants of the environment (1). Moreover, textile industries are among each country’s basic industries and have colored wastewater due to making use of colored materials (2). Overall, colored wastewater is produced by various industries, such as textile, dyeing, pharmaceutical, food, cosmetics and healthcare, paper, and leather industries. Such colors not only change the water’s color, which is important regarding aesthetics, but they also prevent light from penetrating through water, disturb photosynthesis, and destroy the aquatic ecosystem as well as several aquatic species (2, 3). One of the high consuming materials in the dye industry is Methylene Blue (MB) which is used for cotton and silk painting (4). Chemical structure of MB is illustrated in Figure 1 (3). Up to now, a great number of methods have been proposed in order to remove dyes from the industrial wastewater among which adsorption is the most acceptable due to its cost effectiveness and its capability to be used in large scales (5).
The methods of color removal from industrial effluents include biological treatment, coagulation, flotation, adsorption, oxidation and hyper filtration (3, 4, 6, 7). Among the treatment options, adsorption has been found to be superior to other techniques for water treatment in terms of initial cost, simplicity of design, ease of operation and insensitivity of toxic substances (7). Different adsorbents have been used for the removal of various materials from aqueous solutions, such as dyes, metal ions and other organic materials including perlite (4, 6-8), bentonite (9), silica gels (10), fly ash (11), lignite (11), peat (12), silica (13), etc. Among these natural materials, pumice which is a volcanic stone has a low weight and a porous structure (up to 85%) and can be found in many regions of the world. Because of its micro-porous structure, pumice has a high specific surface area, which is advantageous since it allows avoidance of the preliminary step of calcinations, a high energy cost step, and can float in water owing to its low density. Recently, many researchers have used pumice for removal of cadmium (14), disinfection by-products (15), heavy metals (16), sulfur dioxide (17) and azo dye (2).
2. Objectives
Due to several advantages of the pumice stone and its accessibility in Iran, the aim of the present work was to investigate its effectiveness for the removal of MB at various experimental conditions. Since initial pumice has some impurity, shows low sorption capacity and is negatively charged (2), the acidic treated pumice was used in this work. Therefore, the purpose for acidic treatment of pumice was to improve the positive surface charge of adsorbent and its sorption capacity since initial pumice shows low sorption capacity. The present study aims to use modified Pumice stone for removing MB dye from aqueous solutions.
3. Materials and Methods
3.1. Instruments and Reagents
Stock solution was prepared by dissolving the required amount of MB in double distilled water. The test solutions were prepared by diluting stock solution to the desired concentrations. The concentration of the MB was determined at 620 nm. The pH measurements were done using pH/Ion meter (Metrohm model-827, Swiss) and adsorption studies were carried out on DR-5000 spectrophotometer (HACH, U.S.A). All chemicals included NaOH, HCl and MB with the highest available purity and were purchased from Merck, Darmstadt, Germany. All solutions were stirred on a hotplate and stirrer (JENWAY, model-1000, U.K).
3.2. Adsorbent Features
Pumice, foam, firefighting foam and pumicite are siliceous glasses which are mostly light color and are usually created through the accumulation of volcanic flows. In the present experimental study, pumice samples as adsorbents were gathered from Ghorveh, Kurdistan, Iran. The chemical structure of this stone is presented in Table 1 (2, 14, 17). As Table 1 depicts, silicon and aluminum oxides comprise a major part of the utilized adsorbent, which shows the high capability of this adsorbent for absorption process as well as ion exchange.
| Chemical Composition | Percent |
|---|---|
| SiO2 | 69.75 |
| Al2O3 | 12.43 |
| Fe2O3 | 1.88 |
| CaO | 1.70 |
| MgO | 0.12 |
| NaO2 | 3.58 |
| K2O | 4.47 |
| TiO2 | 1.54 |
| Other | 4.53 |
3.3. Preparing the Adsorbent
At first, pumice mineral cartridge was washed several times by de-ionized water in order to remove the primary impurities. Next, the mineral cartridge was placed in HCl 1 N for 24 hours for increasing the adsorbent’s porosity. Afterwards, the mineral cartridge was washed several times by de-ionized water and this was continued until the effluent’s turbidity reached below 0.1 NTU. Finally, the prepared sample was grinded and mesh 20 with the effective size of 2 mm was utilized as the adsorbent.
3.4. Adsorption Study
To study the effect of important parameters like the pH, contact time and initial dye concentration on the adsorptive removal of MB, batch experiments were conducted. For each experimental run, 50 cc of different concentrations of the dye solution (30 - 60 mg/L) was agitated with 0.2 g of the adsorbent at 100 rpm until the equilibrium was achieved. Samples were withdrawn at different time intervals (0, 5, 15, 30, 60, 90 and 120 minutes for MPS) and kinetics, isotherm and other parameters of adsorption was determined by analyzing the remaining dye concentration from aqueous solution. In order to evaluate the effect of the initial pH on MB adsorption, the equilibrium study was conducted at different pH levels 3, 5, 7, 9 and 10, and other equilibrium studies were continued at the optimum pH = 10. The pH of the solutions was adjusted by adding 0.1 N aqueous solution of NaOH and HCl.
The percentage removal of dye was calculated using the following equation (1, 18):
1) %MB Removal = (C0 - Ct) / C0 × 100
Where C0 (mg/L) and Ct (mg/L) are the initial dye concentration and dye concentration at time t, respectively. When the system reached the equilibrium concentration, the equilibrium adsorption capacity was calculated through the following equation (2, 19):
2) qe = v (C0-Ce)/w
In this equation, qe (mg/g) represents the rate of the adsorbed dye per mass unit of the absorbent, C0 (mg/L) and Ce (mg/L) are initial and equilibrium dye concentrations, respectively, and v (L) and w (g) are the volume of the dye solution and the weight of the adsorbent, respectively.
4. Results
4.1. The Effect of pH on Removal Efficiency
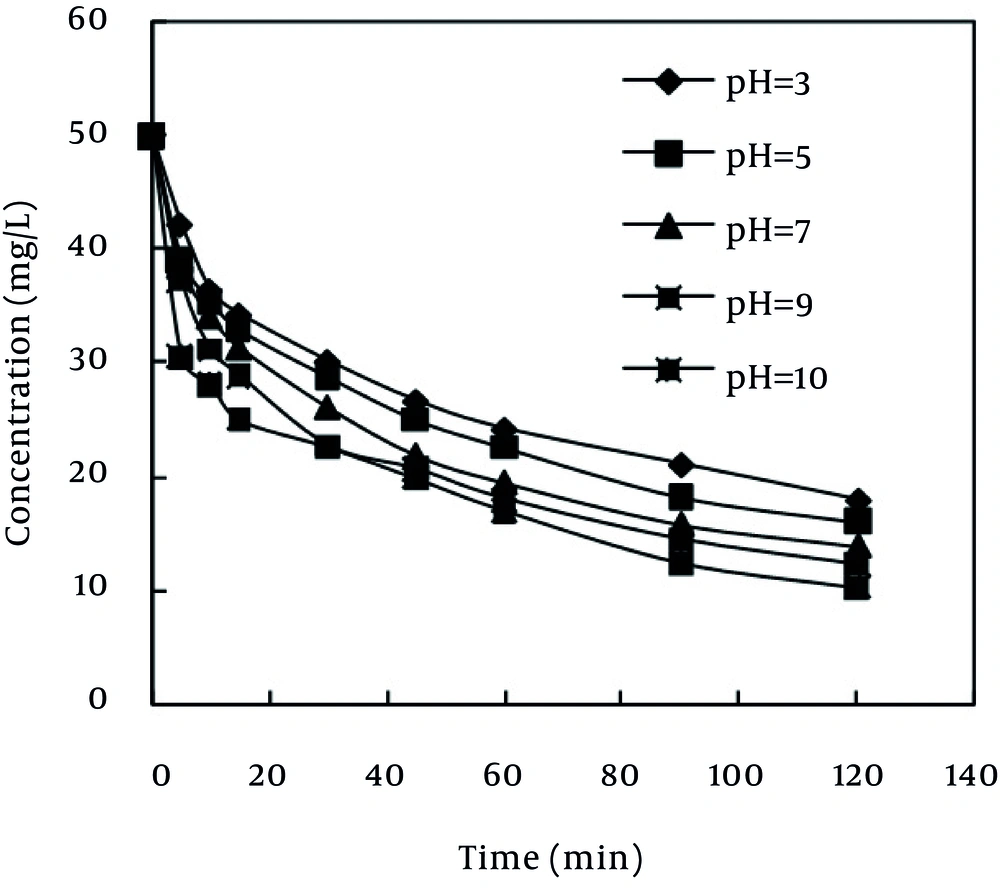
Solution pH affects both aqueous chemistry and surface binding sites of the adsorbents. The effect of initial pH on adsorption of MB was studied from pH 3 to 10 at initial MB concentration of 50 mg/L, adsorbent dosage of 0.2 g and contact time of 120 min. Two possible mechanisms of adsorption of MB on the MPS adsorbent may be considered include: (a) electrostatic interaction between the adsorbent and the MB molecule, (b) a chemical reaction between the MB and the adsorbent. When pH increases, the concentration of OH¯ ions in the desired solution is increased, as well. This causes the surface of the MPS to become deprotonated and, as a result, the negative charge of the used MPS surface will be amplified. Therefore, the electrostatic attractive force between the MB dye, which has a positive charge, and the adsorbent surface increases, and consequently, the rate of dye adsorption increases, as well (20). As Figure 2 depicts, as the pH of the solution increased from 3 to 10, the rate of removal also increased, which is consistent with the results obtained by El-Qada et al. (21), Chen et al. (22), and Karagoz et al. (23).
4.2. The Effect of Contact Time on the Removal of MB Dye
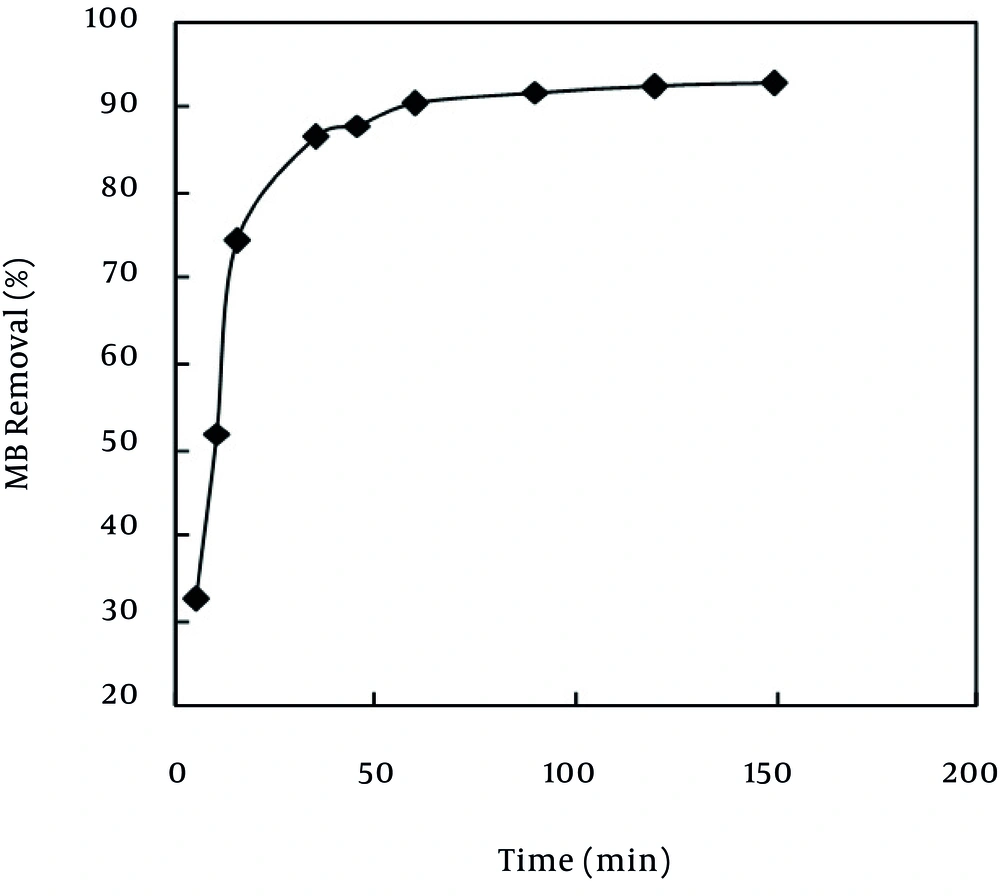
Generally, diffusion of the adsorbate on the used adsorbent and ultimately the adsorption phenomena on the adsorbent are time consuming processes (24). The adsorption rate, obtained for MB adsorption on MPS was observed by decrease of the concentration of MB within the adsorption medium with contact time. The time necessary to reach the equilibrium for the removal of the MB molecules at different concentrations (30 - 60 mg/L) by MPS from aqueous solution was established to be about 120 minutes. As Figure 3 shows, at all the used concentrations, as the contact time between the adsorbent and the adsorbate increased, the adsorption rate increased, as well. According to Figure 3, the highest rate of MB removal took place during the 0 - 20 minute interval. In the remaining concentrations, this reduction continued up to 60 minutes with a lower slope. From this time up to 120 minutes, the system was almost constant and did not have much adsorption. At 50 mg/L of MB, the removal rate varied from 32.6% to 92.3% of the maximum removal onto MPS. For instance, the adsorbents exhibited three stages, which can be attributed to each linear portion of the figure. The first linear portion was attributed to the diffusion process of MB to the adsorbent surfaces (2, 9), hence, was the fastest sorption stage. This result is corroborated by the factionary-order kinetic model. The second linear portion was attributed to intra-particle diffusion, which was a delayed process. The third stage may be regarded as the diffusion through smaller pores, which is followed by the establishment of the equilibrium (2, 9). The surface of MPS may contain a large number of active sites and the solute uptake can be related to the active sites on equilibrium time. The higher sorption rate at the initial period (first 120 minutes) may be due to an increased number of vacant sites available at the initial stage. As a result there exists increased concentration gradient between adsorbate in solution and adsorbate in adsorbent surface. This increase in the concentration gradients tends to increase in MB sorption at the initial stages.
4.3. The Effect of Initial Concentration on MB Removal Efficiency
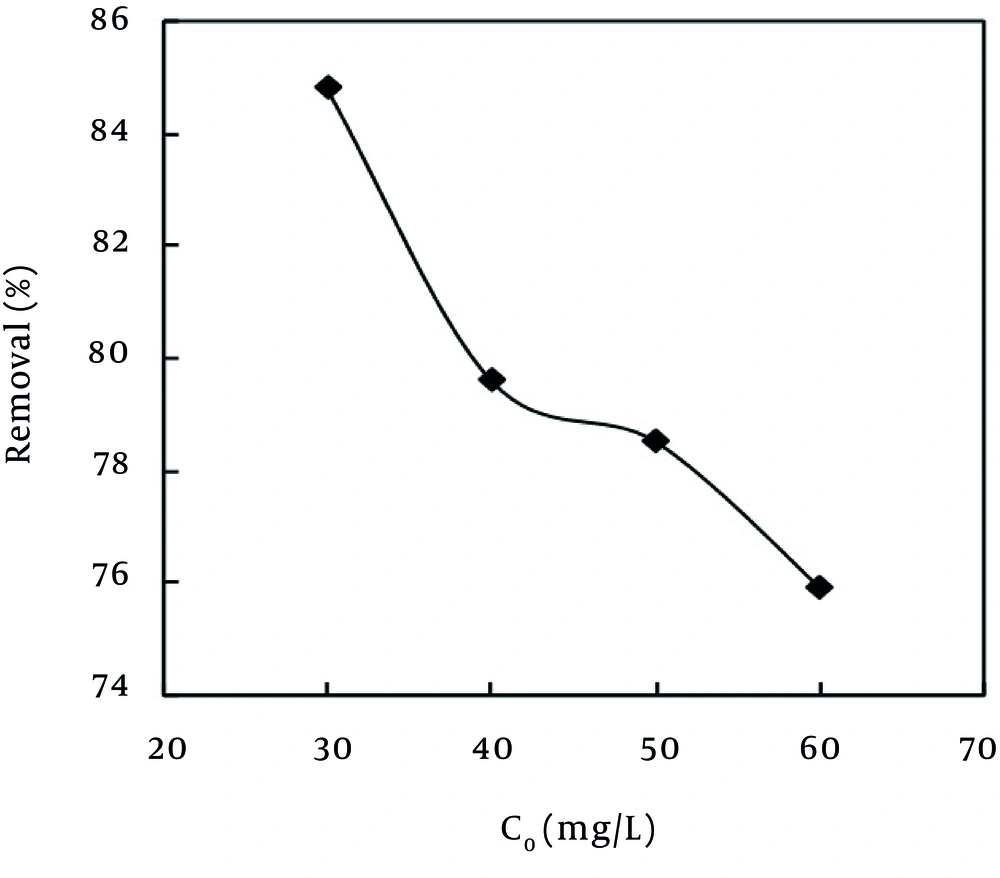
The effect of the initial concentration of MB dye on the adsorption efficiency of the MPS was evaluated at different concentrations of 30, 40, 50, and 60 mg/L. As Figure 4 depicts, one of the effective factors on the rate of dye uptake was the initial dye concentration of MB. In the present study, with the increase of the initial concentration from 30 mg/L to 60 mg/L, the rate of dye removal was reduced from 84.8% to 75.9%. In addition, as the pollutant concentration increased in the aquatic environment, the number of available sites on the adsorbent surface decreased. In other words, with the decrease of the pollutant concentration in the aquatic environment, molecules of the adsorbate have more chance to react with the available active sites on MPS and, as a result, the adsorption rate is increased. Hence, one can claim that one method to increase the percentage of dye removal is dilution of wastewater (25).
4.4. Adsorption Isotherm
Adsorption isotherms are prerequisites to understand the nature of the interaction between adsorbate and the adsorbent used for the removal of organic pollutants. An adsorption isotherm describes the relationship between the amount of adsorbate up taken by the adsorbent and the adsorbate concentration remaining in solution (26). There are many equations for analyzing experimental adsorption equilibrium data. The equation parameters of these equilibrium models often provide some insight into the adsorption mechanism, the surface properties and affinity of the adsorbent for adsorbate (26-28). The parameters obtained from different models provide important information on the surface properties of the adsorbent and its affinity for the adsorbate. In present study, Langmuir, Freundlich, Temkin, and Dubinin-Radushkevich (D-R) isotherms were utilized in order to analyze the MB adsorption by the MPS. The equations and the linear forms of these models are presented in Table 2 (7, 12, 14), and the results are shown in Table 3.
| Model | Nonlinear Form | Linear Form | Number of Equation |
|---|---|---|---|
| Langmuir | qe= qmaxkLCe/(1 + KL) Ce | Ce/qe= (1/bqmax) + (1/qmax) Ce | 3 |
| Freundlich | qe= KFCe1/n | Log qe= Log KF+ (1/n) log Ce | 4 |
| Temkin | qe= RT/bt (ln (atCe)) | qe= A + B ln Ce | 5 |
| Dubinin-Radushkevich | - | lnQ = lnQm– k [RT ln (1+(1/Ce)) ] 2 E = -(2k)-0.5 | 6 |
In the equations presented in Table 2, qmax (mg/g) is the maximum adsorption capacity of the adsorbent, KL (L/mg) is the Langmuir constant, n and KF (L/mg) are the Ferundlich constants and the intensity of adsorption, respectively, Q (mg/g) is the amount of MB dye adsorbed per unit mass of the adsorbent, Qm (mg/g) is the capacity of the intended adsorbent, R (8.314 J/mol.K) is the universal gas constant, T (K) is the absolute temperature, K is the Dubinin–Radushkevich model constant (mol2/kJ2). E, is the mean adsorption energy and A ((RT/bt) 1nat) and B (RT/bt) are the constants of Temkin isotherm (4, 6, 20, 21).
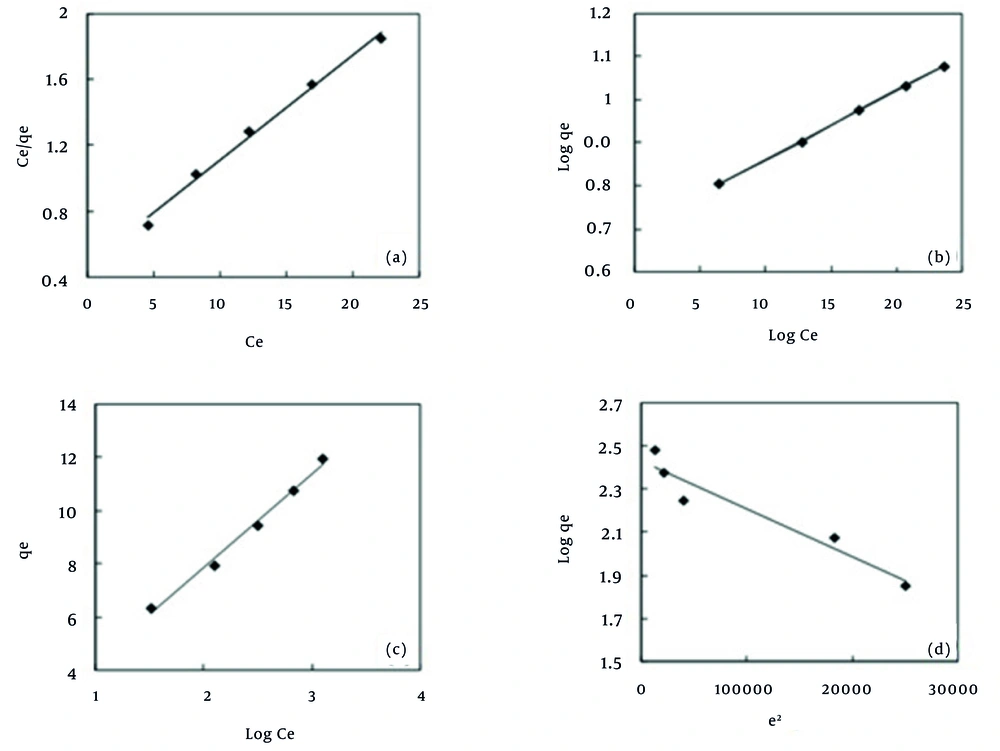
The Langmuir equation is valid for monolayer adsorption onto a completely homogenous surface with a finite number of identical sites with negligible interaction between adsorbed molecules (26). Figure 5 shows the Langmuir (Ce/qe vs. Ce) plots for adsorption of MB. RL, and the correlation coefficients for the Langmuir isotherm are presented in Table 3. The essential features of the Langmuir isotherm may be expressed in terms of equilibrium parameter RL, which is a dimensionless constant referred to as a separation factor or equilibrium parameter:
7) RL = 1/(1 + KLC0)
where C0 is the initial concentration and KL is the constant related to the energy of adsorption (Langmuir constant). The values of RL indicate the type of isotherm to be irreversible (RL = 0), favorable (0 < RL< 1), linear (RL = 1) or unfavorable (RL > 1). Value of separation for adsorbent is found to be less than unity, confirming thereby the favorable adsorption process. The isotherms of MB on MPS were found to be linear for the entire concentration range studies and the correlation coefficients were extremely high (R2 > 0.99) as shown in Table 3. As Table 3 shows, the maximum adsorption capacity of the MPS in the Langmuir model was obtained as 15.87 mg/g which is considered as a favorable rate compared to other similar studies (Table 4) (29-32). The Freundlich isotherm (33) is derived by assuming a heterogeneous surface with a non-uniform distribution of sorption heat over the surface. Figure 5 shows the Freundlich (log qe vs. log Ce) plots for adsorption of MB. Table 3 shows the Freundlich adsorption isotherm constant and its respective correlation coefficients. Heat of adsorption and the adsorbent–adsorbate interaction on adsorption isotherms were studied by the Temkin isotherm (34). Figure 5 shows the Temkin (qe vs. ln Ce) plots for adsorption of MB. The constants obtained for the Temkin isotherm are shown in Table 3. Langmuir and Ferundlich isotherms do not provide any information about the surface adsorption mechanism. Therefore, other isotherm models, such as Dubinin-Raduchkevich, are used for estimating the mechanism of surface adsorption. Raduchkevich in 1949 and Dubinin in 1965 proposed that the adsorption curve depends on the structure of the adsorbent pores (35). The plot of ln qe vs. ε2 at for MB is presented in Figure 5. The constant obtained for D–R isotherms are shown in Table 3. The mean adsorption energy (E) gives information about the chemical and physical nature of adsorption (36).
| Parameter | Values |
|---|---|
| Langmuir | |
| KL(L/mg) | 0.132 |
| Qm(mg/g) | 15.87 |
| R2 | 0.992 |
| RL | 0.131 |
| χ2 | 1.87 |
| Freundlich | |
| 1/nf | 0.458 |
| (L/mg) KF | 3.45 |
| R2 | 0.999 |
| χ2 | 0.12 |
| Temkin | |
| KT(L/mg) | 1.24 |
| BT | 3.535 |
| bt | 712.63 |
| R2 | 0.990 |
| χ2 | 1.56 |
| Dubinin-Radushkevich | |
| Qm(mg/g) | 11.376 |
| K×10-6 | 2 |
| E (KJ/mol) | 0.5 |
| R2 | 0.926 |
| χ2 | 5.41 |
| Type of Adsorbent | Removed Material | Amount of Adsorption Per Mass Unit of the Adsorbent, qe, mg/g | References |
|---|---|---|---|
| Pumice powder (I) | Methylene blue | 0.442 | (29) |
| Pumice powder (II) | Methylene blue | 1.488 | (29) |
| Pumice | Fluoride | 41 | (30) |
| Pumice granule | Azo dye | 0.024 | (32) |
| Pumice granules | Fluoride | 2 | (31) |
| Modified pumice with hydrochloric acid | Methylene blue | 15.87 | The present study |
As Table 3 depicts, MB dye adsorption on the MPS has a high compliance with the Freundlich model (R2 = 0.999). This shows that the surface of the adsorbent is heterogeneous and the adsorption of MB dye on the adsorbent is multilayer. This finding is in line with the results that reported previously by El-Qada at al. (21) and Altenor et al. (37). Also, in this study, the value of n coefficient in the Freundlich model was found to be 2.182 which indicate a high tendency toward adsorbing the MB dye onto the MPS and this fact had been demonstrated by RL in advance. The coefficient 1/n in the Freundlich model is a value between 0 - 1 which represents the adsorption intensity of adsorbate to adsorbent. In the present study, 1/n was revealed as 0.458 which indicates the favorable adsorption of the adsorbate (37).
4.5. Adsorption Kinetics
The rate and mechanism of the adsorption process can be elucidated based on kinetic studies. Dye adsorption on solid surface may be explained by two distinct mechanisms: (1) An initial rapid binding of dye molecules on the adsorbent surface; (2) relatively slow intra-particle diffusion. To analyze the adsorption kinetics of the dye, the pseudo-first-order, the pseudo-second-order, and intra-particle diffusion models were applied (38, 39). Each of these models and their linear modes of theme are shown in Table 5 (2, 31). In the equations presented in Table 5, qe and qt refer to the amount of dye adsorbed (mg/g) at equilibrium and at any time, t (min), respectively and K1 (1/min), K2 (g/mg.min) are the equilibrium rate constants of pseudo-first order and pseudo-second order models, respectively. Kdif is the intra-particle diffusion rate constant and values of C in intra-particle diffusion model give an idea about the thickness of the boundary layer.
| Model | Nonlinear Form | Linear Form | Number of Equation Group |
|---|---|---|---|
| Pseudo-first-order | dqt/dt= k1(qe-qt) | ln (qe-qt) = ln qe-k1t | 8 |
| Pseudo-second-order | dqt/dt= k2(qe-qt)2 | t/qt= 1/k2qe2+ (1/qe)t | 9 |
| Intra-particle diffusion | qt= kpt1/2+ C | - | 10 |
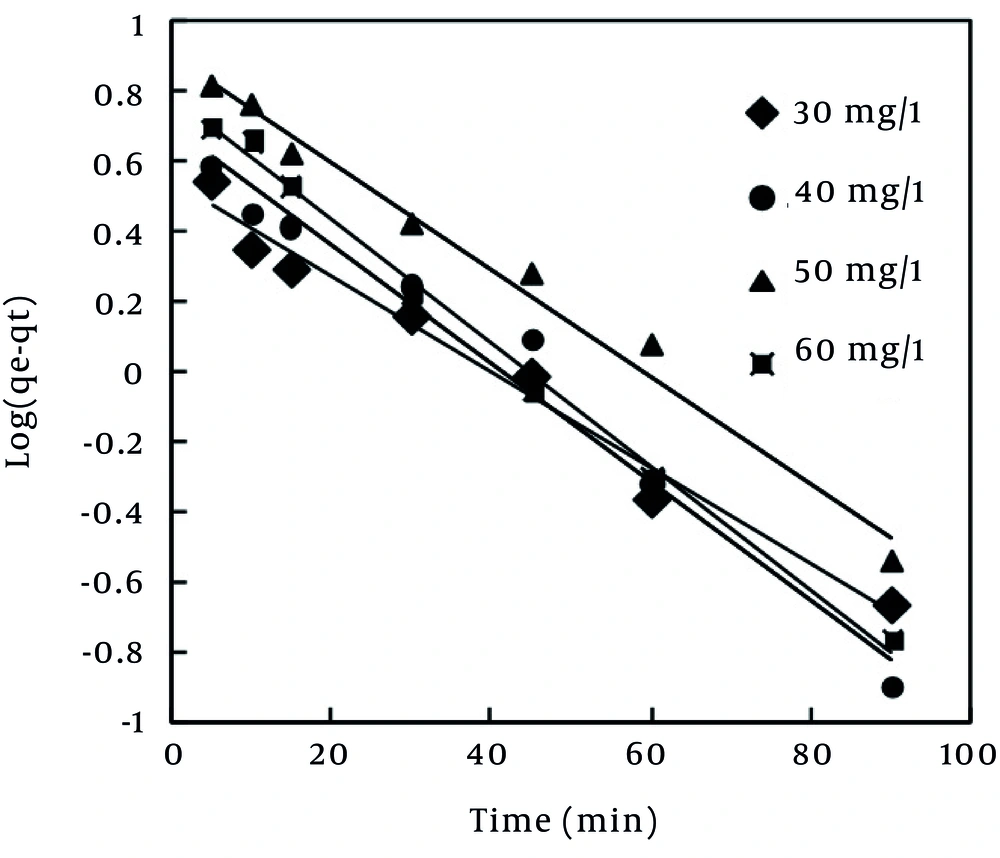
Pseudo-first order model is a simple kinetic model, which was proposed by Lagergren (40) during 1898 and is used for estimation of the surface adsorption reaction rate. In order to obtain the rate constant of pseudo-first order reaction, linear pseudo-first order equation proposed by Lagergen and Svenska was used (Table 5). The values of ln (qe - qt) were linearly correlated with t. The plot of ln (qe - qt) vs. t should give a linear relationship from which the values of K1 were determined from the slope of the plot (Figure 6). In many cases, the first-order equation of Lagergren does not fit well with the entire range of contact time and is generally applicable over the initial stage of the adsorption processes (41). The value of R2 obtained for pseudo-first order model (Table 6) showed that MB dye adsorption on the MPS did not follow this model.
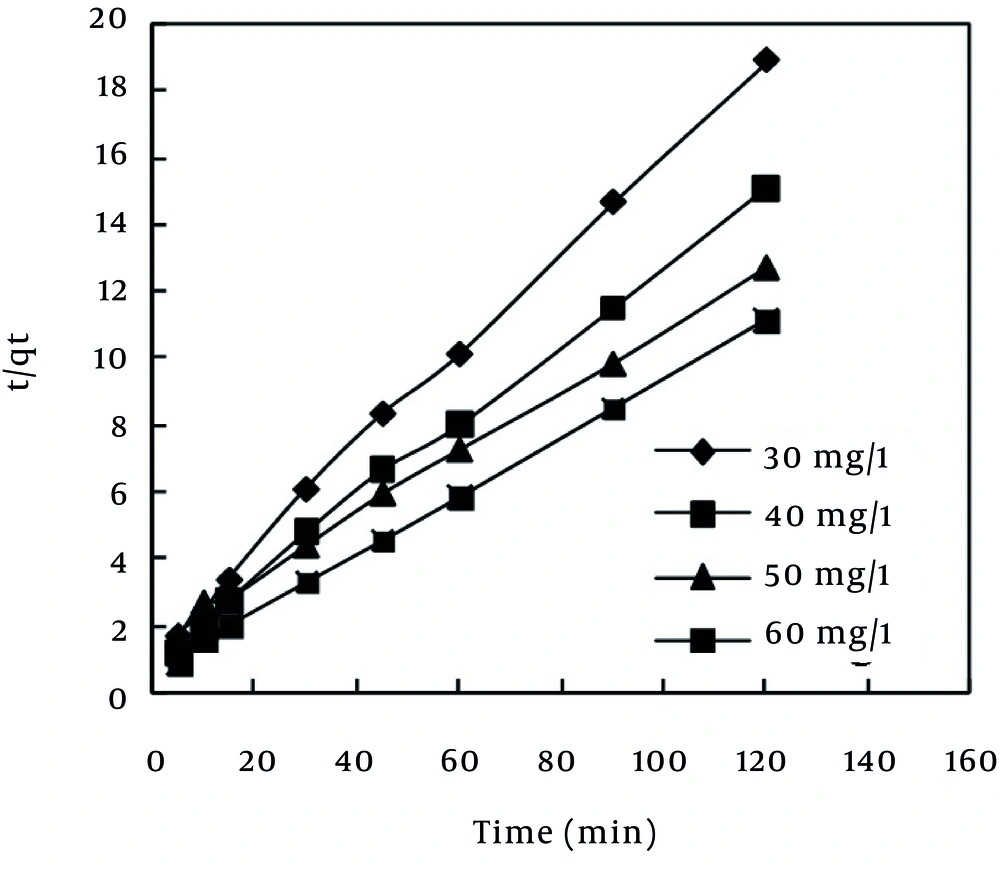
In the pseudo-second order model (42), the slope and intercept of the t/qt vs. t plot were used to calculate the second-order rate constant, K2 (Figure 7). The values of equilibrium rate constant (K2) are presented in Table 6. According to Table 6, the value of R2 (0.999) related to the pseudo-second order model revealed that MB dye adsorption followed this model, which is in agreement with the results obtained by Karagoz et al. (23), Hameed et al. (24), and Altenor et al. (37).
| Kinetics models | Initial Concentration of MB Dye(mg/L) | |||
|---|---|---|---|---|
| 30 | 40 | 50 | 60 | |
| First-order kinetic | k1 | 0.029 | 0.037 | 0.039 |
| qe(calc) | 3.493 | 4.945 | 6.081 | |
| R2 | 0.979 | 0.975 | 0.995 | |
| Second-order kinetic | k2 | 0.017 | 0.014 | 0.012 |
| qe(calc) | 6.756 | 8.474 | 11.494 | |
| R2 | 0.997 | 0.997 | 0.999 | |
| h | 0.803 | 1.045 | 1.597 | |
| Intra particle diffusion | Kdiff | 0.366 | 0.440 | 0.612 |
| C | 2.741 | 3.621 | 4.964 | |
| R2 | 0.905 | 0.943 | 0.887 | |
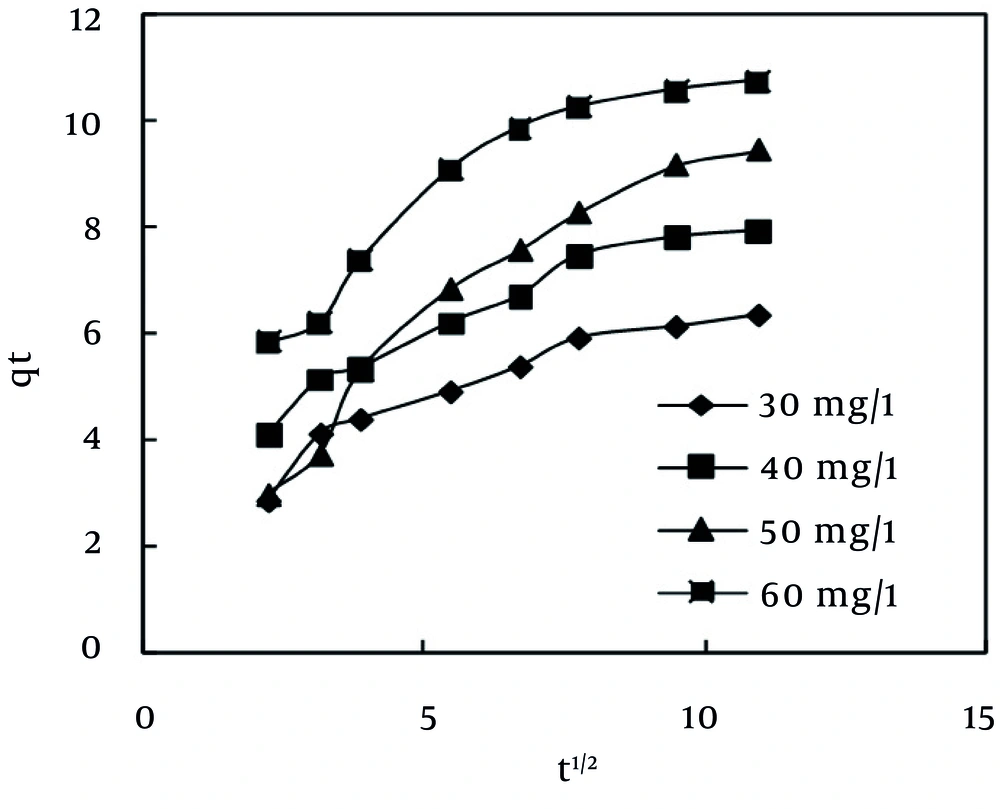
Nevertheless, pseudo-first order and pseudo-second order kinetic models cannot identify the mechanism of diffusion of dye into the adsorbent pores. Therefore, intra-particle diffusion model (43), which is mostly used for expression of the dependence of surface adsorption process on time, was investigated. Plot of qt vs. t0.5 is illustrated in Figure 8. It shows two separate regions, the initial part is attributed to bulk diffusion while the final part to intra-particle diffusion. The value of R2 (Table 6) computed for intra-particle diffusion kinetic model showed that the rate of MB adsorption process was not controlled by the stage of diffusion of the adsorbate in the particles of the MPS (44). As Table 6 shows, Pseudo-second order is the best kinetic model, which can describe the adsorption of MB dye by the MPS. This finding is in line with the results that have been reported previously (2, 24, 37).
4.6. Error Analysis
In the single-component isotherm studies, the optimization procedure requires an error function to be defined in order to be able to evaluate the fit of the isotherm to the experimental equilibrium data. However, the use of R2 is limited for solving the linear forms of the isotherm equation, but not the errors in isotherm curves. In this study, a Chi-square test was used. The Chi-square test statistic is basically the sum of the squares of the differences between the experimental data and data obtained by calculation from models, with each squared difference divided by the corresponding data obtained by calculation from models (45). The equivalent mathematical statement is:
11) X2 = ∑i=1m (qe,exp – qe,calc)2 / qe,exp
Where qe,exp is the experimental data of the equilibrium capacity (mg/g), qe,calc is the equilibrium capacity obtained by calculating from the model (mg/g). Therefore, it is necessary to analyze the data set using the Chi-square test to confirm the best-fit isotherm for the adsorption of MB on MPS. Given the values of R2, and χ2 in Table 3 it can be concluded that the Freundlich isotherm model has the best goodness of fit among the applied isotherm models.
5. Discussion
The present study investigated the efficiency of MPS as a cheap adsorbent and the results revealed that MPS was an appropriate adsorbent for removing MB from the aquatic environments. pH also plays a major role in removing the MB. The findings of the present study also showed that as the contact time increased, the dye’s primary concentration as well as the dose of the intended adsorbate of the adsorption efficiency increased, as well. Adsorption equilibrium data follows Langmuir, Freundlich, Temkin and Dubinnin-Radushkevich isotherm models. The equilibrium data fitted very well in the Freundlich isotherm equation. The kinetic study of MB on to MPS was performed based on pseudo-first-order, pseudo-second-order and intra-particle diffusion equations. The data indicate that the adsorption kinetics follow the pseudo-second-order rate. This study concludes that the MPS could be employed as an appropriate, inexpensive, accessible and low-cost adsorbent for the removal of MB from aquatic environments.
