1. Background
Contamination of water resources with nitrate has become a very broad and important problem in many regions of the world including Iran (1-3). It has become more important, possibly due to its high water solubility (4). The use of fertilizers in agriculture, chemical products, septic tank systems, animal manure, and agricultural and urban runoff as well as atmospheric deposition from nitrogen oxide emission are the most important ways of water resources contamination with high levels of nitrate (5, 6). Nitrate can be changed to nitrite that is relatively more toxic than nitrate (7-9). Nitrate is threatening to human health and environment; some serious complications of nitrate include induction of blue-baby syndrome especially in infants (methemoglobinemia), promoting eutrophication, and the potential formation of carcinogenic nitrosamine (10-12). European Union Legislation and United States Environmental Protection Agency have announced that the nitrate level in drinking water is 50 and 10 mg NO3− -N/L, respectively (13, 14). Several methods are available for nitrate removal including ion exchange, reverse osmosis, biological denitrification, and chemical reduction (6, 8, 15-17). Ion exchange and reverse osmosis are the most common methods of nitrate reduction. Unfortunately, both of these methods are not affordable due to the generation of secondary waste and requiring frequent regeneration of the media. Challenges in biological methods produce excessive biomass sludge that requires further treatment. Moreover, the microbial processes require special and permanent maintenance (8, 18). Another technique for nitrate removal is the use of nano-scaled zero-valent irons (nZVI) (8). In recent years, nZVI has attracted the attention of many scientists (19). Due to high reduction capacity, high efficiency, abundance, cheapness, and its unique atomic, molecular, and chemical properties, nZVI has been used in the treatment of nitrate contaminated water (20, 21). Despite numerous benefits of this technology, there are limitations in the use of nZVI such as pH control, ammonium production, and particle aggregation (20, 22). Adding nZVI to the water containing nitrate and nitrite induces the production of Fe2 + and ammonia (NH4 +) or N2 gas (reactions 1 and 2) (23).
1) 5 Fe0 + 2 NO3- + 6 H2O → 5 Fe2+ + N2 + 12 OH-
2) Fe0 + NO3- + 7 H2O → 4 Fe2+ + NH4+ + 10 OH-
Accordingly, nZVI dose, initial concentration, contact time, and ionic strength were evaluated using a statistical model. There are several limitations for classical experimental methods. In the classical method, only one variable can be examined at the time that can lead to more spent time and laborious work. Moreover, the combined effect of several different variables on experiment cannot be determined (24, 25). Since, there is not a linear association between the variables and removal rate in many cases, classical methods are not suitable (26). Response surface methodology (RSM) does not have the limitations of classical methods (27). RSM has many advantages such as ability to design experiments with multiple variables at different levels and requiring a minimum number of experiments (24, 25). In this study, Box-Behnken design (BBD) was used for statistical processes including design of experiments and data analysis. The BBD technique is a second-order and spheroid designs (27, 28). There are several techniques to design RSM and three-level full factorial designs (29). The Doehlert design is the two-level full factorial design that does not have any classical characteristics of RSM. The Doehlert matrix is similar to BBD but requires fewer experiments (30, 31). Therefore, the BBD technique is a suitable and effective method (29).
2. Objectives
The purposes of this research were to: (1) investigating the effects of the nZVI dose, initial concentration, contact time, and ionic strength on efficiency of nZVI in nitrate reduction from water; and (2) model the reduction process using BBD by Design Expert Version 16.2.4 (Stat Ease, USA).
3. Materials and Methods
3.1. Nano-scaled Zero-Valent Iron Synthesis
The 65% nZVI powder with particle sizes of 8 to 18 nm and specific surface areas of 59 to 79 m2/g was synthesized by microemulsion method in Research Institute of Petroleum Industry of Iran (RIPI) and was used without any pretreatment. The morphology of nZVI was identified by X-ray diffraction (XRD) pattern using PW1840 Philips and transmission electron microscopy (TEM) using AT-210 in RIPI.
3.2. Preparation of Synthetic Solutions
For the reduction of nitrate, batch mode experiments were conducted. The nitrate stock solution (1000 mg/L) was prepared by dissolving 0.7218-g KNO3 (Merck, Germany) in the deionized water. Solution pH was kept constant by using 0.1-M NaOH or 0.1-M H2SO4 (Merck, Germany) in all experiments. Ionic strengths were adjusted by KCl (Merck, Germany).
3.3. Nitrate Removal Experiments
Nitrate reduction was initiated by adding a certain amount of nZVI into solution. The Solution was sonicated for six minutes; then the samples were shaken by a horizontal shaker at determined time at 200 rpm (Sibata). Thereafter, the solution was centrifuged. The final solution was filtered through a 0.45-μm pore membrane filter.
3.4. Nitrate Analysis
After drawing the nitrate calibration curve, the nitrate concentration was measured by readings ultraviolet absorption of solution at both 220 and 275 nm. Subtract 2 times the absorbance reading of the water sample at 275 nm from the value of absorbance for that sample at 220 nm. This operation gave a value for the experimental absorbance due to nitrate. All samples were diluted to the appropriate ratio and 1 mL of 1-M HCl was added to all diluted samples. Nitrate concentration was measured by a UV-Vis spectrophotometer model (Perkin-Elmer model Lambda BZ 201) spectrophotometer according to the 4500- NO3- B of the standard method (32).
3.5. Experimental Design
Statistical model of RSM was used to create the relationship between variables and responses. Among the other design techniques based on RSM, BBD is one of the most powerful and efficient statistical tool (33). Based on the literatures review and results from prototype tests, a four-factor, three-level BBD was used to model the nitrate reduction. The four parameters including nitrate concentration (mg/L), nZVI dose (g/L), contact time (minute), and ionic strength (μmho/cm) were represented as X1, X2, X3, and X4, respectively. Nitrate removal (Y) was considered as the response. Four studied parameters are shown in Table 1. The following equation represents a second-order model (Equation 1):
Equation 1. Y = β0 + βi + xi + Ʃβii + xii2 + Ʃβij xi xj + ε
in this equation, Y is the predicted response surface function, 0 is constant, 1 is the input variable xi, ii is the quadratic effect of input variable r xi, and ij is the linear by linear interaction effect between the input variable xi and variable xj (34).
| Factors | Levels | ||
|---|---|---|---|
| +1 | 0 | -1 | |
| X1 | 50 | 100 | 150 |
| X2 | 0.5 | 1.25 | 2 |
| X3 | 15 | 37.5 | 60 |
| X4 | 1000 | 3000 | 5000 |
4. Results
4.1. Characterization of the Nano-Scaled Zero-Valent Iron
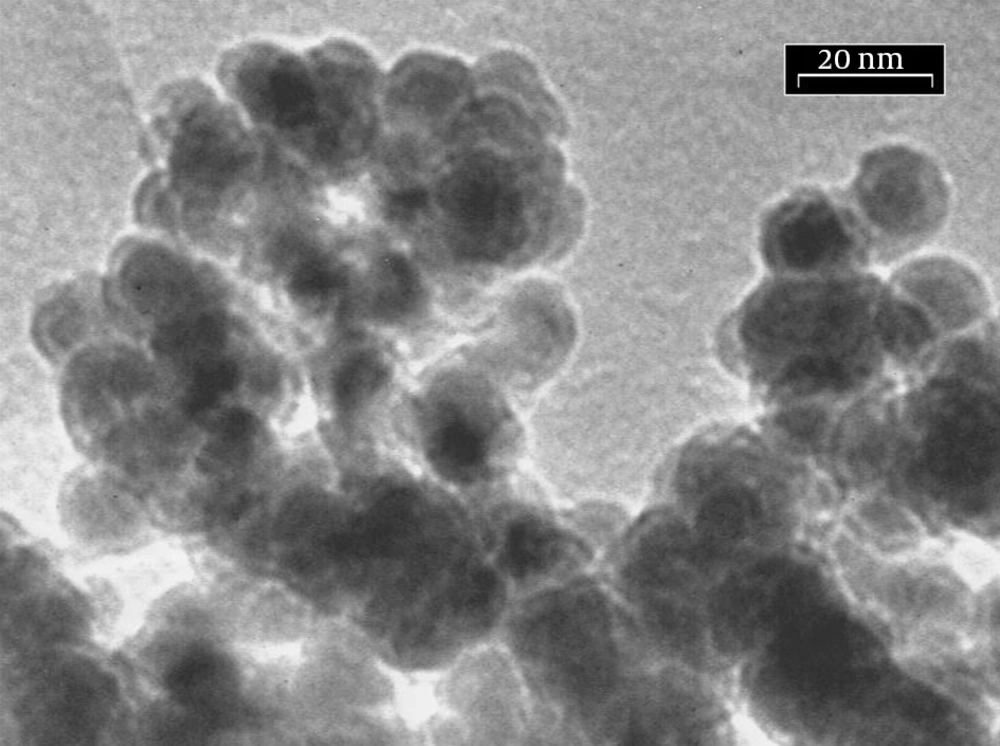
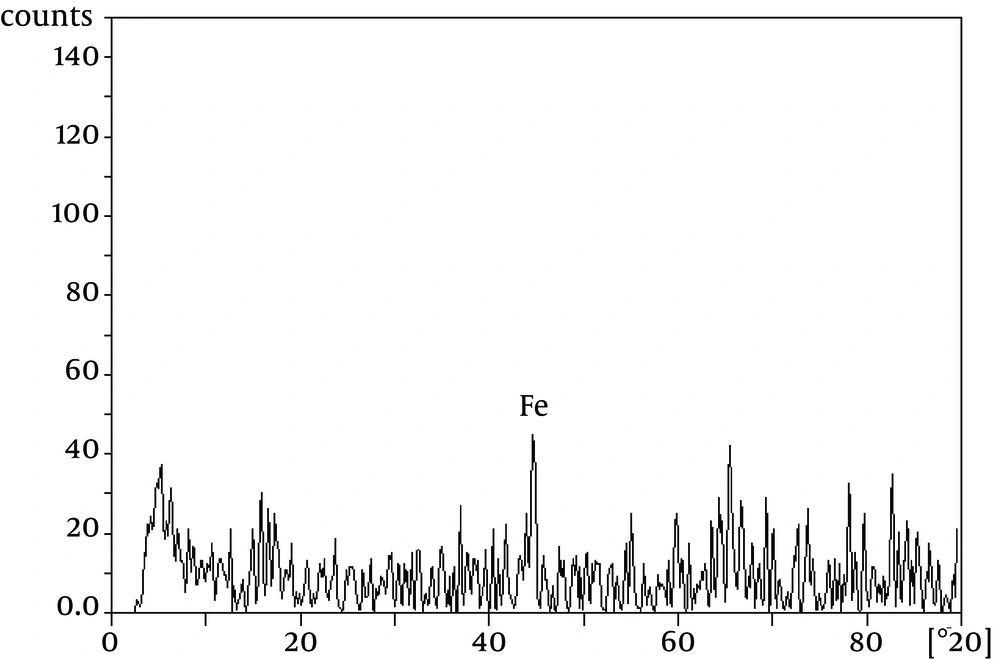
The TEM image of the nZVI showed nearly spherical nanoparticles with the mean size of 8 to 18 nm (Figure 1). Figure 2 shows the XRD patterns of the nZVI. The main peaks are characteristic peaks of iron. It should be noted that the samples were amorphous because they were prepared through liquid method. Therefore, only iron index peaks are evident in the 44.7 area.
4.2. Experimental Design and Fitting of Quadratic Model
The observed and predicted results for each experiment performed per the experimental plan are given in Table 2. As shown in the table, the highest efficiency was 85.3% that was found at run 21. Correlation between the nitrate removal efficiency and parameters were as following quadratic equation (Equation 2):
Equation 2. Y1 = 51.0333 - 10.9083 X1 + 12.2833 X2 + 19.8417 X3 - 2.4833 X4 + 8.9375 X32 - 4.1 X42 + 4.65 (X1) (X2) + 4.125 (X1) (X3) - 6.125 (X2) (X3)
Where X1, X2, X3, and X4 are four selected factors. Analysis of variance (ANOVA) was used to express the statistical significance of Equation 2.
| Number | Experimental Design | Y, % | ||||
|---|---|---|---|---|---|---|
| Nitrate | nZVI | Time | Ionic Strength | Observed | Predicted | |
| 1 | +1 | -1 | 0 | 0 | 22.3 | 23.1 |
| 2 | 0 | 0 | +1 | -1 | 78.9 | 78.2 |
| 3 | 0 | -1 | +1 | 0 | 72.5 | 73.6 |
| 4 | +1 | 0 | 0 | -1 | 37.2 | 38.5 |
| 5 | 0 | +1 | 0 | -1 | 62.1 | 61.7 |
| 6 | 0 | 0 | 0 | 0 | 50.8 | 51.0 |
| 7 | -1 | 0 | -1 | 0 | 54.2 | 55.1 |
| 8 | +1 | 0 | -1 | 0 | 25.5 | 25.1 |
| 9 | +1 | 0 | 0 | +1 | 32.5 | 33.5 |
| 10 | 0 | 0 | 0 | 0 | 51.0 | 51.0 |
| 11 | 0 | -1 | -1 | 0 | 21.4 | 21.7 |
| 12 | 0 | 0 | -1 | -1 | 37.5 | 38.5 |
| 13 | 0 | -1 | 0 | -1 | 35.6 | 37.1 |
| 14 | -1 | 0 | 0 | -1 | 60.9 | 60.3 |
| 15 | 0 | 0 | +1 | +1 | 73.8 | 73.2 |
| 16 | 0 | +1 | -1 | 0 | 58.7 | 58.5 |
| 17 | 0 | -1 | 0 | +1 | 32.6 | 32.1 |
| 18 | +1 | +1 | 0 | 0 | 55.4 | 57.0 |
| 19 | 0 | 0 | -1 | +1 | 33.1 | 33.5 |
| 20 | 0 | 0 | 0 | 0 | 51.3 | 51.0 |
| 21 | 0 | +1 | +1 | 0 | 85.3 | 85.9 |
| 22 | +1 | 0 | +1 | 0 | 72.9 | 73.0 |
| 23 | 0 | +1 | 0 | +1 | 55.8 | 56.7 |
| 24 | -1 | -1 | 0 | 0 | 53.7 | 54.3 |
| 25 | -1 | +1 | 0 | 0 | 68.2 | 69.5 |
| 26 | -1 | 0 | 0 | +1 | 54.6 | 55.3 |
| 27 | -1 | 0 | +1 | 0 | 85.1 | 86.6 |
aAbbreviations: nZVI, nano-scaled zero-valent iron; and Y, nitrate removal.
4.3. Statistical Analysis
Adequacy and testing hypotheses on the parameters were controlled by ANOVA (27). ANOVA test results for proposed model are shown in Table 3. The closer to one were the values of R2, the stronger the association between the experimental and the predicted results would be. R2 and the adjusted R2 for the results of this study were 0.9992 and 0.9982, respectively. This indicates that the model had appropriately described the association between the response and parameters (35). Therefore, the proposed model could be used for future studies.
| Source | DF | Sum of Square | Mean Square | F Value | P Value, Prob > F |
|---|---|---|---|---|---|
| Regression | 14 | 9104.44 | 650.32 | 1042.71 | < 0.0001 |
| Linear | 4 | 8036.77 | 2009.19 | 3221.51 | < 0.0001 |
| Square | 4 | 759.57 | 189.89 | 304.47 | < 0.0001 |
| Interaction | 6 | 308.10 | 51.35 | 82.33 | < 0.0001 |
| Residual Error | 12 | 7.48 | 0.62 | - | - |
| Lack-of-Fit | 10 | 7.36 | 0.74 | 11.62 | 0.082 |
| Pure Error | 2 | 0.13 | 0.06 | - | - |
| Total | 26 | 9111.92 | - | - | - |
aAbbreviation: DF, Degree of freedom; and Prob, probability.
bR2 = 0.9992; and adjusted R2 = 0.9884.
5. Discussion
5.1. Regression Model
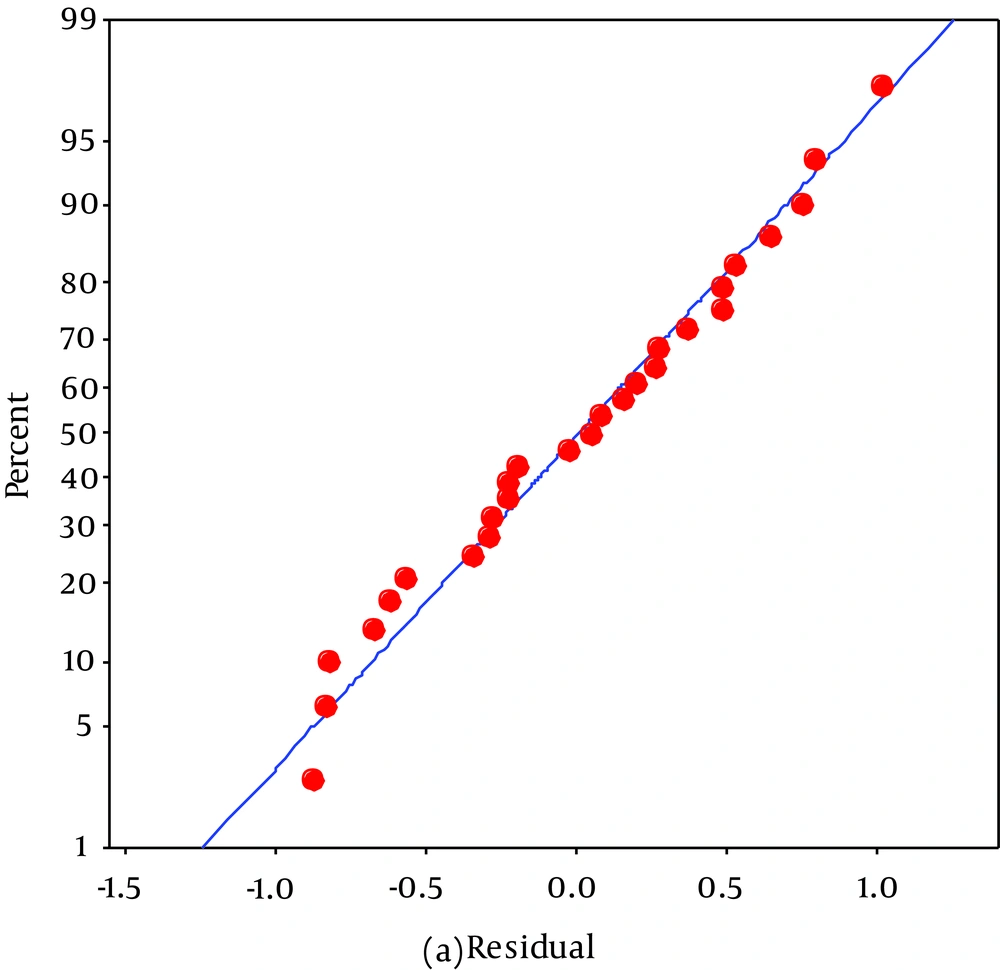
The model was evaluated in terms of the distribution. A normal probability plot of these residuals is shown in Figure 3. The following chart illustrates that the distribution was normal as the points are close to the line (36).
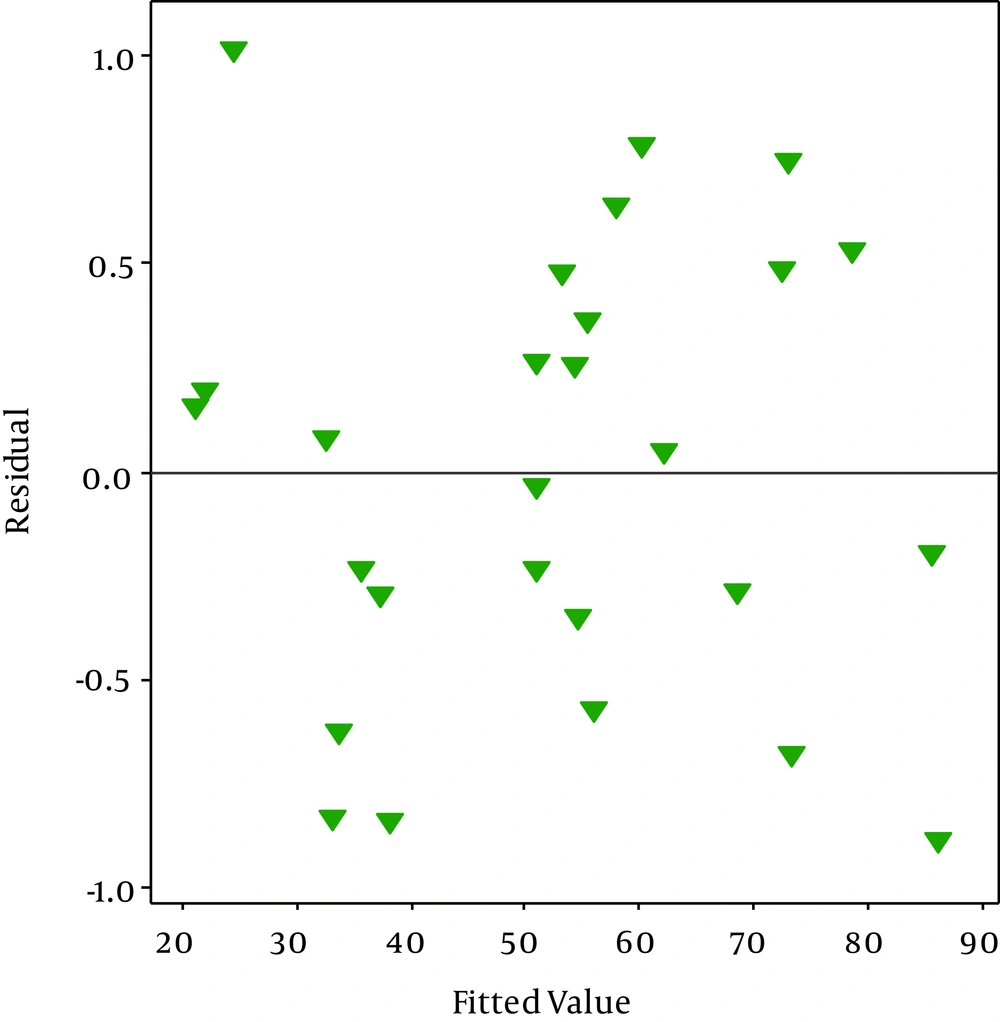
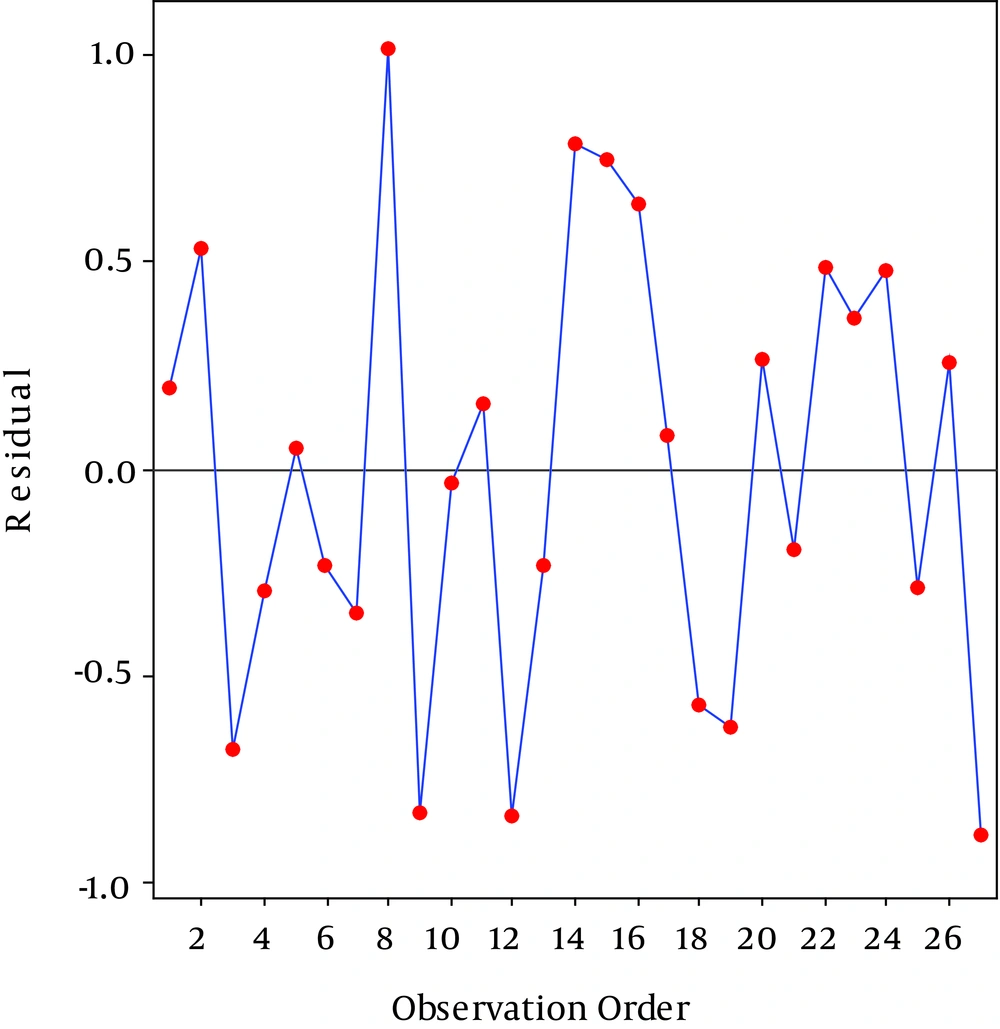
The random scatter of the residuals shows in Figure 4. As shown in Figure 4, no trend indicating high or low variance is seen since the assumption of constant variance was accepted (36). Figure 5 is the outlier t plot for all experiments. To express the outlier, thresholds of three standard deviations were considered. An outlier outside of this threshold indicates an error (36). We do not see any outlier beyond the standard in Figure 3. All data were compatible with the model.
Similar results were reported by Mourabet et al. (34); they found that a second order polynominal regression model could properly interpret fluoride adsorption process on apatite tricalcium phosphate. Moreover, Zazouli et al. (37) have used the RSM to model bisphenol removal from aqueous solution. Their results showed that the proposed model is suitable for the interpretation of removal process that was similar to this research. Garg et al. (35) stated that RSM was a very sound technique to investigate the nickel (II) adsorption process by agricultural waste biomass.
5.2. Association Between Removal Efficacy and Nitrate and Time
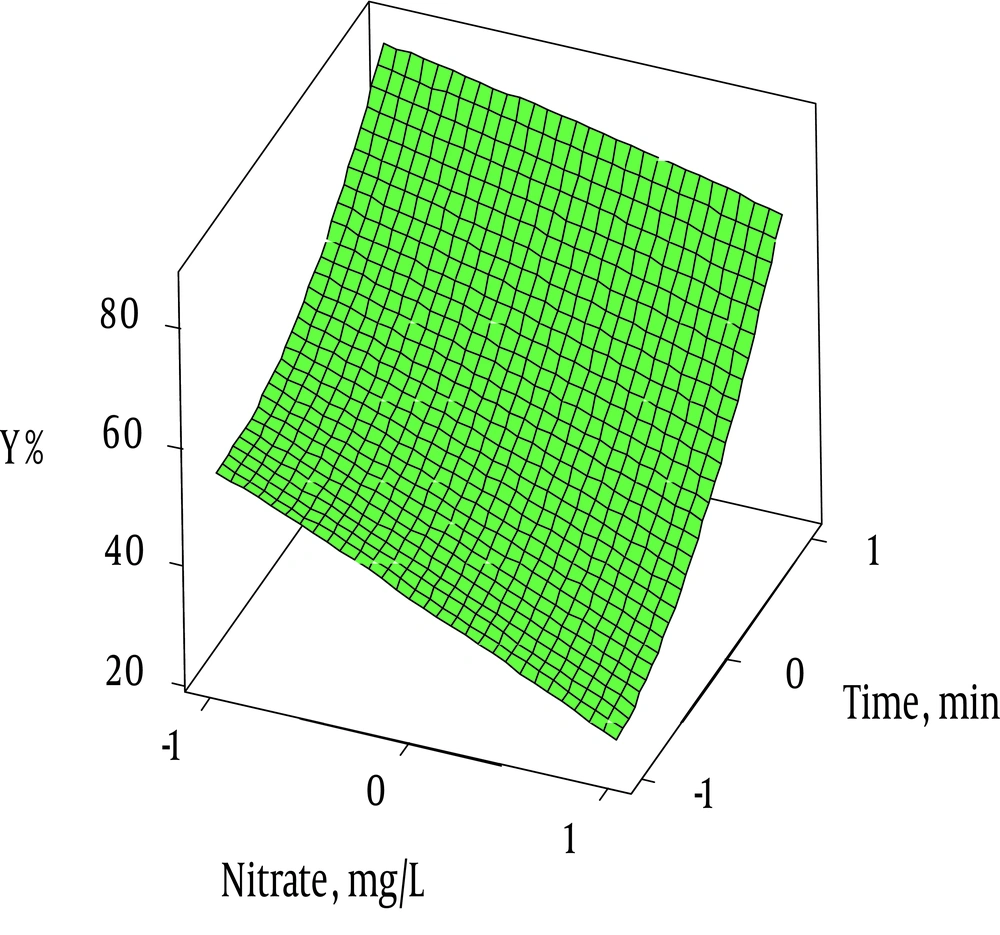
The effect of different factors on the nitrate removal was investigated by RSM. Three dimensional (3D) and contour plots were used to describe and illustrate the effects of different factors on the removal rate. RSM and 3D plots were used to represent the combined effect of time and nitrate on the removal efficiency. Figure 6 demonstrates that high levels of nitrates in water were decreased the efficiency over time. Similar results were explained by Kassaee et al. (38) and Huang et al. (8). In addition, Figure 6 represents the association between time and percentage of nitrate ions removal. As shown in 3D plot graph, the highest removal rates occurred at 60 minutes. Similar results were reported by Chen et al. (39). This could be explained by the formation of ammonium nitrite (NH4NO2) and ammonium nitrate (NH4NO3) at shorter retention times (40).
5.3. Association Between Removal Efficacy and Ionic Strength and Nano-Scale zero-Valent Iron
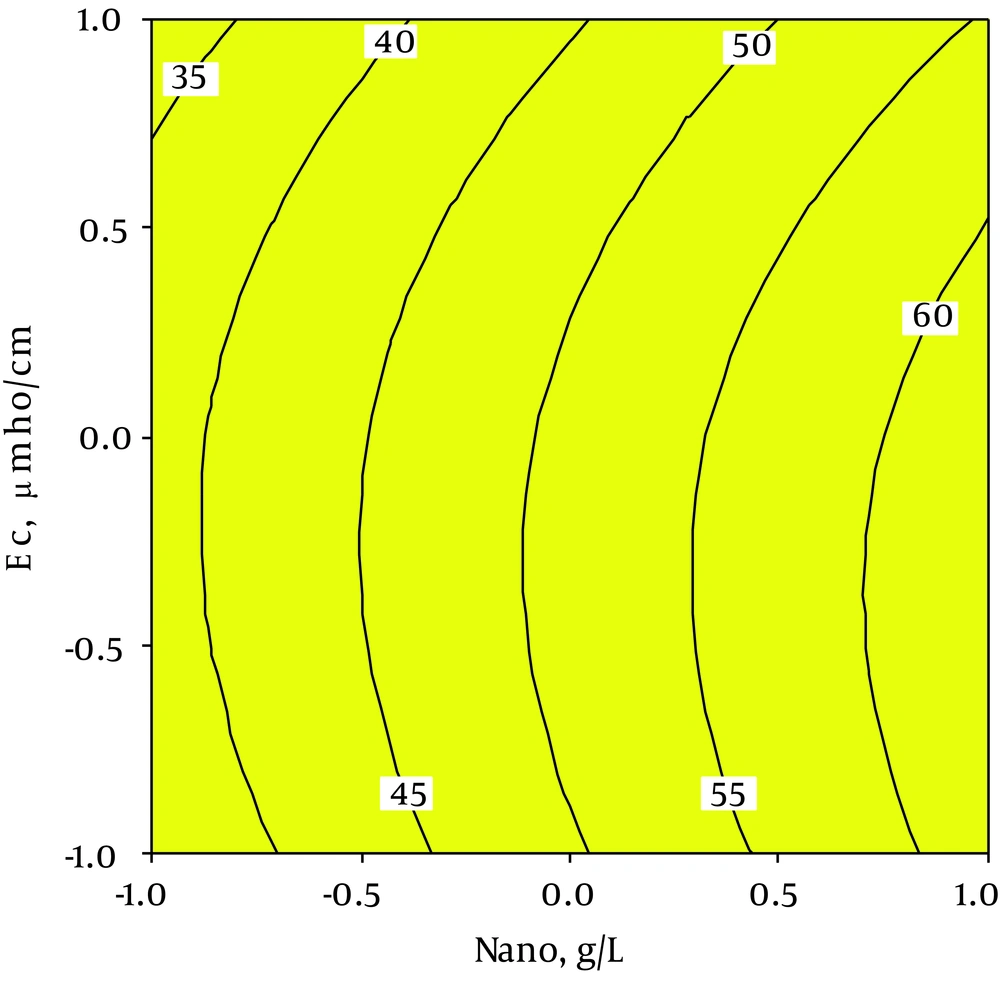
As shown in contour plot graph in Figure 7, increasing of nZVI dose increases nitrate removal. Similar findings were reported by Liao et al. (41) and Yang et al. (44) The effects of ionic strength on nitrate removal was studied by Kassaee et al. (38). They reported that nitrate removal had a direct association with increase in ionic strength. This might be due to the presence of chloride ions in solution and increased reactive area of the nanoparticles for NO3– reduction (42). The results of our study indicated that by increase in the ionic strength, the nitrates removal decreases. The anions were found to interfere with the reaction through deactivating them. Ultimately, the nitrate removal would reduce (43). Additionally, Yang et al. (44) stated that the nitrate removal increased as the dose of nZVI increased, which is in accordance with present findings.
In this study, RSM was used for modeling nitrate removal from water and the effects of four variables, ie, nZVI dose, nitrate concentration, contact time, and ionic strength, on the removal efficiency were examined. RSM and BBD are powerful statistical tools for studying nitrate reduction process with a low number of experiments. Moreover, the effects of different variables on the removal rate were determined. The results of this study demonstrated that nZVI has a significant role in the nitrate removal and with further studies about its effect on the environment and the body, it can be widely used in the nitrate removal after overcoming some of the limitations.
