1. Background
Each human being inhale an average of 10 m3 air every day; therefore studying the effects of the air quality on the health of the exposed people are highly important. Some investigations have confirmed that long exposure with particulates lead to the shortening of human lifetime. Even average annual concentration of 2.5 and 10 μ particulates as low as 20 and 30 μg.m-3, respectively, could result in incidence of bronchitis and lung malfunction in children and adults. Health adverse effects of air pollution may be classified into two classes of short-term and long-term effects. The results of short- and long-term effects are reported as the number of hospitalizations, referrals to physicians, a specific disease cases, death toll and years of life loss. According to World Health Organization, 800,000 people die worldwide each year because of heart and respiratory diseases and lung cancer due to air pollution, among which at least 150,000 death occur in Southern Asia (1, 2). With every 10 μg.m-3 increase in the concentration of particulates during long-term exposure, death toll increase by 0.8% (3). Models determining the health effects are mostly statistical-epidemiological type of models which integrate air quality data in concentration intervals with epidemiological parameters such as relative risk, update base and attributed part, and exhibit the resultant data as mortality (4, 5). Particulates have a wide range of effects, frequently on respiratory and cardiovascular system (6). Biological properties of inhaled particles can affect their precipitation (7, 8). Due to health considerations of particles, 24-hour average concentration of particles with diameter less than 10 μ (PM10) is considered 50 μg.m-3, which it should not exceed more than 35 times per year. According to European Union standards, the concentration of particles should not go beyond 50 μg.m-3 for more than 7 times in a year, and average annual concentration of such particles should not exceed 20 μg.m-3 (9, 10). In order to enhance the level of health and welfare state and based on further studies and new findings by researchers, U.S. Environmental Protection Agency revised the national standards of free air quality in 2006, which considered controlling the particles with two size ranges, i.e. PM2.5 and PM2.5 - PM10, and 24-hour standard (PM2.5) of 35 μg.m-3 and annual standard of 15 μg.m-3 (11). Investigations during two recent decades showed the significant contribution of particulates as air pollutants to public health. Moreover, many studies have reiterated the relation between heart and respiratory diseases with air pollution due to dust particles.
1.1. Area of Study of Ahvaz
Ahvaz, the capital of Khuzestan Province, Iran, with an area of 8,152km2, lies on the geographical coordinates of 30° 45' - 32° N, 48° - 49° 29' E, south-west of Iran. Ahvaz population is about 1,000,000. The average height of Ahvaz is 18 m above sea level. The vast part of Khuzestan province, especially Ahvaz city, lies in a plain. Ahvaz’s climate is hot and sub-humid, and its precipitation is winter regime. Ahvaz’s average annual precipitation is 250 mm with relative humidity of about 41.5% (12-15).
2. Objectives
In such context, the aim of this study was planned to assess the respiratory hospital admissions and cardiovascular diseases with PM10 pollutant in the air of Ahvaz city between 2010 to 2013.
3. Materials and Methods
The present study is an epidemiological and used model study. We analysis of PM10 data by use of Excel software and AirQ model. AirQ software was proved to be a valid and reliable tool to estimate the potential short-term effects of air pollution, predicts health endpoints attributed to criteria pollutants, and allows the examination of various scenarios in which emission rates of pollutants are varied (16, 17).
3.1. Methods
The present study includes two parts. In the first part, concentration of particulates with diameter less than 10 μm was measured during 2010 to 2013. Sampling was done by Ahvaz Department of Environment and in Ahvaz, which had four sampling point for measure air pollutants. Sampling was performed for 24 hours in four stations. Method of sampling and analysis were performed according to EPA 3051A guideline. In this study 140160 (4 × 24 × 365 × 4) samples of Ahvaz’s air was taken and collected in during 2010 to 2013. Pollutant concentrations of PM10 were measured using GRIMM. After processing (correction of temperature and pressure, coding, average estimation and filtering) data were converted as input file to the AirQ model. The second part deals with determining the extent of health effects based on the hypothesis of relative risk attributed to particulates. In this part, epidemiological indexes were calculated using the following formulas:
AP = (R-Ro)/R, Equation 1
Where R is the risk of disease, and Ro is the risk of disease in nonexposed areas. This is the proportion of the overall risk of disease due to exposure, which is equivalent to the proportion of cases, which occur due to exposure. Formula 1 can be rewritten. The Attributable proportion (AP) is multiplied at baseline incidence and divided to 105. Obtained value should be multiplied at population (106).
AP = p (RR‐1) / 1 + p (RR‐1), Equation 2
Where p is the proportion of the population exposed, and RR is the relative risk of disease (risk in exposed/risk in non-exposed, or R1/Ro) (This expression is derived by substituting R = p (R1) + (1‐p) (Ro) into (1), dividing by R0 to get RRs (16, 17).
Where the relative risk (RR) is a ratio of the probability of the event occurring in the exposed group versus a nonexposed group.
RR = Incidence in the exposed / Incidence in the non-exposed, Equation 3 (18).
The Population Prevented Fraction refers to situations where exposure to a factor is protective. The Prevented Fraction is the proportion of the hypothetical total load of disease that has been prevented by exposure to the protective factor. The formula is;
Pe (1-RR), Equation 4
The Attributable Number refers to the number of cases attributable to an exposure. The formula is:
AN = Ne (Ie - Iu), Equation 5
Where Ne is the number exposed, Ie is the incidence among those exposed, and Iu is the incidence among those unexposed to that factor (19).
Thus, the extent of consequences in a population not exposing to risk pollutant. (INe) may be estimated as follows:
1 (1-AP) = INe = I-Ie, Equation 6
In addition to total cases attributable, we could estimate the distribution of Cases attributable in terms of concentration intervals of pollutant. Having relative risk in a specific concentration level of the pollutant and Rate in an unexposed population, we can obtain Extras Rate (I+(c)) and the number of Extras (N+(c)) in a Groups exposed: (6).
(RR(c-1)) = I+(c) INe P(c), Equation 7
All the above-mentioned equations are based on the assumption that the estimation used in this analysis has been controlled regarding all probable confounders. Putting confidence intervals of relative risk estimation in the equation, we will have upper and lower limits of attributed part and the range of cases attributable to expected exposure. Indeed, practically uncertainty of the effect (and the range of estimated effects) is larger due to exposure assessment errors and non-statistical uncertainties of concentration-response function. Thus, we may obtain the increase in death toll due to increase in the concentration of particles.
4. Results
In this section, results from Ahvaz’s particulates analysis during four years of studying as well as tables of baseline incidence indexes, relative risk and attributed portion (epidemiological indexes) related to selected health implications are shown. Table 1 shows increase in the average annual concentration of PM10 in Ahvaz since 2010 until 2013, where the concentration of particulates reached 917.12 μg.m-3 in 2011. During 2010 to 2011, concentration of PM10 was higher in summer than in winter, whereas the concentration during 2012 till 2013 was higher in winter than in summer. Maximum annual concentration was observed in summer 2010 as 10000 μg.m-3. In addition, according to the results, maximum concentration of PM10 in Ahvaz during this four-year period was in summer seasons.
| Parameters | Study Years | |||
|---|---|---|---|---|
| Ahvaz City (2010) | Ahvaz City (2011) | Ahvaz City (2012) | Ahvaz City (2013) | |
| Annual mean | 261 | 323.78 | 727.65 | 917.12 |
| Spring mean | 281 | 300.47 | 985.04 | 666.58 |
| Summer mean | 376 | 421.90 | 646.61 | 520.77 |
| Autumn mean | 200 | 299.36 | 348.00 | 648.17 |
| Winter mean | 170 | 269.33 | 922.42 | 1854.66 |
| Annual 98 percentile | 1286 | 935.758 | 2663.53 | 5000.00 |
| Summer Maximum | 4324 | 1881.48 | 10000.00 | 5760.00 |
| Winter Maximum | 2810 | 1322.43 | 2673.23 | 5000.00 |
4.1. Quantification Results of PM10 in Ahvaz (2010-2013)
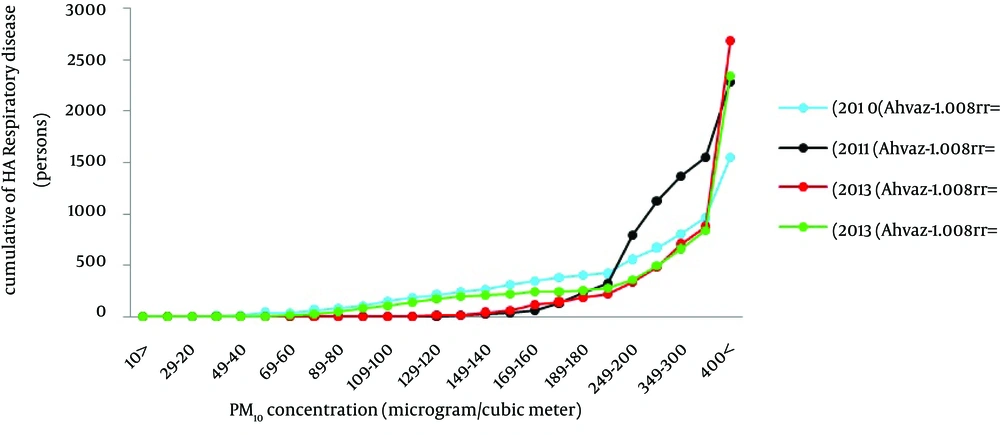
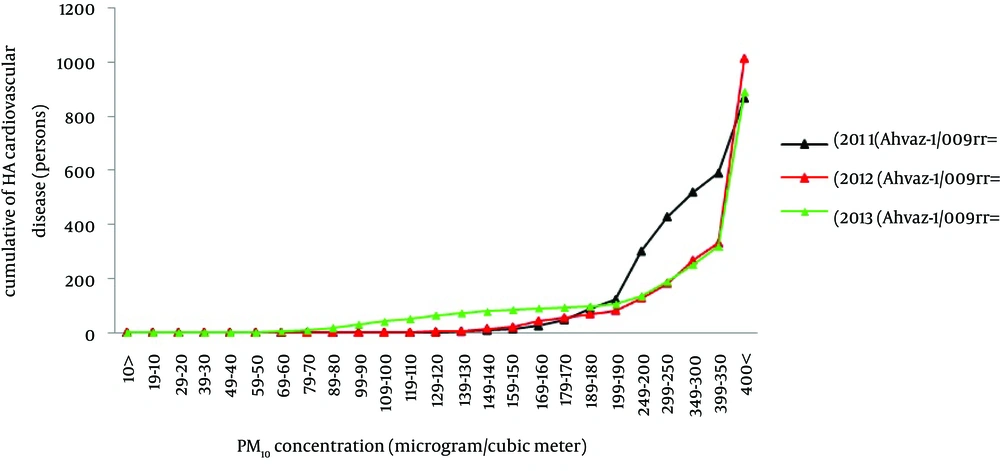
Table 2 indicates that most of cumulative number of respiratory disease cases attributed to PM10 in 2012 was 2675 cases in Ahvaz. The results showed that component attributable to respiratory diseases in Ahvaz has decreased by 2.72% in 2013, whereas Component attributable has increased from 2010 until 2012. Table 3 indicates that most of cumulative number of cardiovascular disease cases attributed to PM10 in 2012 was 1014 cases in Ahvaz. The results showed that Component attributable to cardiovascular diseases in Ahvaz had decreased by 2.91% in 2013.
| Indicator Estimate | RR, Medium | AP, % | Attributable Excess Cases, Persons |
|---|---|---|---|
| Ahvaz city (2010) | 1.008 | 12.6962 | 1551.7 |
| Ahvaz city (2011) | 1.008 | 18.6568 | 2277.9 |
| Ahvaz city (2012) | 1.008 | 21.8864 | 2675.0 |
| Ahvaz city (2013) | 1.008 | 19.16 | 2342.1 |
| Estimate | Indicator | ||
|---|---|---|---|
| RR, Medium | AP, % | Attributable Excess Cases, Persons | |
| Ahvaz city (2011) | 1.009 | 20.5160 | 866.5 |
| Ahvaz city (2012) | 1.009 | 23.9665 | 1013.6 |
| Ahvaz city (2013) | 1.009 | 21.05 | 890.4 |
4.2. Quantification Results: Cardiovascular and Respiratory Disease cases vs. PM10 Concentration for Calculated Relative Risk (Ahvaz, 2010-2013)
Figures 1 and 2 illustrate the figures of quantification results of cardiovascular and respiratory disease cases affected by particulates and pollutants concentrations based on cumulative number. The plots show the number of cases during four years (2010-2013). Figures 1 and 2 indicate that ascending health study cases in Ahvaz (referrals to hospitals admission to cardiovascular and respiratory diseases) increase Garlic uniform with increments in concentrations of PM10 by 10-200 μg in 2010 and it raised sharply by the concentrations more than 200μg, while it showed Garlic uniform in 2011 in concentrations of 150-200 μg and it raised sharply by the concentrations more than 200 μg. In addition, most of the rise in the plot of 2012 occurred with the concentrations more than 350 μg. Such rise was less in 2013 than in 2012.
4.3. Quantification Results of PM10 in Ahvaz (2010-2013)
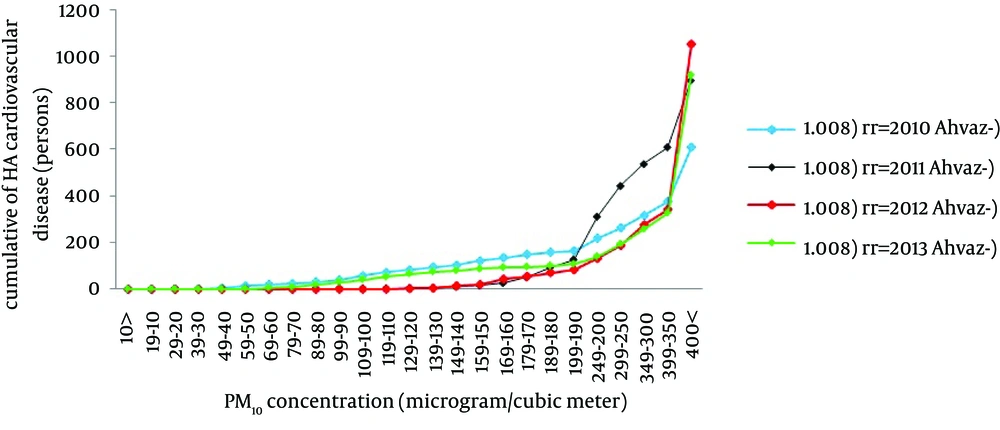
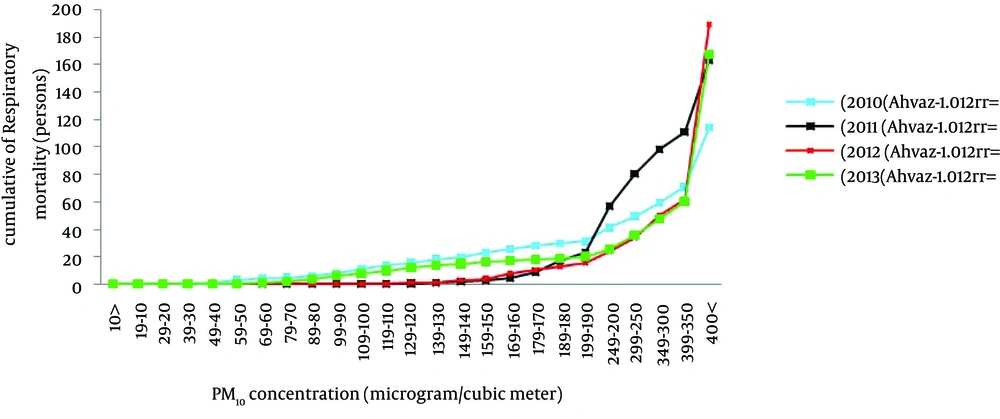
Table 4 indicates that most of cumulative number of deaths due to cardiovascular disease cases attributed to PM10 in 2012 was 1055 cases (21.88%) in Ahvaz. The results showed that Component attributable to cardiovascular diseases in Ahvaz was on rise in 2010-2012, whereas Component attributable has decreased by 2.72% in 2013 with respect to 2012. With regard to calculated relative risk in Table 5, most of cumulative number of respiratory disease cases attributed to PM10 in 2012 was 189 cases in Ahvaz. The results showed that while the attributed deaths increased during 2010-2012, Component attributable to deaths due to respiratory diseases in Ahvaz has decreased by 3.36% in 2013 with respect to 2012.
| Estimate | Indicator | ||
|---|---|---|---|
| RR, Medium | AP, % | Attributable Excess Cases, Persons | |
| Ahvaz city (2010) | 1.008 | 12.6962 | 612.1 |
| Ahvaz city (2011) | 1.008 | 18.6568 | 898.5 |
| Ahvaz city (2012) | 1.008 | 21.8864 | 1055.1 |
| Ahvaz city (2013) | 1.008 | 19.16 | 923.8 |
| Estimate | Indicator | ||
|---|---|---|---|
| RR, Medium | AP, % | Attributable Excess Cases, Persons | |
| Ahvaz city (2010) | 1.012 | 17.9075 | 114.6 |
| Ahvaz city (2011) | 1.012 | 25.5974 | 163.7 |
| Ahvaz city (2012) | 1.012 | 29.59 | 189.4 |
| Ahvaz city (2013) | 1.012 | 26.23 | 167.9 |
4.4. Quantification Results: Cardiovascular and Respiratory Disease Cases vs. PM10 Concentration for Calculated Relative Risk (Ahvaz, 2010-2013)
Figures 3 and 4 illustrate the plots of quantification results of cardiovascular and respiratory disease cases affected by particulates and pollutants concentrations based on cumulative number. The plots show the number of cases in relative risk during four years (2010-2013). Figures 3 and 4 indicate that Ascending health study cases in Ahvaz (referrals to hospitals due to cardiovascular and respiratory diseases) increase Garlic uniform with increments in concentrations of PM10 by 10-200 μg in 2010 and it raised sharply with the concentrations more than 200 μg, while it showed Garlic uniform in 2011 with the concentrations of 150-200 μg and it raised sharply with the concentrations more than 200 μg. In addition, most of the rise in the plot of 2012 occurred with the concentrations more than 350 μg. Such rise was less in 2013 than in 2012.
5. Discussion
5.1. Quantifying Health Impacts of PM10 (Ahvaz, 2010-2013)
Results from samples of particulates in Ahvaz air showed that annual average concentration of PM10 has increased from 2010 to 2013, which reached 917.12 μg.m-3 in 2013. During 2010-2011, PM10 concentration was more in summer than in winter, whereas this was more in winter than in summer during 2012-2013. Maximum annual average PM10 concentration was 10 mg.m-3 which observed in summer, 2012. Moreover, results showed that during four years, maximum concentration of PM10 in Ahvaz air samples was related to summer. Results obtained from formulating epidemiological indexes with considering mean relative risk in Ahvaz showed that amount attributable to deaths due to cardiovascular diseases in 2010 to 2013 was 12.69%, 18.65%, 21.88% and 19.16%, respectively. By considering baseline incidence of 497 per 100,000 individuals for deaths due to cardiovascular diseases, cumulative number cases of such deaths in 2010 to 2013 was 612, 898, 1055 and 924 individuals, respectively. The most number of the days with exposure to PM10 in Ahvaz in 2010 to 2013 was related to concentrations above 400 μg.m-3 with most death cases due to cardiovascular diseases (234 persons in 2010, 288 persons in 2011, 711 persons in 2012 and 594 persons in 2013) occurred in such concentrations. Thirty six percent of all death tolls due to cardiovascular disease in 2010, 33% in 2012 and 43% in 2013 occurred in days with concentration less than 400 μg.m-3. Forty-nine percent of all death tolls due to cardiovascular disease in 2011 occurred in days with concentration less than 300 μg.m-3. Amount attributable to deaths due to respiratory diseases in 2010 to 2013 was 17.90%, 25.59%, 29.59% and 26.23%, respectively. By considering baseline incidence of 66 per 100,000 individuals for deaths due to respiratory diseases, cumulative number cases of such deaths in 2010 to 2013 was 115, 164, 189 and 168 individuals, respectively. The most number of the days with exposure to PM10 in Ahvaz in 2010 to 2013 was related to concentrations above 400 μg.m-3 with most death cases due to respiratory diseases (44 persons in 2010, 52 persons in 2011, 128 persons in 2012 and 108 persons in 2013) occurred in such concentrations. Thirty-two deaths was recorded due to respiratory disease in 2011, 41% in 2012 and 47% in 2013 occurred in days with concentration less than 400 μg.m-3. In 2010, 51% of all death tolls due to respiratory disease occurred in days with concentration less than 250 μg.m-3. Amount attributable to referrals to hospitals due to respiratory diseases in 2010 to 2013 was 12.69%, 18.65%, 21.88% and 19.16%, respectively. By considering baseline incidence of 1260 per 100,000 individuals for referrals to hospitals due to respiratory diseases, cumulative number cases of such referrals in 2010 to 2013 was 1552, 2278, 2675 and 2342 individuals, respectively. The most number of the days with exposure to PM10 in Ahvaz in 2010 to 2013 was related to concentrations above 400 μg.m-3 with most cases of referrals to hospitals due to respiratory diseases (591 persons in 2010, 729 persons in 2011, 1802 persons in 2012 and 1507 persons in 2013) occurred in such concentrations. Amount attributable to referrals to hospitals due to cardiovascular diseases in 2011 to 2013 was 20.51%, 23.96% and 21.05%, respectively. By considering baseline incidence of 436 per 100,000 individuals for referrals to hospitals due to cardiovascular diseases, cumulative number cases of such diseases in 2011 to 2013 was 866, 1014 and 890 persons, respectively. The most number of the days with exposure to PM10 in Ahvaz in 2010 to 2013 was related to concentrations above 400 μg.m-3 with most cases of referrals to hospitals due to cardiovascular diseases (277 persons in 2010, 683 persons in 2011, 573 persons in 2012 and 501 persons in 2013) occurred in such concentrations.
Review and meta-analysis was conducted to determine the effects of short-term exposure on mortality that increasing 10 µg/m3 showed estimated by the Bangkok 1.7%, Mexico 1/83%, and Santiago 1.1%, Inchoan 0.8% and Bryson, Australia 1.6% (20-24). High percentage of the observed health endpoints in this study was associated with high concentration of measured PM10 in Ahvaz. In Tominz et al. study, to evaluate the health effects of PM10 by using of AirQ model in Trieste city, Italy, during 2005. Based on the results of this study, 1.8% of all respiratory mortality and 2.5% of all deaths were attributed to respiratory concentrations over 20 µg/m3 (25). The results this study shows that concentration of PM10 in Ahvaz is very high compared to Trieste city. In similar work Zallaghi exploited AirQ model to estimate the PM10 hygienic effects in Bushehr, Iran, during 2010. Based on their results, almost 14% of cardiovascular diseases and 19% Respiratory diseases was attributed to PM10 concentrations over 20 µg/m3 (26). Based on the results of my study, number of cases health effects was the relatively higher because of concentration greater in Ahvaz city. Also Goudarzi et al. evaluated the health effects of PM10 by using of Air Q model in Tehran, Iran, during 2008. Based on the results of this study, 4% of all Respiratory mortality was attributed to PM10 concentrations over 20 µg/m3 (27). Results of this study are different comparing with Goudarzi's study because of the geographic, demographic, and climate characteristics. Although the results of this study are in line with results of other researches around the world, there is still high need to further studies to specify local RR and BI regarding the geographic, demographic and climate characteristics.


