1. Background
Air pollution due to industrialization and urbanization is one of the important issues in the current century, especially in developing countries (1-3). Air pollution is a serious risk, so much so that even low concentrations of air pollution can be harmful to human health (4-6). Epidemiological studies have shown that more than 80% of people age 65 years and over have one or more chronic diseases, and approximately 50% of them have activity limitations (5, 7). Among ambient air pollutants, particulate matter (PM) is the pollutant with the most undesired adverse effects on human health (8). Many studies have reported the strong correlation between PM concentrations and hospital admissions due to the chronic or acute respiratory and cardiovascular diseases (9-11). PM with aerodynamic diameters of less than or equal to 10 μm (PM10) has the greatest adverse impact on human health (12, 13). Epidemiological studies have shown that more than 500,000 Americans die each year due to cardiovascular diseases associated with PM10. Respiratory diseases are also hazardously attributed to PM10 (14-16). In recent years, because of the middle eastern dust (MED) storms, especially from the Arabian Peninsula and Iraq, the areas of south, west and southwestern Iran have been affected by exposure to PM10. MED storms have led to thousands of hospital admissions for cardiovascular and respiratory diseases (17-19).
Khorramabad is the capital city of the Lorestan province, in southwestern Iran. It has been exposed to large amounts of PM10 as a result of MED events. The air quality health impact assessment (AirQ2.2.3) software is a program that has been applied to assess the health impact of PM10 (19-21), and several studies have been carried out to examine the relationship between health impacts and PM10 concentrations. Fattore et al. showed a relationship between health impacts and air quality using AirQ software in two municipalities in an industrialized area of Northern Italy (22). Shahsavani et al. reported that high concentrations of PM due to dust events caused adverse effects to human health during dust storms in Ahvaz, Iran. The longest dust events in their study happened in July, lasted five days, and had a peak PM10 concentration of 2028 µg/m3 (20). Zhou et al. showed that there was a significant association between PM10 concentrations and mortality from cardiopulmonary diseases in middle-aged Chinese men (7). In another study, Zallaghi et al. demonstrated that cardiovascular and respiratory mortalities, as well as hospital admissions due to such diseases, were increased by exposure to PM in Ahvaz, Iran (2). Similarly, Jeong reported the relationship between PM10 concentrations and total mortality, cardiovascular and respiratory mortality, and hospital admissions for cardiovascular and respiratory diseases (23). Mohammadi et al. showed that the largest numbers of deaths occurred because of an increase in the number of dusty days (24). Also, several similar studies, such as Gharehchahi et al. (25), Brook et al. (26), Schwartz et al. (27), Brauer et al. (28), Dockery et al. (29), and Gholampour et al. (30) were conducted to assess air quality in terms of PM and its health risks to humans.
2. Objectives
The aims of this study were to evaluate the relationship between air quality and health endpoints of PM10 in Khorramabad, Iran using the AirQ2.2.3 model.
3. Materials and Methods
3.1. The Study Area
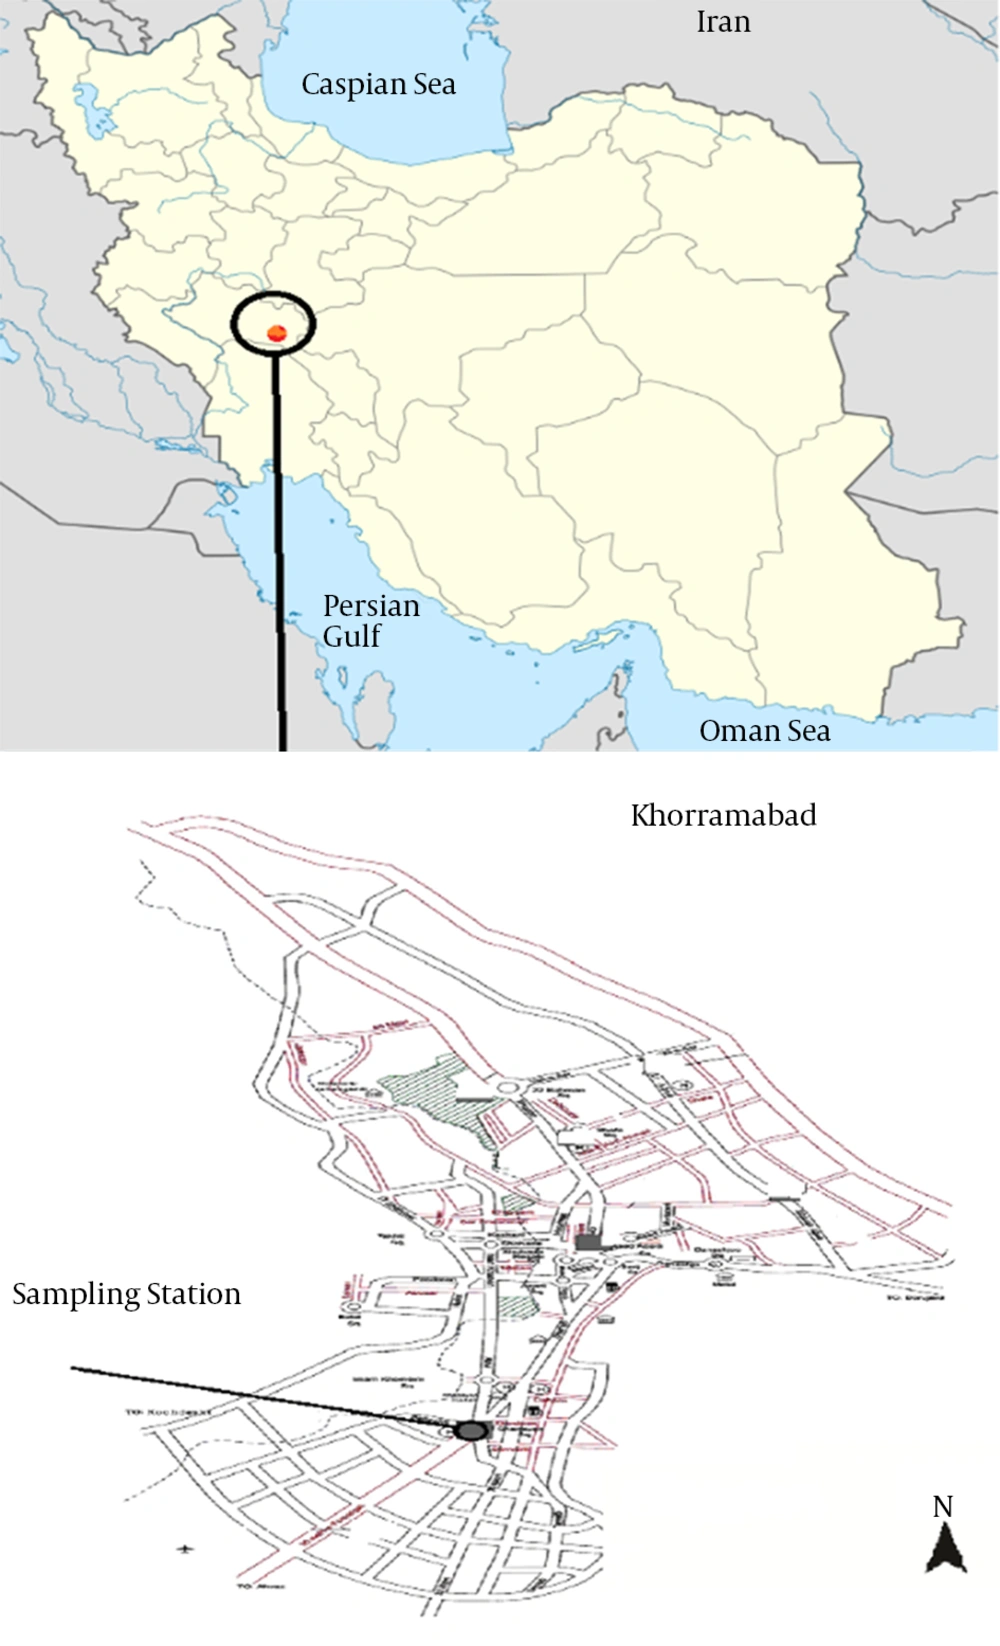
Khorramabad is the capital city of the Lorestan province, in southwestern Iran; its coordinates re 33°29′16''N and 48°21′21''E (Figure 1). Based on the latest census report, from 2014, the city has a total population of 540,000.
3.2. Air Sampling
The PM10 sampling was carried out using a high-volume sampler (Anderson Model) at a flow rate of 1.1 - 1.4 m3/min and located three meters above ground level. The sampling station was located in the center of Khorramabad. Six samples were collected every week for a period of one year (January to December 2014). PM10 levels were recorded every 30 minutes during a daily 24-hour period.
3.3. Meteorological Data
The wind speed and direction, relative humidity (RH), and ambient air temperature during the sampling period were obtained from the Iranian meteorological organization’s website (www. Weather.ir).
3.4. Air Quality and AirQ2.2.3 Software Model
In this study, PM10 concentrations were investigated to determine air quality according to data provided by the environment protection organization of Iran (31). Air quality is categorized to six types, good, healthy, unhealthy, very unhealthy, and hazardous. Table 1 shows the relationship between PM10 levels and air quality condition for a 24-hour period (17, 31).
| PM10, g/m3µ | Condition |
|---|---|
| 0 - 50 | Good |
| 51 - 150 | Healthy |
| 151 - 350 | Unhealthy |
| 351 - 420 | Very unhealthy |
| 420 < | Hazardous |
The AirQ2.2.3 software model, developed by the WHO European Center for Environment and Health, Bilthoven Division was used in the present study (5, 22). This program is used to approximate the effect of exposure to definite air pollutants on the people living in a certain time and region (32). The assessment is based on the attributable proportion (AP), which is described as the portion of the health result in a certain residents attributable to contact with a given air pollutant (22). The AP is easily calculated using Equation 1:

Where AP and RR (cc) are the attributable proportions of the health impact and relative risk for a certain health effect in the group c of exposure, respiratory. Also, P (c) is the proportion of the target population in group c of exposure (21). The amount attributable to the population exposure can be determined by the following equation, if the baseline frequency of the health impact in the studied population is identified (33).

Where IE and I are the rate of the health impact attributable to the contact and the baseline frequency of the health impact in the population, respectively. Finally, considering the population size, the total number of excess cases attributable to the exposure is specified by Equation 3.

Where NE is the number of people attributed to the exposure, and N is the total number of evaluated residents (4). The RR gives the increase in the possibility of the adverse endpoint relationship to a given change in exposure levels and comes from time-series studies where day-to-day changes in air pollutants over long periods were associated with daily mortality, hospital admissions, and other public health indicators. The RR values used for PM10 analyses were derived from the studies by Fattore et al. (22) and Gholampour et al. (30).
3.5. Inputs Adjustment
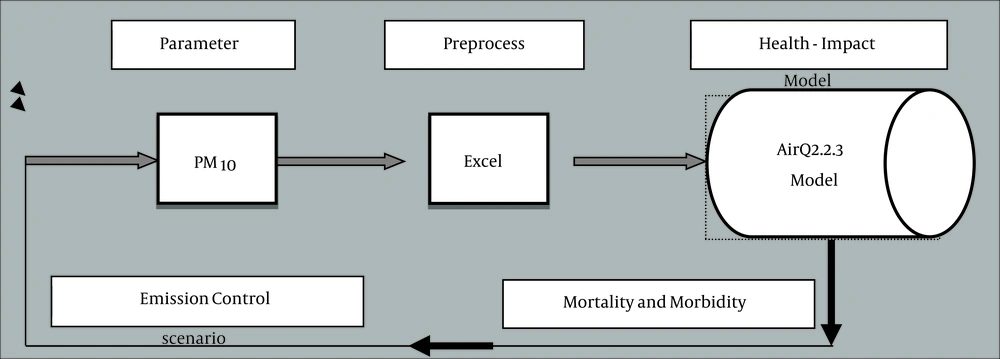
The average diurnal concentrations of PM10 were applied in the study. The mortality and morbidity rates associated with the PM10 were calculated using AirQ Version: 2.2.3. Finally, the numbers of persons for total mortality, cardiovascular mortality, respiratory mortality, hospital admissions because cardiovascular diseases, and hospital admissions due to respiratory diseases were estimated by relative risk and baseline incidence (1, 22). Figure 2 shows the schematic plane of the estimate of mortality and morbidity rates using AirQ2.2.3.
4. Results
4.1. PM10 Concentrations
In this study, 312 samples were collected. The PM10 concentrations across the different months of the study, from January through December 2014, are presented in Table 2. As shown, the maximum concentration of PM10 was obtained in July, with an average concentration of 136.48 µg/m3. The highest and lowest seasonal mean concentrations of PM10 were observed during the summer and winter, respectively.
| Month | Averagea | Maximum |
|---|---|---|
| January | 46.80 ± 31.80 | 119.2 |
| February | 47.25 ±33.84 | 140.5 |
| March | 57.27 ± 35.66 | 13.9 |
| April | 56.03 ± 34.89 | 158.6 |
| May | 54.64 ± 42.08 | 200.1 |
| June | 88.54 ± 49.98 | 421.0 |
| July | 136.48 ± 86.25 | 265.2 |
| August | 117.7 ± 100.55 | 476.0 |
| September | 110.52 ± 55.54 | 183.3 |
| October | 119.52 ± 62.33 | 212.9 |
| November | 65.78 ± 48.08 | 422.2 |
| December | 69.04 ± 39.66 | 156.0 |
| Overall | 80.59 ± 49.91 | 476.0 |
aData are presented as mean ± SD.
4.2. Meteorological Parameters
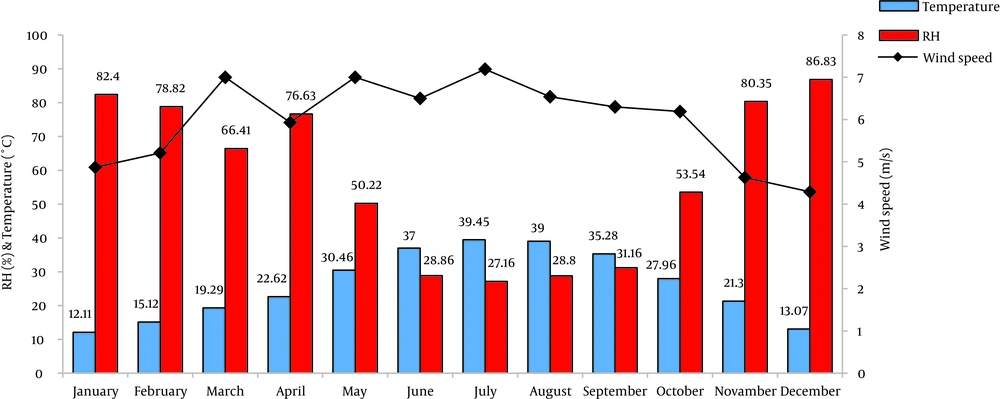
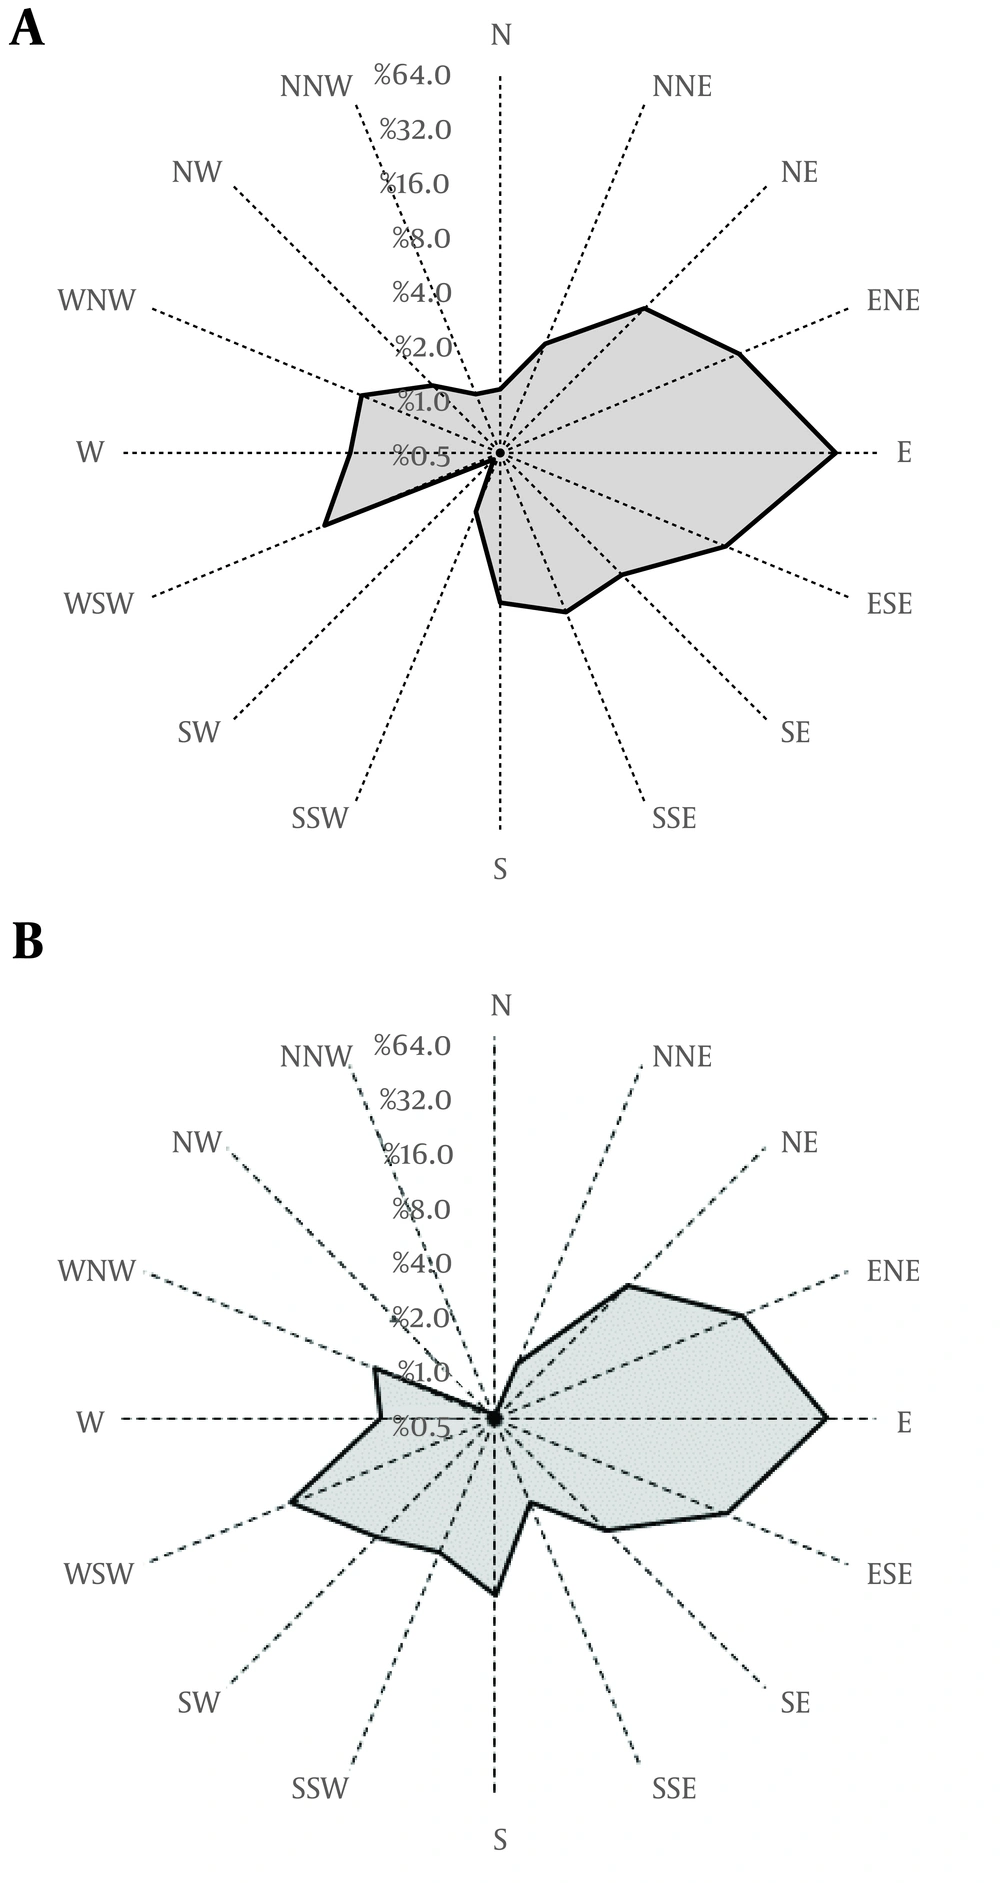
The meteorological parameters, including wind speed, RH, and ambient air temperature are shown in Figure 3. As seen, the peak wind speeds increase from September to February and then reduce. The highest wind speed occurred in July, with the mean of 7.19 m/s. Seasonal wind rose plots over the sampling period are presented in Figure 4A and B. Eastern and southeastern winds were the prevailing and semi-prevailing winds in the Khorramabad are during the sampling period, respectively.
4.3. Air Quality
The seasonal air quality in Khorramabad, in terms of PM10 concentrations according to the environment protection organization of Iran in 2014 are illustrated in Table 3. As can be seen, according to the National Ambient Air Quality Standards (NAAQS), the most days with air quality ratings of unhealthy, very unhealthy, and hazardous (with PM10 concentrations higher than 150 µg/m3 during the sampling period) were observed in the summer. Of course, the number of days with dangerous air quality was equal in the summer and fall seasons.
| PM10, µg/m3 | Classification | Winter | Spring | Summer | Fall |
|---|---|---|---|---|---|
| 0 - 50 | Good | 44 (55.7) | 45 (48.4) | 3 (3.7) | 19 (26.8) |
| 51 - 150 | Health | 29 (36.7) | 33 (35.4) | 33 (40.7) | 28 (39.4) |
| 151 - 350 | Unhealthy | 6 (7.6) | 8 (8.6) | 30 (37) | 12 (16.9) |
| 351 - 420 | Very unhealthy | 0 | 6 (6.5) | 12 (14.8) | 9 (12.7) |
| > 420 | Danger | 0 | 1 (1.1) | 3 (3.7) | 3 (4.2) |
| Overall | 79 (100) | 93 (100) | 81 (100) | 71 (100) |
aData are presented as No. (%).
4.4. Health Impact Assessment
The annual, summer, and winter averages of PM10 concentrations were obtained and equaled 80.59, 102.90, and 85.28 µg/m3, respectively. The total mortality, cardiovascular mortality, respiratory mortality, and hospital admissions resulting over the study period were estimated, and the results are given in Table 4. The total number of mortalities related to the PM10 concentrations was 320, at the upper end of relative risk.
| Health Effect/Indicator Estimate | Relative Risk | Estimated AP, % | Estimated Number of Excess Cases (Persons) |
|---|---|---|---|
| Total mortality | |||
| Lower | 1.0062 | 5.0556 | 235.0 |
| Mean | 1.0074 | 5.9767 | 278.0 |
| Upper | 1.0086 | 6.8794 | 320.0 |
| Cardiovascular mortality | |||
| Lower | 1.0050 | 4.1182 | 146.4 |
| Mean | 1.0080 | 6.4303 | 93.7 |
| Upper | 1.0180 | 13.3918 | 304.8 |
| Respiratory mortality | |||
| Lower | 1.0080 | 6.4303 | 19.4 |
| Mean | 1.0120 | 9.3450 | 28.2 |
| Upper | 1.0370 | 24.1182 | 72.9 |
| Hospital admissions for respiratory diseases | |||
| Lower | 1.0048 | 3.9621 | 229.0 |
| Mean | 1.0080 | 6.4302 | 372.0 |
| Upper | 1.0112 | 8.7714 | 507.0 |
| Hospital admissions for cardiovascular diseases | |||
| Lower | 1.0060 | 4.9015 | 98.0 |
| Mean | 1.0090 | 7.1764 | 14.4 |
| Upper | 1.0130 | 10.0955 | 201.0 |
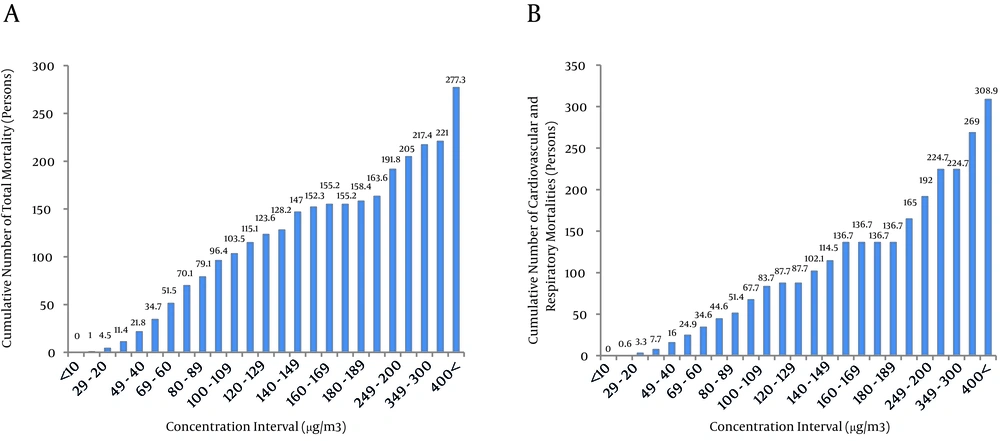
Figure 5A demonstrates the total mortality for people exposed to different levels of PM10. The greatest percentage of person-days was in relation to concentration intervals of 60 - 69 µg/m3 of PM10, which shows the maximum exposure days to PM10 observed at these concentration ranges that led to total mortality. In addition, Figure 5A also indicates that 89.4% of all mortalities occurred on days with PM10 concentrations not exceeding 200 μg/m3. According to Figure 5B, the maximum percentage of person-days occurred at level intervals 40 - 49 μg/m3 of PM10. In addition, 84.38% of the cardiovascular mortalities occurred on days with concentration intervals less than 200 μg/m3 and, as a result of it, 304 people died (Table 4).
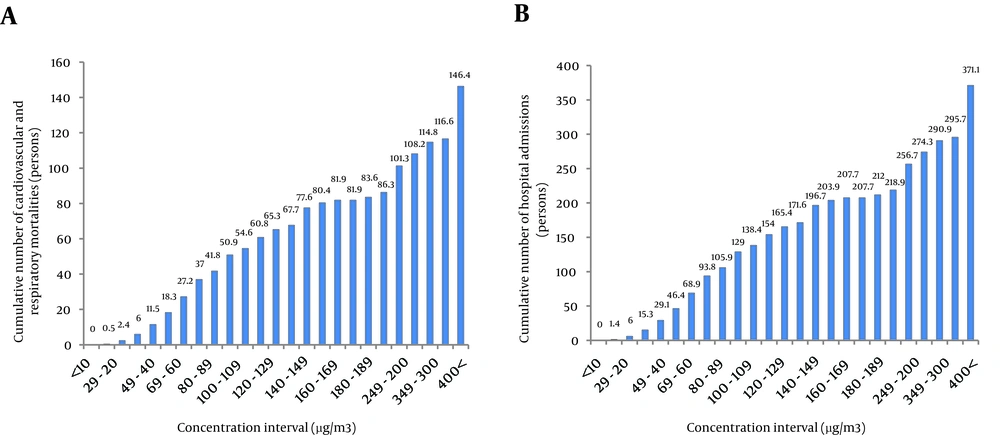
Figure 6A shows the highest percentage of person-days when people were affected by PM10 level intervals detected at the concentration range of 60 - 69 μg/m3, which led to respiratory mortality. Figure 6A also illustrates that 10.6% of respiratory mortalities occurred on days with PM10 levels exceeding 200 μg/m3. Based on Figure 6B, 88.54% of hospital admissions for respiratory diseases occurred on days with PM10 levels less than 200 μg/m3. Figure 6B also showed that the maximum percentage of person-days was associated with concentration intervals of 60 - 69 µg/m3 of PM10, which demonstrated the highest exposure days to PM10 observed at these level ranges.
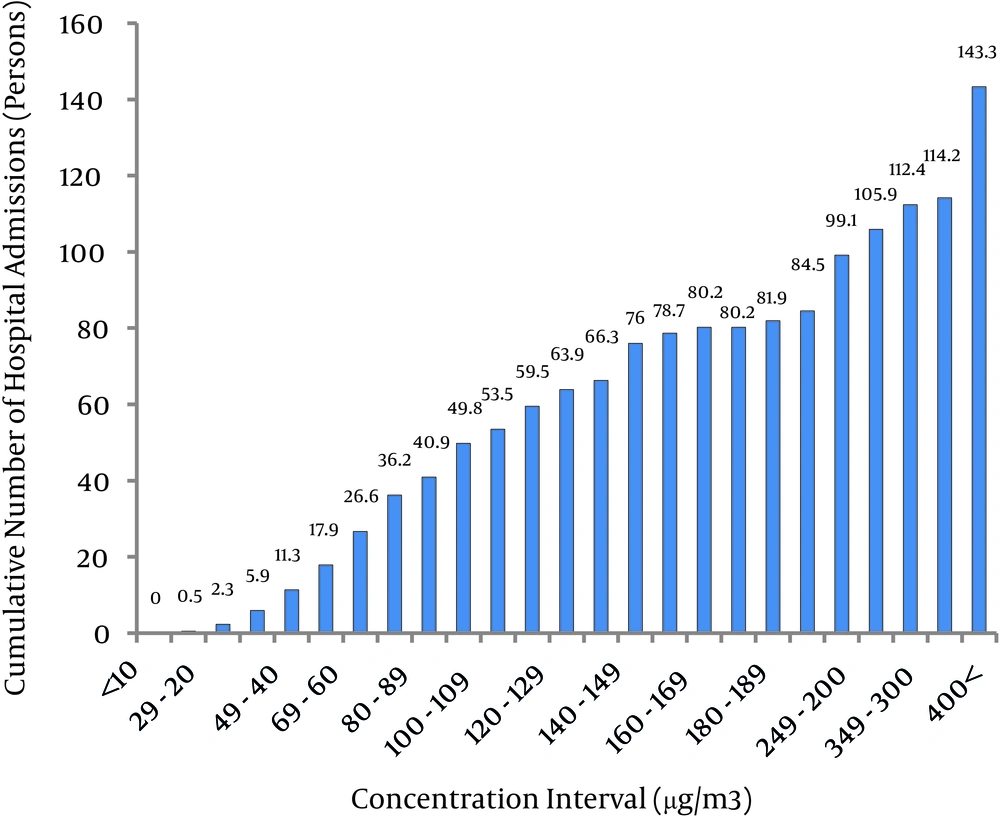
Figure 7 shows the percentage of time to which people were exposed to PM10, which led to hospital admissions for cardiovascular diseases. As demonstrated, the greatest percentage of person-days was in relation to the concentration intervals of 60 - 69 µg/m3 of PM10, which caused the hospital admissions for respiratory disease. In addition, 6.3% of hospital admissions for respiratory diseases were estimated on days with PM10 levels less than 20 μg/m3.
5. Discussion
In this study, we investigated air quality and estimated numbers of mortality and morbidity due to exposure to particulate matter (PM10) in Khorramabad, Iran. The results showed that the overall mean amount of PM10 was 80.59 µg/m3. The maximum PM10 concentration during the measurement, with a peak 476.0 µg/m3, was observed in August (Table 2). Most of the dusty days in this region occurred during the month of July. This finding is agreement with the results of Draxler et al. (34), Mirhosseini et al. (13), and Shahsavani et al. (20). Summer and winter had the highest and the lowest 24-hour averages of PM10 concentration during the study, respectively. Mohammadi et al. illustrated that the average PM10 concentrations in 2012 and 2013 were 111.95 and 70.6 µg/m3, respectively in Shiraz, Iran. In their study, the maximum PM10 concentration was also observed in the summer, during 2012 (960.88 µg/m3) and 2013 (192.49 µg/m3), while the maximum PM10 concentration of 476.0 µg/m3 occurred in our study (24). Gholampour et al. reported that the maximum and annual average concentrations of PM10 in Tehran (Iran) were noted at 230 and 85.3 µg/m3, respectively (30). The results of this study showed that maximum and annual average concentrations of PM10 in Khorramabad were relatively high, compared to Tehran. Zallaghi et al. reported that the annual, summer, and winter average concentrations of PM10 in Kermanshah were 89.54, 117.91, and 60.06 µg/m3, respectively (21). Shahsavani et al. showed that the mean and maximum annual PM10 concentrations noted in Ahvaz in April and September 2010 were 319.6 µg/m3 and 2028 µg/m3, respectively, which were higher than the maximum and annual average concentrations found in the present study. (20) In addition, most of the dusty days in Ahvaz occurred in the spring and summer seasons, which is consistent with the results of this study. The high wind speeds corresponded to the sharp peak in maximum levels of PM10 observed during the month of July. The temperature gradually increased from February through August, and then decreased from September through January. In contrast, the RH increased from October through April, and subsequently continued to decrease thereafter. Both the maximum temperature and minimum RH were observed in July. This phenomenon can create ideal conditions for the observation of maximum concentrations of PM10 and the occurrence of dust storms. In addition, there was an attractive relationship between increases and decreases in wind speed, RH, and temperature. These winds can be considered in relation to the sources of dust events in Iraq and Saudi Arabia, which are particular sources of dust storms in Middle East. These storms transfer large volumes of mineral dust and, subsequently, cause several kinds of adverse health endpoints in Khorramabad. This may be due to unstable meteorological conditions during different time intervals, which had a determining role in the formation of powerful winds (Figures 3 and 4). Shahsavani et al. reported that western and southwestern winds were the most common winds in Ahvaz, Iran, and the primary sources of Ahvaz’s dust storms are origin points in Kuwait, Iraq, and Saudi Arabia (20). The total number of non-standard days (PM10 >150 µg/m3) in this study was calculated at 90 days, while the greatest number of non-standard days occurred during the summer, with the amount of 45 (Table 3). Pirsaheb et al. (31) reported that the most non-standard days occurred in the summer in Kermanshah, Iran. The results of this study showed that the number of non-standard days (PM10 > 150 µg/m3) in Khorramabad was lower than the numbers for Kermanshah (31) and Tehran (30) during 2014. Increases in PM10 concentrations over the summer in Khorramabad can be in associated with MED storms from arid areas of Iraq, Kuwait, and Saudi Arabia, which are the particular sources of dust events in the western and southwestern parts of Iran.
This paper is a cross-sectional study in which the health endpoints of exposure to PM10, such as cardiovascular and respiratory mortality and hospital admissions for cardiovascular and respiratory diseases, were estimated. AirQ2.2.3 software assumes that the first six months of the year are summer and other six months are winter (2). According to Figures 5 - 7, with increasing PM10 concentration intervals, the number of exposure days with PM10 was reduced. In a study by Guo et al. (35), In another study, by Chen et al. in North China, there was a 0.036% increase in hospital admissions per any 10 µg/m³ increase in the PM10 concentration (36). Shakour et al. in Egypt, showed a 4% increase in hospital admissions for respiratory diseases per 10 µg/m³ increase in PM10 concentrations (18). Martuzzi et al. showed that total mortality as a result of exposure to PM10 levels above 20 μg/m3 was 677 persons in Milan, Italy. Goudarzi et al. illustrated that 4% of the total mortalities occurring in Tehran, Iran were associated with PM10 concentrations above 20 µg/m3 (37) (38). In a similar work, Hosseini et al. showed that the number of excess cases due to respiratory mortality was 23 persons, and the number of excess cases for hospital admissions because of respiratory diseases was 118 persons in Sanandaj, Iran (4). Gholampour et al. (30). Tominz et al. reported that 1.8% of natural mortalities, 2.2% of cardiovascular mortalities, and 2.5% of respiratory mortalities in Trieste, Italy were due to exposure to PM10 levels exceeding 20 μg/m3 (19). Mohammadi et al. showed that 25.3% of total mortalities, 1.1% of cardiovascular mortalities, 0.3% of respiratory mortalities, and 3.3% of hospital admissions for cardiovascular diseases in 2012 in Shiraz were in relation to PM concentrations higher than 40 μg/m3 (24). A comparison between the results of the present study with other studies showed that higher mortality rates in Khorramabad can be a result of higher average PM10 levels or higher numbers of exposure days. Studies of 29 European cities and 20 American cities showed that the mortality rates there increased by 0.5% after PM10 daily increases of 10 μg/m3 (39, 40).
In present study, health endpoints of exposure to particulate matter (PM10) were assessed using the AirQ2.2.3 software model. The results revealed that 5.66% of total mortalities in Khorramabad were related to levels of PM10 above 20μg/m3. In order to diminish the health endpoints of PM in Khorramabad, health trainings led by health systems officials should be carried out for the public, especially for people with chronic lung and heart diseases, the elderly, and children, so they will know to reduce their activities on dusty days. In addition, these efforts should be conducted at the government level, in order to control the dust events sources.
