1. Background
Noise and air pollutants have different modes of transport, half-lives, measurements, origins, and mechanisms of effect on human health (1-9). Traffic is a shared source of noise and air pollution, and it contributes more than 50% of the total environmental noise and air pollution load of urban areas (10-14). Health effects including cardiovascular, respiratory, and neurobehavioral diseases have been associated with both traffic noise and air pollution exposure (3, 15, 16). High traffic volume, traffic noise, and high concentrations of air pollutants may occur in curbside open-air microenvironments, and people are frequently exposed to the polluted microenvironments due to their occupational activities. For these reasons, a uniform methodology is necessary to evaluate average noise and air pollution levels of the microenvironments in urban areas. Vehicular pollution levels in terms of Noise-Air pollution have been studied extensively in the cities of Viana do Castelo, Portugal, and Kolkata (17, 18).
2. Objectives
The objective of the current research was evaluation of seasonal variations of average traffic pollution level (ATPL) in terms of traffic noise and concentrations of PM2.5 and NO2 in curbside open-air microenvironments in Kolkata, India.
3. Materials and Methods
3.1. The Study Area
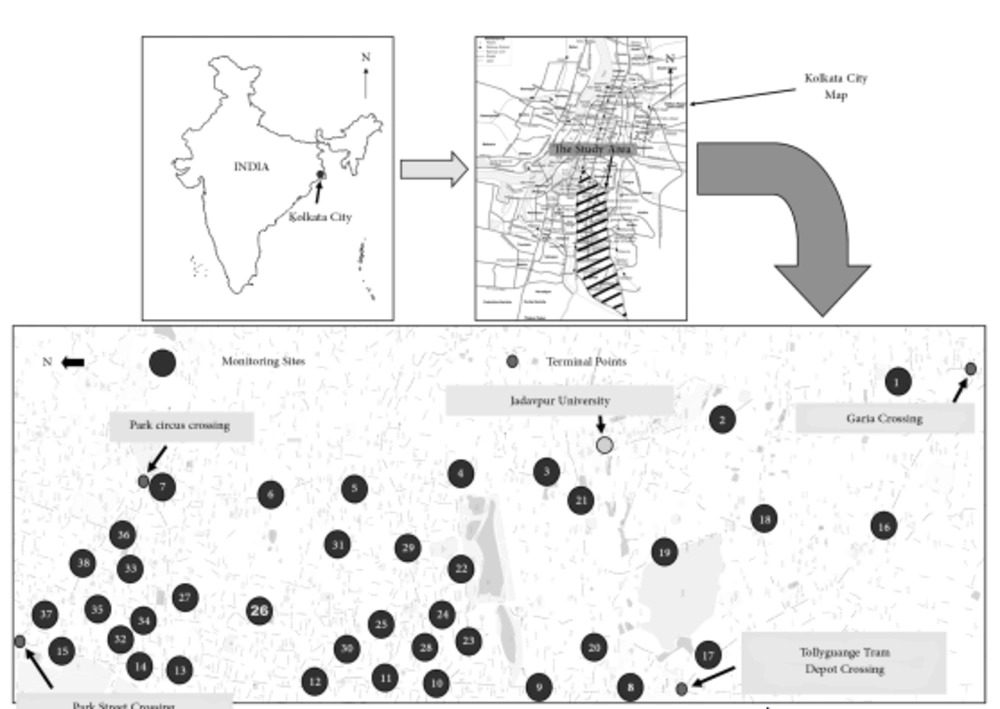
Kolkata is the capital of the state of West Bengal, India, and is also one of the country’s most populous and polluted cities (18-20). The city is bounded to the west and north-west by the Hooghly River and has a tropical savannah climate with a marked monsoon season (21). The city is divided into five major geographical regions: east, west, north, south, and central Kolkata. There is little demarcation between areas used for residential, industrial, and commercial activities. The land under the Kolkata Municipal Corporation covers an area of 187 km2. The study area comprised four important traffic intersections of south Kolkata: Park Street (22°33’17.23”N, 88°21’50.14”E), Park Circus (22°32’35.82”N, 88°21’58.14”E), Garia (22°27’57.08”N, 88°22’40.10”E), and the Tollygunge. Tram Depot (22°29’35.10”N, 88°20’43.04”E). A total of 38 monitoring sites were chosen on 21 major roads within the study area. The roads had minimum, maximum, and average widths of 7 m, 31 m, and 18.50 ± 6.40 m respectively. Selection of monitoring sites was limited to those within a maximum commuting time of 30 min from Jadavpur University (Figure 1).
3.2. Comprehensive Plan for Data Collection
Primary data on variables were collected according to the following monitoring program. Number of total motorized vehicles (TMV), traffic noise, and concentrations of PM2.5 and NO2 were monitored for 4 hours at the curbside open-air microenvironments of 38 sites within the study area. Simultaneous data on air temperature, relative humidity, and wind speed were recorded from a roof-top automated weather monitoring station (WM250, Envirotech) at the Jadavpur University campus. At each monitoring site, three consecutive 4 hours monitoring sessions were performed over two different consecutive week days. On the first day the monitoring was performed between 04:00 p.m. and 08:00 p.m., and on the second day the monitoring was performed between 08:00 a.m. and 12:00 noon and between 12:00 noon and 04:00 p.m. The three consecutive 4 hours monitoring sessions were repeated in the pre-monsoon season (summer) of the year 2012 (March 2012 - May 2012) and 2013 (March 2013 - May 2013) and post-monsoon season (winter) of the year 2011 - 2012 (November 2011 - February 2012) and 2012 - 2013 (November 2012 - February 2013). Finally, 12 hours time-weighted averages (TWA) for all variables were determined from each set of three 4 hours hour monitoring sessions. Thus, a total of 38 sets of data (a pre-monsoon and post-monsoon 12 hours average at each site) were generated for each variable.
3.3. Monitoring of TMV
TMV was determined by analysis of 15 min of video footage taken once each hour with a digital camera (DSC-W150, Sony). Motorized vehicles passing through the section of the road observed by the digital camera were counted manually, and hourly motorized traffic volume was determined using a multiplication factor of 4. Finally, TMV for 4 h was determined by adding the 1 hours motorized traffic volumes.
3.4. Monitoring of Traffic Noise and Concentrations of PM2.5 and NO2
Traffic noise level was determined with a Type II sound level meter (SC160, CESVA) under fast operation mode and in terms of A-weighted equivalent noise level. The concentration of PM2.5 was determined with a laser photometer (AM510, TSI). Both instruments were calibrated prior to each monitoring session, and data was logged with 1 sec resolution. The concentration of NO2 was estimated as per the modified Jacob and Hochheiser (Na-Arsenite) method by using a personal sampling pump (SP330, TSI) fitted with a gaseous sampling attachment (APM411, Envirotech). All the instruments were placed parallel to each other on the sidewalk 1 m from the front wall of buildings. The inlets of the air samplers and the microphone were placed 1.5 m above ground level. Any kind of monitoring was stringently avoided in areas of construction and on rainy days during the monsoon season.
3.5. Calculation of Exceedance Factor (EF) and Average Exceedance Factor (AEF)
The exceedance factor (EF) was calculated to describe noise and air pollution levels of the microenvironments. The average exceedance factor (AEF) was calculated to determine ATPL in terms of noise and concentrations of the air pollutants. EF and AEF were determined with the following equations:
Where, Co is the observed traffic noise level or concentration of PM2.5 or NO2 and Cl is the legal limit of traffic noise level or concentration of PM2.5 or NO2. The legal limits for commercial areas prescribed by the central pollution control board (CPCB) of India (22, 23) were used: daytime traffic noise level, 65 dB (A); M2.5 concentration, 60 μg/m3 (24 h TWA); and NO2 concentration, 80 μg/m3 (24 h TWA). EFi is the exceedance factor of the ith pollutant. N is the number of pollutants. An EF and AEF of 1 may be considered the threshold limit of a pollutant or a group of pollutants.
3.6. Interseasonal Comparisons of TMV, Traffic Noise, Concentrations of Air Pollutants, and ATPL
Interseasonal comparisons of TMV, traffic noise, air pollutant concentrations, and ATPL were made through post-monsoon to pre-monsoon (W/S) ratio and correlation analysis. Correlation analysis was performed in the SPSS v20 environment. The correlation between a pair of variables was determined in terms of Pearson’s correlation coefficients. Correlation analysis was also performed to investigate the effect of seasonal variations of air temperature, relative humidity, and wind speed on AEF and ATPL in the city microenvironments.
4. Results and Discussion
4.1. EF of Traffic Noise and Concentrations of Air Pollutants
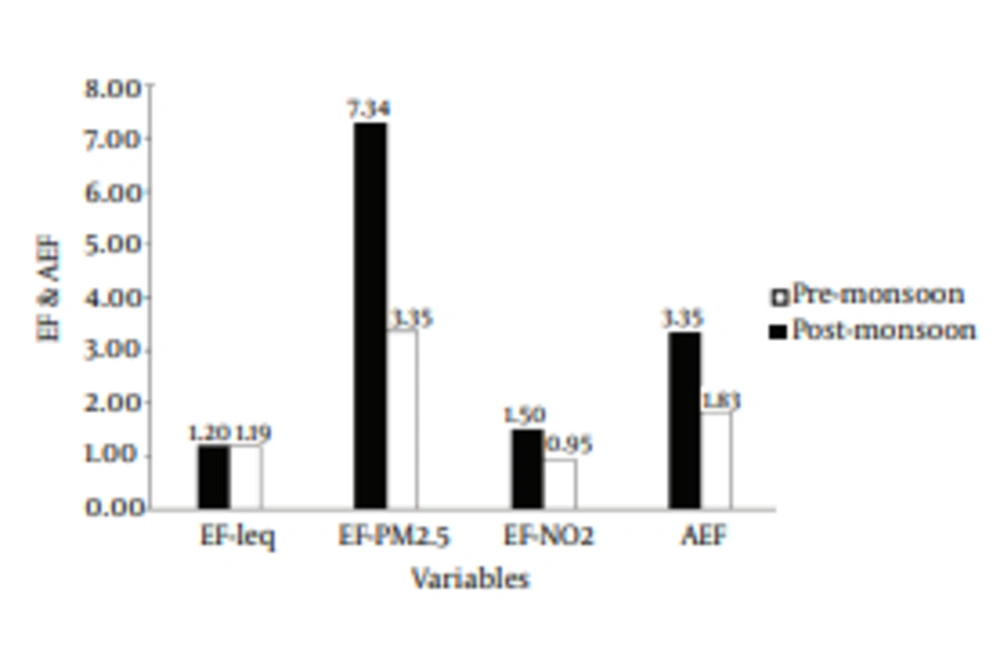
Average EF for traffic noise level (EF-Leq) was 1.20 ± 0.03 in the post-monsoon and 1.19 ± 0.03 in the pre-monsoon season (Figure 2). An EF of > 1 indicates that the traffic noise level was in excess of the daytime commercial area standard prescribed by the CPCB in both seasons. Traffic noise levels greater than the prescribed standard in Indian cities has been reported by a number of researchers (24-27). The average EF for PM2.5 concentration (EF-PM2.5) was 7.34 ± 1.74 post-monsoon and 3.35 ± 0.89 pre-monsoon. An EF of > 1 indicates that the PM2.5 concentration was also higher than the standard prescribed by the CPCB in both seasons. Concentrations of PM2.5 higher than the prescribed standard in Indian cities has also been reported by a number of researchers (28-30). The average EF for NO2 concentration (EF-NO2) was 1.50 ± 0.43 post-monsoon and 0.95 ± 0.0.29 pre-monsoon. The measured concentration of NO2 was within the standard prescribed by the CPCB at 7.89% of the sampling sites in the post-monsoon season and at 65.79% of sites in the pre-monsoon season.
4.2. AEF of Traffic Noise and Concentrations of Air Pollutants
Average AEF was 3.35 ± 0.67 in the post-monsoon and 1.83 ± 0.37 in the pre-monsoon season, indicating that ATPL in terms of traffic noise and air pollutant concentrations was 3.35 times higher post-monsoon and 1.83 times higher pre-monsoon than the permissible limits. Similar seasonal variations in combined Noise-Air quality have been reported in Kolkata by Chowdhury et al. (31).
4.3. W/S ratio and Interseasonal Correlation Between TMV, Traffic Noise, PM2.5 and NO2 Concentrations, and AEF
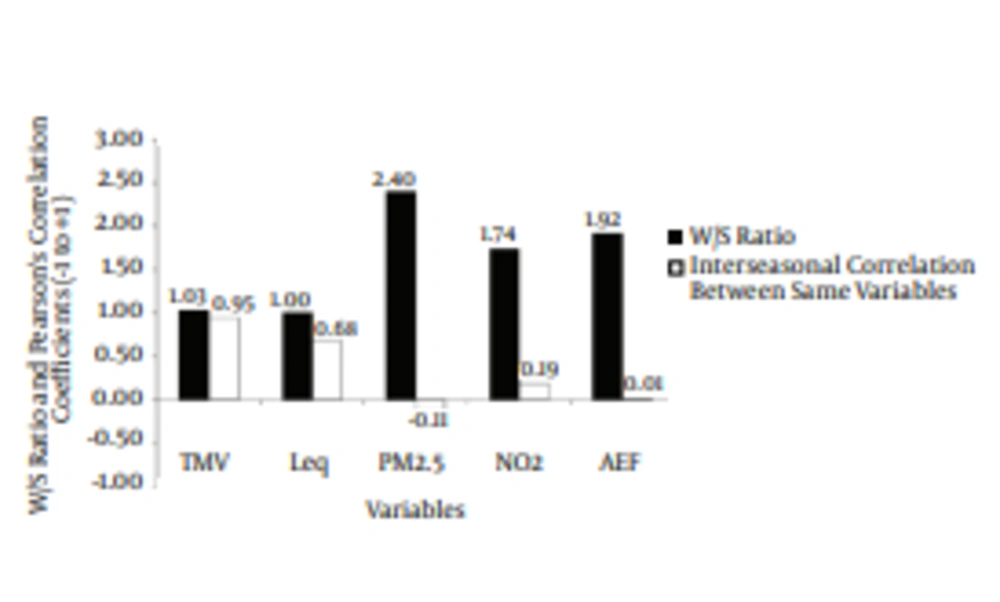
Average W/S ratios of TMV in 4 h and traffic noise (Leq) were 1.03 ± 0.11 and 1.00 ± 0.02, respectively (Figure 3). Very strong (0.95; P < 0.01) interseasonal correlation was found for TMV and strong (0.68; P < 0.01) interseasonal correlation was found for traffic noise. A W/S ratio of 1 and strong positive interseasonal correlation of a variable might be attributed to interseasonal homogeneity of the variable; that is, almost constant traffic volume and noise in both seasons. Almost constant motorized traffic noise in the presence of almost constant traffic volume in both seasons might also be attributed to the lower influence of air temperature, relative humidity, and wind speed on traffic noise within the urban microenvironment (32). Comparable post-monsoon (winter) and pre-monsoon (summer) traffic noise levels have been reported in the city of Jammu by Kaushal et al. (33). In contrast, a higher average W/S ratio of the concentrations of PM2.5 (2.40 ± 1.14) and NO2 (1.74 ± 0.76) and poor interseasonal correlation between these variables indicates interseasonal heterogeneity of air pollution levels, with a higher air pollution level in the post-monsoon season. Higher post-monsoon (winter) air pollution levels in Indian cities have been reported by a number of researchers (28, 34-36). Higher post-monsoon air pollution might be attributed to lower wind speed and lower atmospheric turbulence, resulting in reduced dispersion of air pollutants. The argument of lower wind speed is supported by a lower average W/S ratio of 0.50 ± 0.20 for wind speed; evidence for poor dispersion of air pollutants is seen in the higher standard deviation of the EFs of the air pollutants in the post-monsoon season. The average W/S ratios of air temperature and relative humidity were 0.71 ± 0.12 and 1.10 ± 0.38, respectively. The average W/S ratio of AEF implies that the ATPL of the microenvironments was 1.92 ± 0.63 times higher in the post-monsoon season, and interseasonal correlation of AEF was also found to be very weak. Therefore, ATPL also showed interseasonal heterogeneity in spite of constant traffic volume.
4.4. Seasonal Relationship of AEF With Air Temperature, Relative Humidity, and Wind Speed
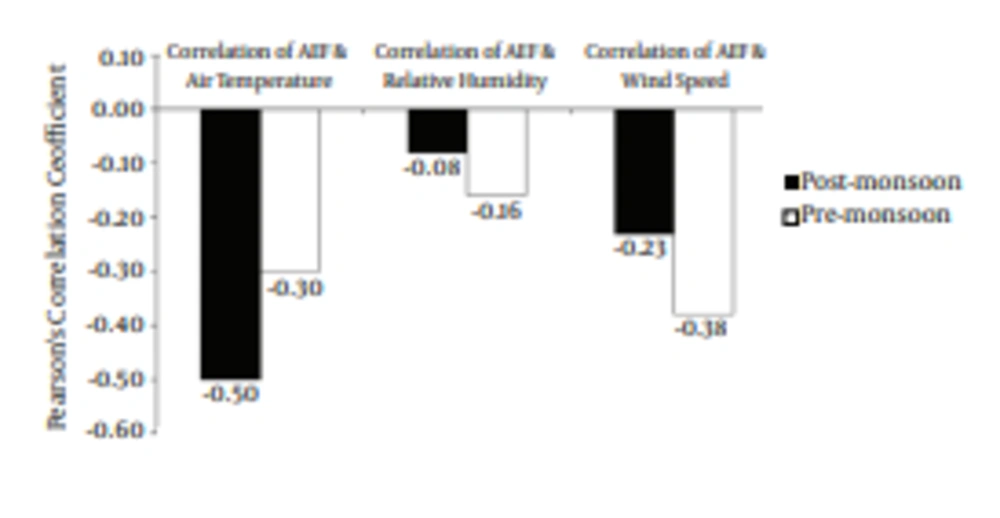
Correlation analysis between AEF for air temperature, relative humidity, and wind speed revealed that in the post-monsoon season, air temperature had a moderately negative and statistically significant (-0.50; P < 0.01) correlation with AEF (Figure 4). This might be attributed to occurrence of higher ATPL with lower atmospheric temperature. In this condition temperature inversion driven stable atmosphere in the early morning and late evening monitoring hours. In the early morning and late evening hours temperature inversion also may occur which results in a stable atmosphere that hinders the dispersion of air pollutants an increase in traffic noise level close to the road due to lower pavement temperature has been reported by Anfosso-Ledee et al. (37) and Bueno et al. (38). Correlations between AEF and relative humidity and between AEF and wind speed were statistically insignificant for the post-monsoon season.
In contrast, a moderate degree of negative and statistically significant (-0.38; P < 0.05) correlation was seen between AEF and wind speed in the pre-monsoon season, which might be attributed to lower ATPL in high-wind hours due to the mixing and dispersion of air pollutants in a higher volume of air. Wind-driven atmospheric turbulence may also scatter sound unpredictably, resulting in a reduction in traffic noise level close to the road (39). This is likely the reason that in spite of almost constant traffic volume in both seasons, lower ATPL was recorded in the pre-monsoon season. Correlations between AEF and relative humidity and between AEF and air temperature were statistically insignificant for the post-monsoon season.
5. Conclusion
Assessment of ATPL in terms of traffic noise and concentrations of PM2.5 and NO2 revealed that ATPL was on average 3.35 times higher in the post-monsoon and 1.83 times higher in the pre-monsoon season than the permissible limits prescribed by the CPCB. W/S ratio and correlation analysis revealed interseasonal homogeneity of traffic volume and traffic noise and interseasonal heterogeneity of concentrations of the air pollutants and ATPL in the city microenvironments.


