1. Background
One of the important achievements of the past decade was the rapid growth of industries and accordingly production of various chemical compounds. Along with this development and its conveniences, numerous problems such as environmental pollution, particularly air pollution emerged that gradually transformed into one of the most important human challenges and concerns (1). Today, the pollution is so huge that air, water, and soil cannot remove it by their own cleaning power. Regarding the increasing rate of natural and artificial chemicals, the hazards threatening the human health have also increased.
Nitrogen oxides (NOx) are an important class of air pollutants threatening human health in industrial environments. These components are air pollutants emitting by power plants, heating services, and transportation industries. NOx compounds emitted by combustion processes composed a large amount of nitrogen oxide and little amount of nitrogen dioxide. From environmental view, NOx cause acid rain and increase tropospheric ozone, global warming, etc. (2, 3).
Main methods of controlling the NOx are composed of selective and non-selective catalytic reduction, less excess air, recycling of combustion gasses, NOx chemical reduction, NOx oxidation, and absorption in liquids (4-6). Using the methods to prevent NOx generation is mostly applied (while combustion) by changing the limited production processes. Chemical methods of NOx reduction are sensitive to pollution and abnormal conditions. Most of the selective catalytic reduction methods have a short life because of high contamination of gas flow. Absorption methods also use absorbents that are scarce because of economic and regeneration problems (6, 7).
Today, using photocatalytic oxidation (PCO) methods for purification of polluted air has drawn considerable attention, because they can substitute most common methods like absorption, combustion, and catalytic oxidation. PCO takes advantage from semi-conductors like CdS, ZnS, ZnO and TiO2 as the photocatalyst (8). TiO2 and ZnO are the commonest semi-conductors used in photocatalytic oxidation process because of their high photocatalytic output, stability against the chemical compounds, and low cost (9). The photocatalytic oxidation process is an interesting approach for air cleaning because of its high potential in destruction of a vast range of organic and inorganic pollutants at normal pressure and temperature (10). Nitrogen dioxide (NO2) because of its chemical properties is easily absorbed in water and solutions, while nitrogen oxide (NO) does not possess such property (11). Therefore, conversion of nitrogen oxide to nitrogen dioxide (to remove it) is discussed in many studies (9, 12, 13).
2. Objectives
In this study, photocatalytic properties of zinc oxide were used for oxidation of nitrogen oxide to nitrogen dioxide. Also, absorption ability of sodium hydroxide solution was used for removal of nitrogen dioxide from polluted air flow.
3. Materials and Methods
3.1. Photocatalytic Oxidation System
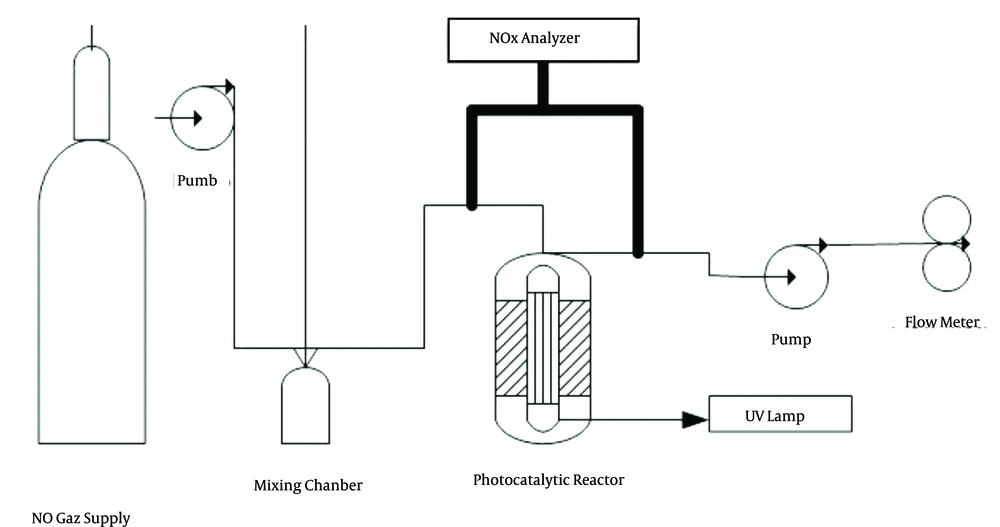
The experimental system used in this study comprised a pollutant gas source, mixing chamber, photocatalytic oxidation reactor, wet absorption system, and finally a system for measuring nitrogen oxides (Figure 1). The reactor used in this study was selected from Pyrex. It was chosen in cylindrical form so that UV light can irradiate evenly on the nanoparticles, also the pollutant gas can easily flow along the reactor without any turbulences. The zinc oxide nanoparticles with a size of 10 - 30 nm were used.
Regarding the cylindrical shape of the reactor and impossibility of fixing zinc oxide nanoparticles on the slope surface, based on the past reports, a fiberglass mesh was used to fix the nanoparticles. Two 20-volt electric motor reactors at a speed of 20 rpm horizontally rotate them. The collection was placed at 50°C. Suspensions of ZnO nanoparticles were injected into the reactor using a syringe. For better exit and avoiding saturated steam inside the reactor, a custom-made sampling pump at a flow rate of 1 L/min air into the reactor was used. After 3 hours of heating, nanoparticles on fiberglass mesh and the interior wall of the reactor were stabilized. Fiberglass was permeable to UV-light and a layer of nanoparticles was effectively stabilized on the fiberglass surface. Content of stabilized nanoparticles on the fiberglass and internal wall of the reactor was about 4 and 8 mg/cm2 (14). The polluted air was provided in a mixing chamber with the capacity of 10 liters. A fan was used for homogenization of pollutants and creation of desired concentrations. An 8 watt U-shaped UV-lamp (Philips) was located in the center of the reactor, emitting the A-type UV-ray with 315 - 400 nm of wavelength (max = 365 nm) (15). After passing the mixing chamber, polluted air entered the reactor. Reactor length and diameter were determined regarding the size of lamp. The initial concentrations of feed into the reactor were set at 100, 150, and 200 ppm.
3.2. Absorption System in Sodium Hydroxide Solution
Nitrogen oxide after passing the reactor and conversion to the NO2 entered the sodium hydroxide (NAOH) solution, including a porous bubbler filled by 1, 3, 5 wt% of NAOH solutions (150 mL). The pollutant entered the absorption system after passing the reactor. Rate of gas feed was set at 400 mL/min. Because the absorption system was located at the end of the experimental system, pressure for passing the gas from absorption system was lower than required amount and so for circulation of polluted air in whole system, a pump was placed at the end of the system for sucking air.
3.3. Survey of Reaction Kinetics
In applied research, kinetic experiments are used for the optical analysis of target compounds. Dependence of reaction rate to factors such as light intensity, concentration of reactants, concentration of oxygen, water vapor and temperature have been studied in kinetic data (16).
The Langmuir-Hinshelwood model is widely used to formulate the rate equations for the PCO reaction (8, 17, 18). For a surface-catalyzed reaction, chemisorption is the interest. The model uses Equations 1 to determine the disappearance rate (r) of the reactant (if the oxygen concentration and the relative humidity remain constant):


where κ is the reaction rate constant; K is the adsorption equilibrium constant; t is the space time (s); and -rNO is the disappearance rate of NO (mol/m3/s). Regarding the linear regression analysis, we observed the constants for any concentration.
4. Results
4.1. Properties of Stabilized Zinc Oxide Nanoparticles
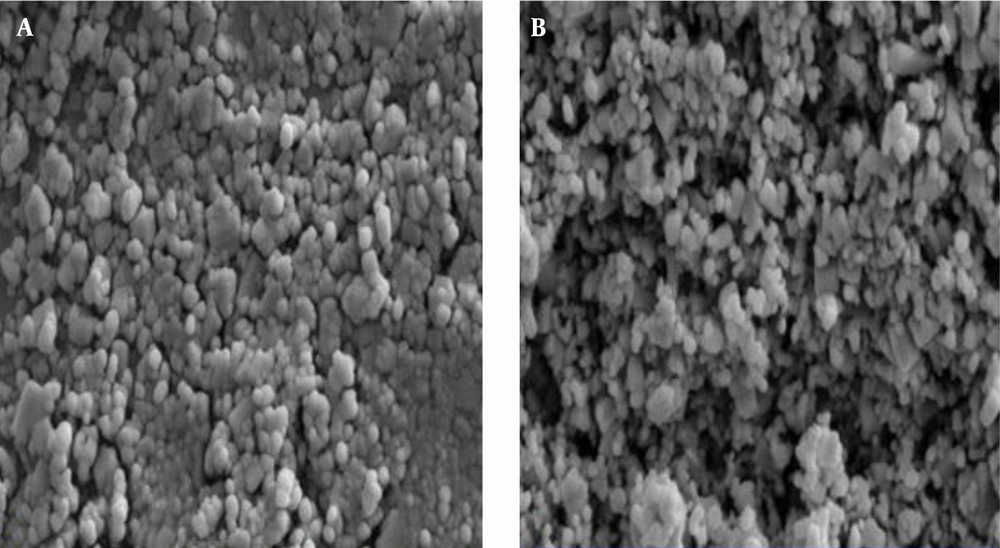
After stabilizing the nanoparticles of zinc oxide on the glass and fiberglass, SEM images were used to determine the surface topography or morphology of ZnO nanoparticles such as shape and porosity as well as its physical nature. By investigating images of the nanoparticles (magnified at 30,000), it was found that its particle nature, pores and coated surface are desirable (Figure 2). Figure 2 shows that nanoparticles are uniform and nearly spherical with a diameter of 10 - 40.
4.2. Effects of Initial Concentration of Nitrogen Oxide on Conversion Rate
After running the photocatalyst system, 3 sets of 100, 150, and 200 ppm were used to evaluate the effects of initial concentration of nitrogen oxide on conversion process. Measurement of gas concentration started in 30 minutes intervals since the start of gas flow. Reactor efficiency formula in conversion of nitrogen oxide is shown below (19):

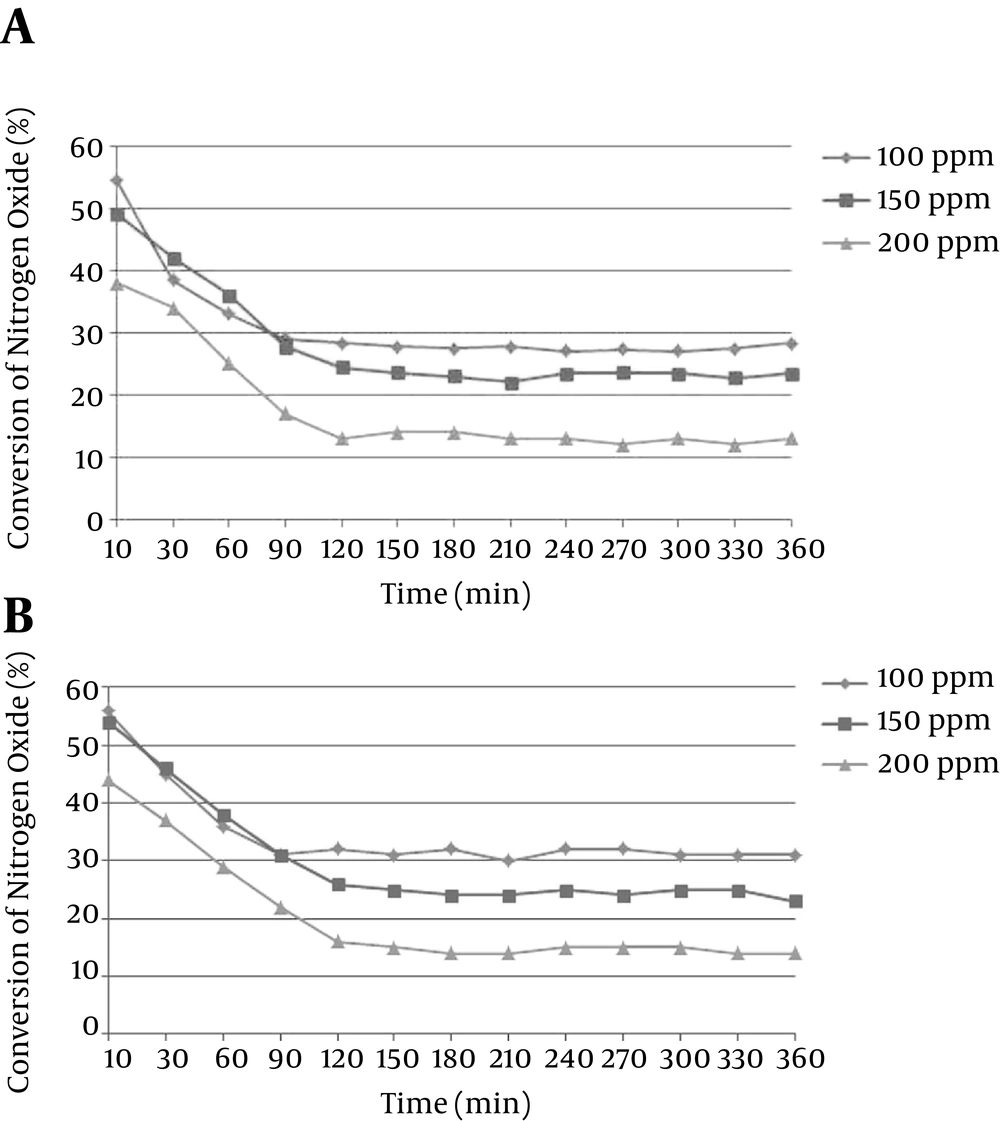
Conversion rate is based on the 2 variable functions of initial nitrogen oxide (NO) concentration and amount of nanoparticles stabilized on the internal wall. Data of NO conversion based on the concentration are presented in 2 distinct graphs for 4 and 8 mg/cm2. When the amount of stabilized nanoparticles was 4 mg/cm2, 5 minutes after the start of the flow, the conversion rate or reduction of nitrogen oxide at 100, 150, and 200 ppm, calculated by Equation 1, were about 55%, 49%, and 38%, respectively. At the start of PCO, a high conversion rate was observed which was reduced after some hours and reached a stable state. It is assumed that initial high conversion rate was caused by high rate of absorption in the presence of PCO. The highest output of NO reduction was about 55% at the initial step for concentration of 100 ppm. After that, a stable range was achieved which lasted 95 minutes for concentration of 100 ppm, 110 minutes for concentration of 150 ppm, and 115 minutes for concentration of 200 ppm. The average stable range from 90 minutes until the end of experiment was about 28% for 100 ppm initial concentration, 23% for 150 ppm initial concentration, and 13% for 200 ppm initial concentration (Figure 3A).
When the content of stabilized nanoparticles was about 8 mg/cm2 of conversion rate (Figure 3B), for the 100 ppm initial concentration, amount of NO reduction was at first about 56% of conversion which turned to 32% after about 90 minutes. Then, it became stable until the end of reaction. For the 150 ppm initial concentration, amount of NO reduction was at first about 54% of conversion which turned to 26% after 120 minutes. Then, it became stable until the end of reaction. For the 200 ppm initial concentration, amount of NO reduction was at first 44% of conversion which turned to 15% after about 125 minutes. Then, it became stable until the end of reaction.
4.3. Effect of Sodium Hydroxide Concentration on the Removal of NO2
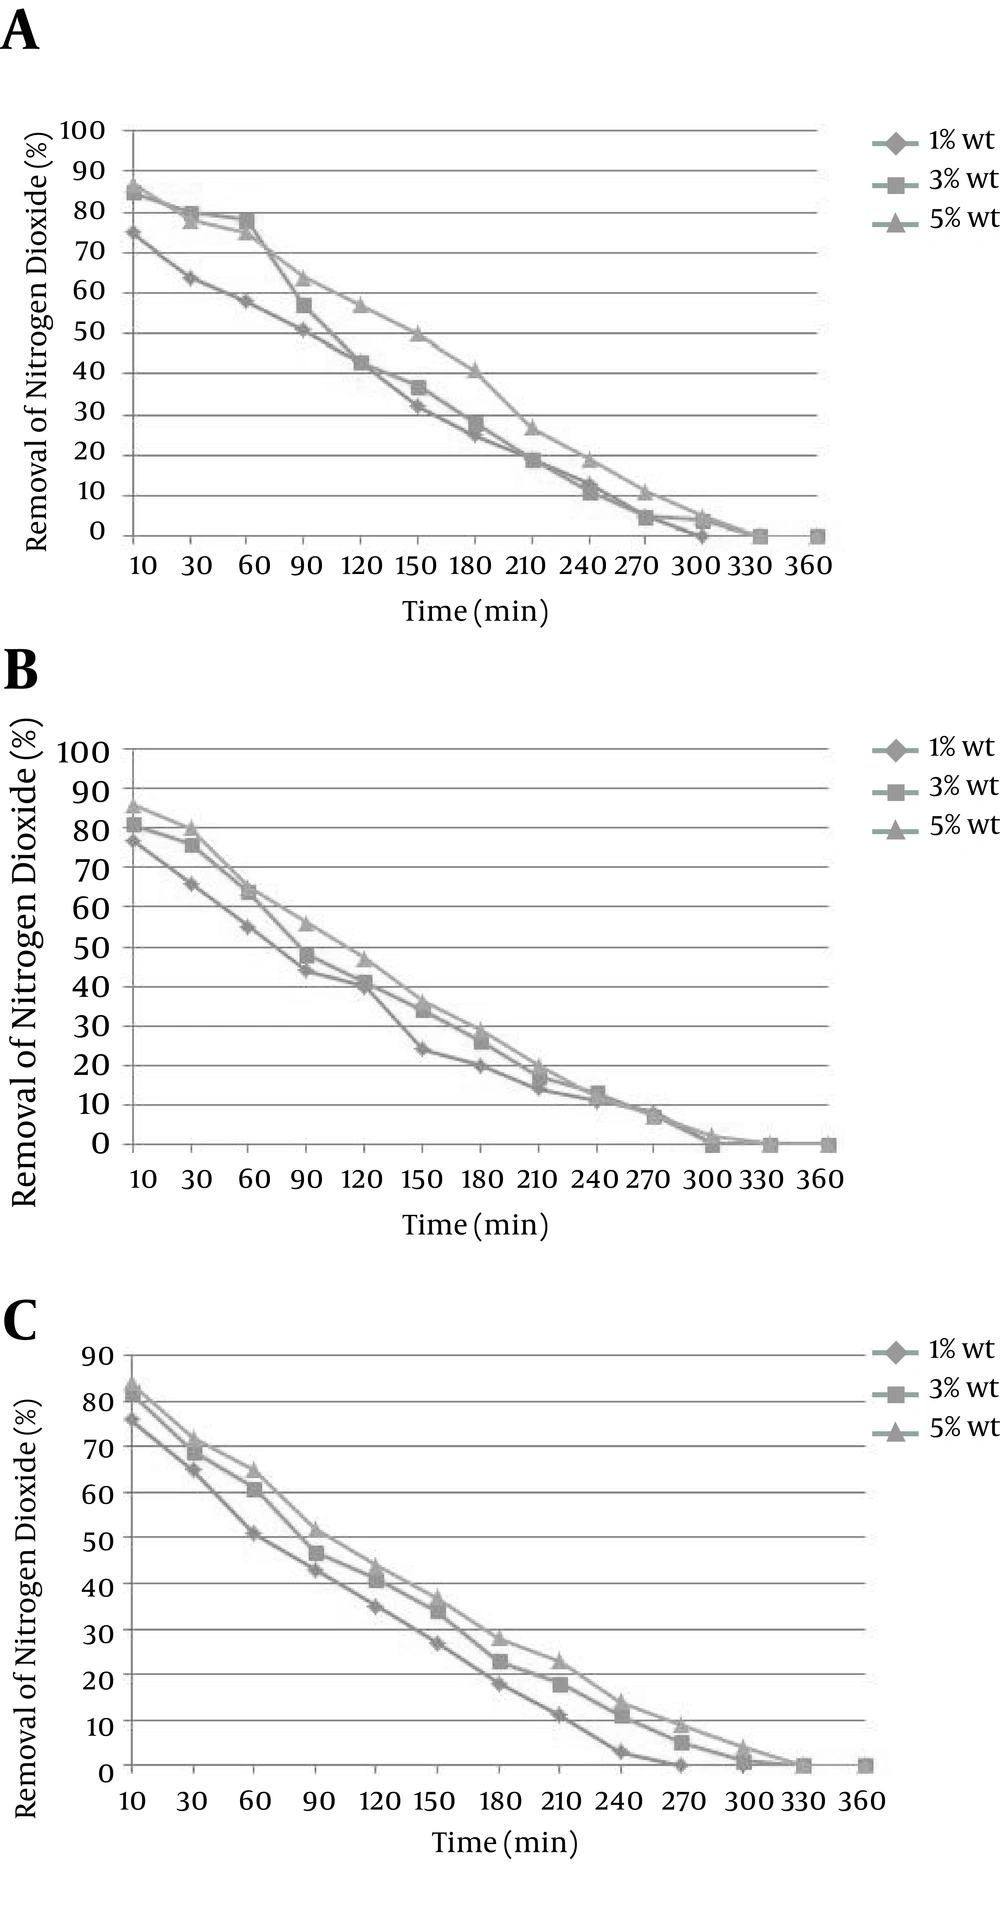
In this section, content of NO2 gas generated by photocatalytic oxidation of nitrogen in the absorption system is defined. In fact, the main purpose of the combined system of conversion of NO to NO2 is to improve the absorption efficiency. Figure 4A shows the data resulted by absorption of NO2, when the initial concentration of NO is about 100 ppm. The initial absorption with 5% concentration of sodium hydroxide was 87%, reaching 50% after 150 minutes and became 0 after 330 minutes. The initial absorption with 3% concentration of sodium hydroxide was 85%, reaching 37% after 150 minutes and became 0 after 330 minutes. The initial absorption with 1% concentration of sodium hydroxide was 75%, reaching 32% after 150 minutes and became 0 after 300 minutes.
At concentration of 150 ppm NO flow, absorption content in the NAOH solution with concentrations of 1, 3, 5 wt% are shown in Figure 4B. The initial absorption with the 5% concentration of NAOH was 86%, reaching 36% after 150 minutes and became 0 after 330 minutes. The initial absorption with 3% concentration of NAOH was 81%, reaching 34% after 150 minutes and became 0 after 330 minutes. The initial absorption with 1% concentration of NAOH was about 77%, reaching 24% after 150 minutes, and became 0 after 300 minutes.
At concentration of 200 ppm NO flow, absorption content in the NAOH solution is shown in Figure 4C. The initial absorption with 5% concentration of NAOH was about 84%, reaching 37% after 150 minutes and became zero after 330 minutes. The initial absorption while the concentration of sodium hydroxide was about 1, 3% was 84, 76%, respectively reaching the 34, 27% after 150 minutes and became 0 after 300 minutes for 3% and 270 minutes for 1%.
4.4. Kinetics of Photocatalytic Reaction
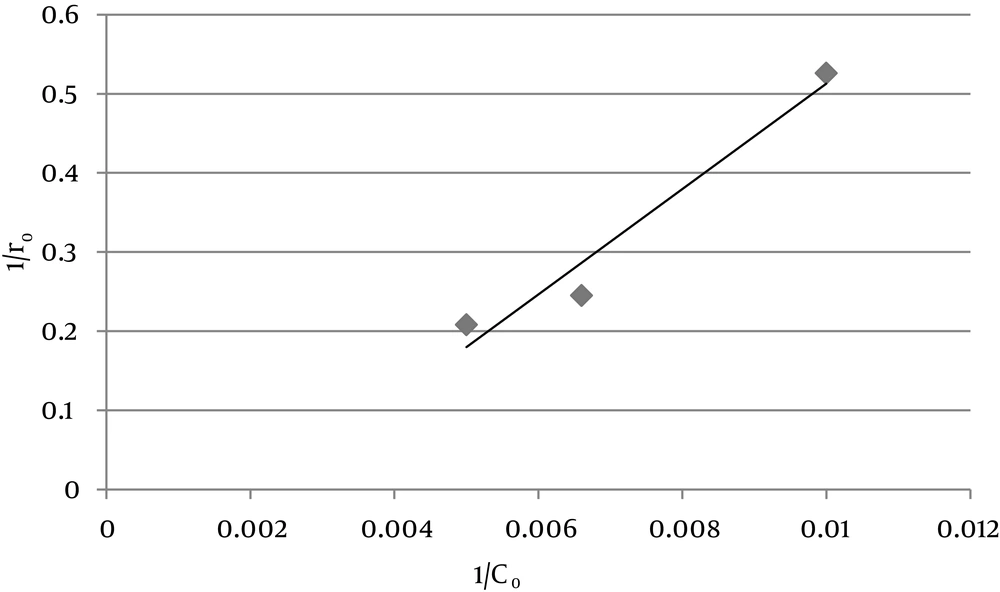
According to the linear form of Hinshelwood-Langmuir isotherm, the required variables for obtaining isotherms are Kobs and ro. According to Equations 3 the slope of diagram -Ln(C/Co) to t at different initial concentrations [Co] is Kobs, and ro is the result of the Co × Kobs. Table 1 shows the amount of Kobs and ro in different initial concentrations of NO using ZO2 nanoparticles. H-L isotherm of NO is generated by plotting the diagram of 1/ro to 1/Co for photocatalytic oxidation process (Figure 5).
| Co, ppm | 1/Co, ppm-1 | 1/ro, ppm-1, min | ro, ppm (min-1) | Kobs, min-1 |
|---|---|---|---|---|
| 100 | 0.01 | 0.526 | 1.9 | 0.019 |
| 150 | 0.0066 | 0.245 | 4.08 | 0.027 |
| 200 | 0.005 | 0.208 | 4.8 | 0.024 |
5. Discussion
5.1. Effect of Nanoparticles Concentration and Content on Conversion of NO to NO2
In this study, 2 variables of NO initial concentration and content of stabilized nanoparticles were investigated. As a result, the average rates of conversions for NO concentrations of 100, 150, and 200 ppm were 28%, 23%, and 13%; while the content of stabilized nanoparticles on the glass was about 4 mg/cm2. In the constant state, using the similar content of nanoparticles, lower initial concentration led to more conversion of NO to NO2. Regarding the constant surface of nanoparticles and active sites for oxidation, higher initial concentration led to higher NO outlet, without changing the reactor system. In the beginning of flow, because of chemisorption phenomenon, higher amount of conversion was observed (9, 20, 21).
Chemisorption is a kind of absorption happened between material surface and reactants (22). Regarding the conversion of NO at different amounts of stabilized nanoparticles (4 and 8 mg/cm2) and in different NO concentrations, it is less than 5% in different conditions. Devahasdin et al. reported the optimum content of titanium dioxide nanoparticles as 1 mg/cm2 for photocatalytic oxidation of NO. They also mentioned that in higher concentrations, no more conversion was observed (8). Wang et al. also investigated the NO conversion in different concentrations and reported that in the concentrations of 20 - 147 ppm, conversion was varied between 27% and 85% (9). Katsanaki et al. as regards the removal of NOx by photocatalytic oxidation using titanium dioxide nanoparticles with fluorine and nitrogen was found that the maximum NO removal rate is 24.2% (23). One of the important characteristics of photocatalysts is the thickness of stabilized layer of nanoparticles on the substrate. If the thickness was enough, most of the electrons and holes are created at the proper depth of the layer and do not reach the surface in short half-life time. If the layer is too thin, just a small part of light is adsorbed which can lead to lower output of photocatalytic process. Diffusion depth of UV-ray in zinc oxide is lower than titanium oxide, therefore by increasing the stabilized zinc oxide layer, as shown in the results, no sensible change in the output was observed (because the light cannot diffuse it). Luo et al. by measurement of diffusion depth of UV-ray with 365 nm of wavelength in stabilized zinc oxide layers could show that diffusion depth of UV-A ray was about 40 nm (24).
In this study, depth of each stabilized layer of zinc oxide was more than 40 nm (sometimes reaching 5 µm). So, lower performance of NO photocatalytic oxidation by increasing the stabilized zinc oxide layers is due to the non-diffusivity of UV-light and accordingly more deactivation of photocatalysts (9, 19).
5.2. Effect of Initial Concentration and Sodium Hydroxide Solution on Absorption of Nitrogen Oxide
Using the basic adsorbents for removal of nitrogen oxides is an effective approach (25). Nitrogen oxide and dioxide are 2 main components of such oxides. NO2 can be effectively collected by water and basic solutions. Unlike NO, NO2 is weakly adsorbed in water and other solutions. Regarding the fact that it is the dominant form is NOx, its removing is essential (6).
One of the main methods of NOx removal is its conversion to NO2 and using the oxidants in the solutions. In this way, Chu et al. used KMnO4 in basic NaOH solution while Hsin et al. used NaClO2 for removal of NO and its conversion to NO2 (26, 27). Defects of these approaches were already described as after conversion of NO to NO2, there is not enough time for absorption of NO2 in the solution. On the other hand, proper amount of NO2 can be useful for the absorption of NO. If amount of NO in the mixture of NO and NO2 is equal or less than NO2, the absorption equation in contact with NaOH solution will be as follows (6):

When the amount of NO2 is very high, the equation reacts as shown below:

When the amount of NO is less than NO2, just equal amounts of it react with NaOH solution and the excess amount will stay out of the reaction. In this study, a porous bubbler was used for the absorption of NO2 in the solution. However, some researchers have suggested using scrubber or packed column for simulation and determination of maximum absorption (28-30). The initial amount of absorption was high, because the measuring time started 7 minutes after the start of the system. So regarding the fact that addition of stabilized nanoparticles does not affect photocatalytic oxidation, the amount of nitrogen oxide absorption is based on its initial concentration and also NaOH concentration in the absorption system. The maximum amount of absorption was obtained at initial concentration of 100 ppm. In reality, at this concentration of NO, maximum conversion is obtained when NO is high and NO2 is low. By increasing the initial concentration of NO, besides decreasing the conversion of NO to NO2, the amount of nitrogen oxides entering the absorption system would also increase which reduce the absorption in NaOH solution. By continuing the entrance of nitrogen oxides into the absorption system, the absorption would decrease which is due to saturation of NaOH solution with nitrate and nitrite groups (6). In 2008, Zhongbiao et al. designed a 2-step system for removal of nitrogen oxides and absorption in Na2SO3 solution. They claimed that photocatalytic oxidation was an effective approach for removal of nitrogen oxides. Deshwal et al. study aimed at removing NO from the gas stream using chlorine dioxide solution. They removed 60% of the NOx in the pH range of 11 - 3 under optimum conditions (31). In this study, they reported that conversion of NO to NO2, besides production of a more soluble product with respect to the pollutants, generates the NO2 toxic gas in the case of saturation which is more dangerous than the initial nitrogen oxide product (19, 32).
5.3. Mechanism of Photocatalytic Oxidation of NO
NO photocatalytic oxidation generates main components of NO2, HNO3, and HNO2 on the photocatalyst surface. When the UV-ray lamp is turned on, OH radicals and NO interact for generation of HNO2. At this point, the adsorbed HNO2 can be decomposed to H+ and NO2-. This initial step takes about 0.5 - 3 minutes, depending on the fixing of the zinc oxide nanoparticles. Then, HNO2 reacts with OH radicals to form NO2 and water (8, 18) (Equations 6-9)


In the first step, HNO2 is generated fast without any amount of NO2. In the transient step, photocatalytic oxidation of HNO2 to NO2 and oxidation of NO2 to HNO3 would also occur. The stable HNO3 and its decomposed ions are dominant in the next transient step (8).
Removal of nitrogen oxides as one of the important pollutants of the air flow is studied in this paper. In this method, conversion of NO by zinc oxide nanoparticles stabilized on the glass as the photocatalyst and also investigation of photocatalytic oxidation products in an absorption system was studied. Furthermore, since the nanoparticles response occurred at wavelengths less than 380 nm, which is located at UV-ray area, UV-A ray was applied in this research. Absorption of UV-ray excites the valance band electrons toward the conduction band. So, the electron-hole pair with the high oxidative potential of 3.2 eV will be resulted from formed holes by emissions. This process starts the oxidation reactions with absorption spices. Photocatalytic oxidation is a useful and effective method for the removal of nitrogen oxides from polluted air. In reality, conversion of NO to NO2 is the first step for removal of NO and its application in experimental condition is one of its considerable characteristics. In this study, application of NaOH solution as the adsorbent of nitrogen oxides has shown its capability. Also, by using zinc oxide as a usual photocatalyst, it is possible to reach the 100% of output at 55% of conversion. However by continuing the experiment, conversion amount decreased due to the saturation of active sites. By increasing the surface area of stabilized nanoparticles, it is possible to keep the conversion rate at the optimum level. Absorption amount of NO regarding the existence of NO2 as a facilitator agent and using the porous bubbler as the absorption system reached 77% at the start of the reaction, and then reduced 30% after about 120 minutes.
