1. Background
Lead is one of the most prevalent heavy metal pollutants in urban soil that is of considerable interest to researchers. It is strongly affected by human activity; lead in soil may originate from atmospheric lead from industrial pollution and use of tetraethyl lead as a gasoline additive (1). At high concentrations, it becomes a toxic element to humans and most other forms of life. For this reason, there is a need to be concerned with elevated levels of lead in the environment and monitor the content of lead in various ecosystems particularly in urban ecosystems (2). Lead in urban soils comes from several sources. In industrial areas, atmospheric deposition of Pb emitted from the smelter is the main source of Pb accumulation in the surrounding soil (3). Along the highways, Pb is primarily caused by exhaust emissions (4). In residential areas, lead-based paints used to paint houses are the main source of contamination (5). Urban studies have proved lead concentrations to be the highest along the perimeter of building foundations and within a few feet of busy streets. Although lead in gas and lead-based paint is now banned, lead has the capability to persist in soil and water for a long time (6). Therefore, there is major concern about lead exposure from urban soils. Lead as a potent occupational toxin has been known as a major public health risk (7) owing to its well-established effects on neurobehavioral development in children (8). Lead poisoning is often insidious and asymptomatic with potential irreversible adverse effects. It can greatly affect the function of certain body systems and poisoning by lead primarily affects the hematopoietic, central nervous, hepatic and renal system leading to serious disorders. Several studies on lead contamination in urban soils have been conducted in several cities (5, 8-14). Hence, it is important to apprehend the spatial distribution and concentration of lead in urban soils. Our knowledge about spatial distribution of soil pollutants particularly metals is essential for delineating contaminated areas.
2. Objectives
The main purpose of this research was to evaluate lead concentration in urban soils in Khorramabad city (western Iran). Also other goals were to analyze the spatial distribution contour map and risk assessment constructed from environmental Pb concentrations collected from Khorramabad city.
3. Materials and Methods
3.1. Study Area Description
This study was conducted in Khorramabad city, capital city of Lorestan province, situated in western Iran. This city is geographically situated in the Zagros mountain ranges. This city is located between 250,500 to 257,000 meters eastern longitude and 3,714,000 to 3,713,000 meters northern latitude in universal transverse mercator (UTM). Khorramabad has an area of approximately 25.263 km2 and a population of 328,544 inhabitants (according to the 2006 census). The city of Khorramabad is situated at an altitude of 1171 meters above mean sea level. Khorramabad city has cold semi-arid climate with an annual average temperature and rainfall of 17.2°C and 512.7 mm, respectively.
3.2. Sampling and Analysis
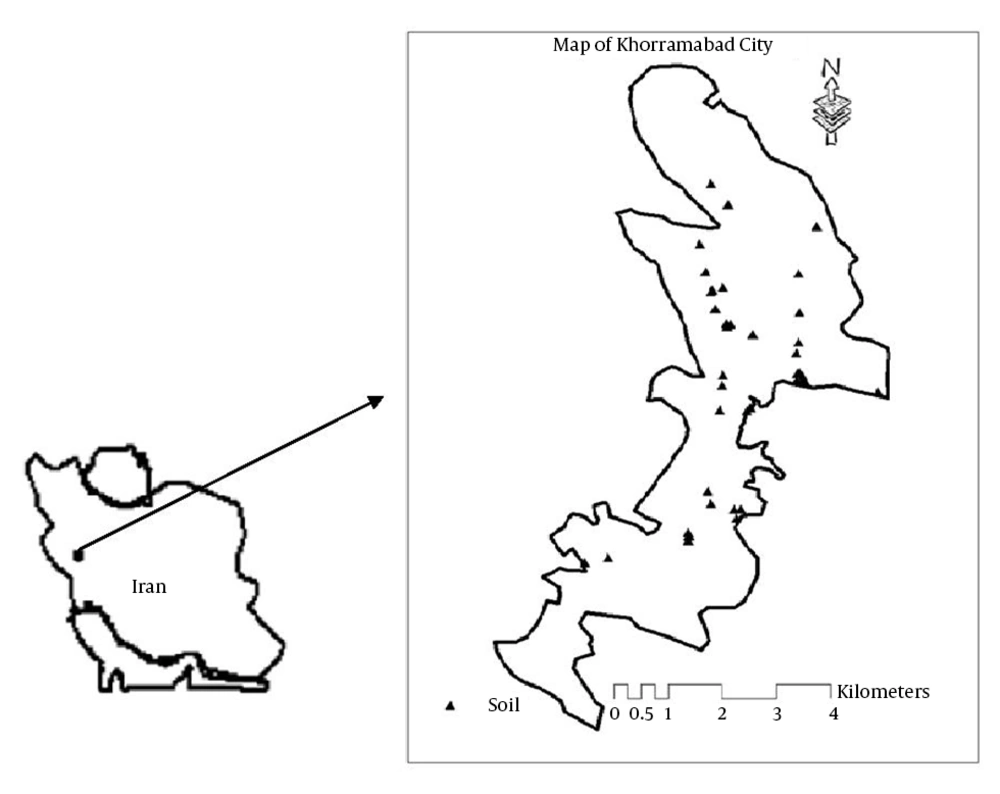
In the present research, the sampling area was the urban area of Khorramabad, which has an area of 25 km2. The soil sampling was done in twenty-five urban parks of Khorramabad (Table 1). The sampled parks were selected to evenly cover the entire city. According to park area, in each park, two to three soil samples were collected. Sampling was carried out during May 2013 at depth of 0 - 20 cm. The locations of the parks and study area are shown on the map in Figure 1. Each soil sample consisted of five sub-samples that were collected in the park in order to have representative samples of the entire park. A total of 40 composite soil samples were collected. All the soil samples were stored in polyethylene Ziploc bags for transport and storage. A total of 40 soil samples were sent to the laboratory for determination of lead concentrations. The sampling points (longitudes and latitudes) of each sample were recorded by a GPS instrument. In the laboratory, soil samples were air-dried, ground, and passed through a sieve of 149 microns for lead and 200 microns for pH and EC. The prepared soil samples were digested using a mixed solution of the concentrated acids of HNO3 (Merck, 65%) and HCL (Merck, 37%) by volume and heated for a couple of minutes and then the digested contents were filtered through a no. 42 Whatman filter paper into 25 mL volumetric flasks. The concentrations of Pb in the digestion solution were analyzed with a flame atomic absorption spectrometer (PerkinElmer AAS 8020). The LOD of Pb was 0.03 mg/kg. For quality control, blanks, triplicate and spike samples were analyzed during the procedure. Accuracy was expressed as the percentage recovery of soil spiked samples. The obtained recovery was 96.5%.
| Name of Parks | Number of Samples |
|---|---|
| Mehrvarzan | 3 |
| Zayton | 3 |
| Eram | 1 |
| Golshan | 1 |
| Parcham | 1 |
| GoldashtGharbi | 1 |
| Shahed | 1 |
| Zybakenar | 4 |
| Kio | 1 |
| Sakhrehi | 2 |
| Shahr | 1 |
| Naserkhosro | 1 |
| Golsorkh | 1 |
| Motahari | 1 |
| Moalem | 3 |
| Nastaran | 3 |
| Danshjo | 3 |
| Shariati | 2 |
| Asadabadi | 1 |
| Andisheh | 1 |
| Parastar | 1 |
| Shaghayegh | 1 |
| Laleh | 1 |
| Azadegan | 1 |
3.3. Contamination Factor (CF)
The assessment of contamination factor of metals is an important aspect that shows contamination degree of soil (15). The contamination factor is calculated using the following relationship as proposed by Hakanson (16): Cf = C0 - Cn.
Where C0 is the average concentrations of metal in the sampling site and Cn is the pre-industrial concentration of metal (17). Modification factor as used by Loska et al. (18) and Solgi and Parmah (17) were used in the present research that they used the concentration of metals in the earth’s crust as a reference value. The Contamination Factor (CF) classifications were interpreted as suggested by Hakanson (16): CF < 1, indicates low, 1 < CF < 3, moderate, 3 < CF < 6, considerable and CF > 6, very high contamination.
3.4. Data Analysis with Computer Software
Basic statistics of the raw data were analysed with microsoft excel and SPSS 20.0 package. Data distribution was examined for normality using the Shapiro-Wilk test, geostatistical analysis, semivariogram model fitting and spatial distribution using ordinary kriging with the GIS software ArcGIS V.9.2 (ESRI Co, Redlands, USA). The spatial variability of lead pollution in urban park soils of Khorramabad city was mapped using a geoestatistical approach, which operates within a geographic information systems (GIS). A geostatistical technique measures the spatial variability of a regionalized variable and provides spatial interpolation of kriging (19). Appropriate interpolation models were selected to perform optimal and unbiased spatial interpolation on the concentrations of the lead using the geostatistical analyst modules of ArcGIS 9.3.
4. Results
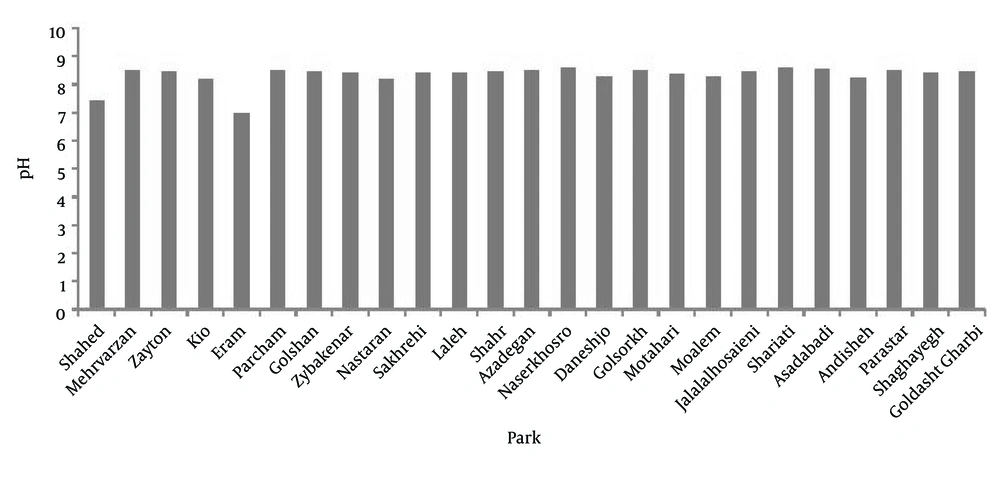
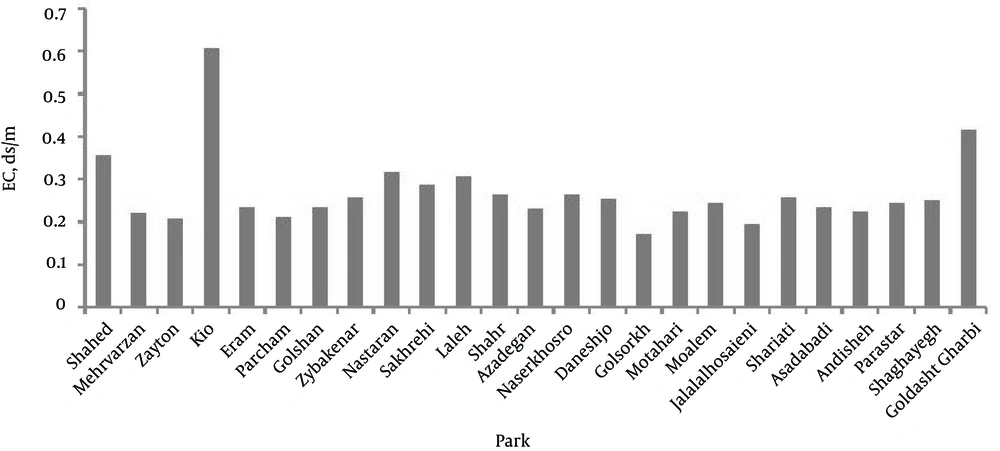
The statistical results of lead, EC and pH values are summarized in Table 2. Soil pH values varied from 6.97 to 8.68 in urban soil samples indicating that urban soils were nearly neutral to slightly alkaline. Also graphs of the pH and EC in the soil of twenty-five urban parks are presented in Figures 2 and 3, respectively.
| Minimum | Maximum | Mean | Std. Error | Std. Deviation | Skewness | Kurtosis | Cn | |
|---|---|---|---|---|---|---|---|---|
| Pb (mg/kg) | 0.05 | 35 | 7.38 | 1.25 | 7.94 | 1.81 | 3.55 | 12.5 |
| pH | 6.97 | 8.68 | 8.34 | 0.05 | 0.33 | -2.465 | 7.04 | |
| EC (dS/m) | 0.17 | 0.60 | 0.26 | 0.01 | 0.07 | 2.89 | 11.23 |
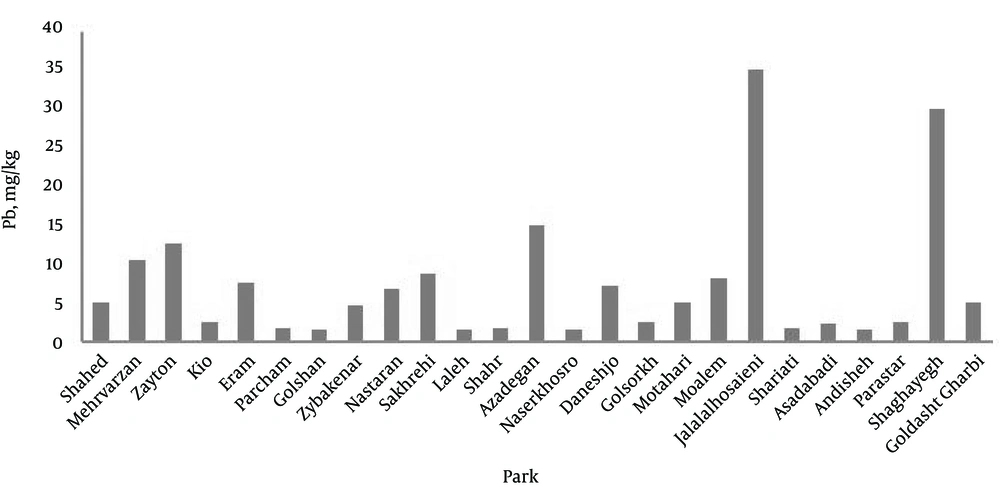
Figure 4 presents the concentrations of Pb in the soils sampled in different urban parks of the Khorramabad city. The results presented in Figure 4 indicate that Jalal-Al-Hosaini park exhibited the highest concentrations of Pb while the lowest concentrations occurred in Nastaran park.
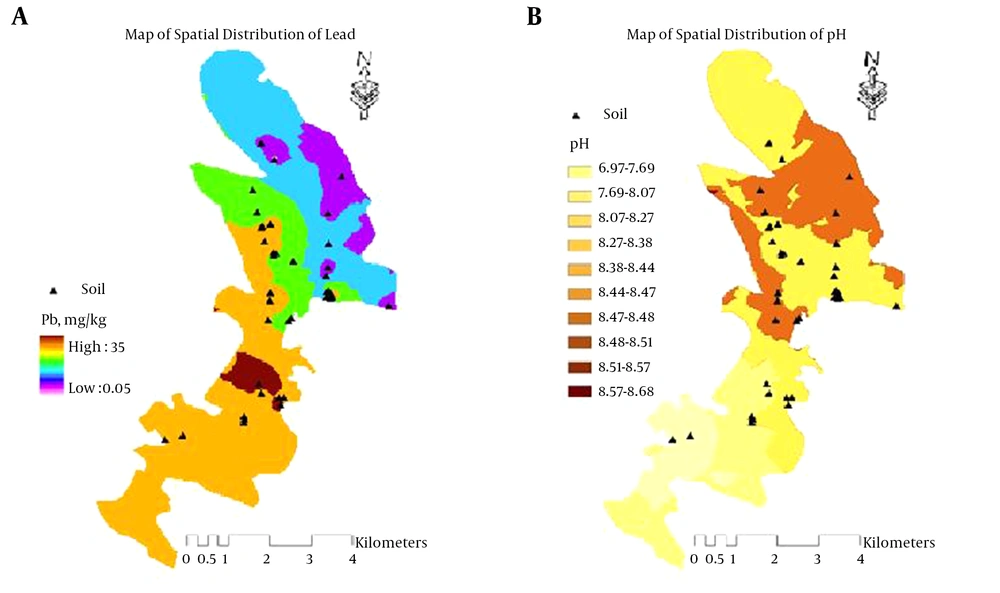
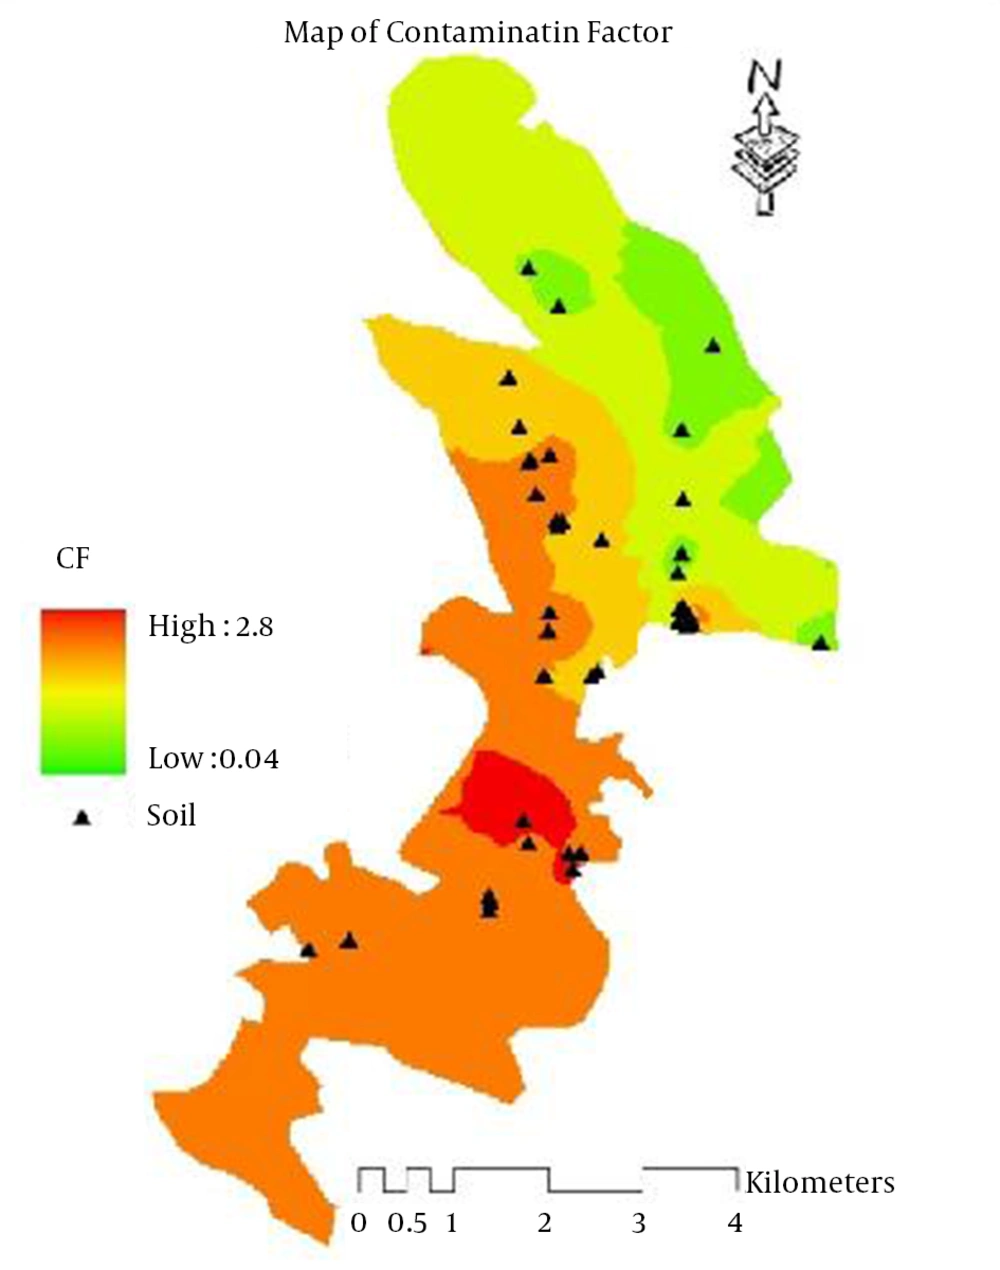
The spatial distributions maps of Pb, pH and CF are shown in Figures 5 and 6. Soils of the Eram sampling area exhibited the lowest pH values (mean of 6.97), while the highest pH values (mean of 8.68) were from Zibakenar. The spatial distribution of pH in most study areas was homogeneous, showing coefficients of variation up to 4%. Concentrations of lead oscillate all over the city. As shown in Figure 5A, Pb concentrations increase from the north to the south. The assessment of soil contamination was carried out using the contamination factor, based on classification categories recognized by Hakanson (16) that are given in Figure 6. In this research, the contamination factor is presented in format of map by kriging method (Figure 6).
5. Discussion
The differences of pH values can be explained by the high content of carbonate, ash, or cinders of anthropogenic activity in the region, which can increase the pH value of urban soils (20-22). Table 2 shows a wide range of lead concentrations (0.05 - 35 mg/kg) in the urban soils similar to the findings of Milenkovic et al. (23) in the urban soil of central Serbia. This range is probably related to differences in various pollution sources of sampling parks.
Table 3 provides a summary of different studies on lead contamination in different countries (24-44). In general, lead concentration levels in the soils studied in the current research are very low and largely different as compared to other studies around the world (Table 3). Mean concentration of lead (7.38 mg/kg) recorded in the current research was within the range recorded in Damascus (Syria) and Galicia (Spain). Obtained concentrations of Pb in Khorramabad was less than reported in Changchun, Shenzhen, Chengdu, Nanjing, Taiyuan Avellino (Italy), Beijing Ibadan (Nigeria) Galway, Madrid, Hangzhou and Bangkok (Thailand). This variation in levels of metals such as lead in the different cities around the world reflects the effect of different factors, for example type of a parent material, traffic density, microclimatic condition, and nature of anthropogenic inputs (45).
| City | Pb (mg/kg) | Reference |
|---|---|---|
| Changchun | 35.4 | (24) |
| Shenzhen | 38.9 | (25) |
| Chengdu | 50.8 | (26) |
| Nanjing | 107.3 | (27) |
| Taiyuan | 27.11 | (28) |
| Avellino, Italy | 87 | (29) |
| Beijing | 66.2 | (30) |
| Ibadan, Nigeria | 95.1 | (31) |
| Galway | 58 | (32) |
| Madrid | 22 | (33) |
| Hangzhou | 46.15 | (34) |
| Bangkok, Thailand | 47.8 | (35) |
| Damascus, Syria | 10 | (36) |
| Galicia, Spain | 11.7 | (37) |
| Murcia, Spain | 21.90 | (38) |
| Turku, Finland | 20 | (39) |
| Liaoning, China | 45.1 | (40) |
| Karachi, Pakistan | 56.23 | (41) |
| Klang district, Malaysia | 52.73 | (42) |
| Birjand | 46.59 | (43) |
| Zahedan | 10.7a | (44) |
| Khorramabad | 7.38 | This study |
aStreet dust samples.
Mao et al. (11) found lower levels of Pb in parks and road greenbelts in comparison to other sampled areas, which can be related to soil restoration (11). Although Khorramabad is one of the oldest and largest cities of Lorestan province, but had low concentrations of lead, which is probably due to their geology and/or lack of industrial activities in the study area.
Jalal-Al-Hosaini urban park located in the center of the Khorramabad City had the highest lead concentration, which can be associated with higher traffic in this area. Although Golshorkh and Shahr Park are located in the neighborhood of Jalal-Al-Hosaini, yet levels of lead are far less because there is no traffic route around these urban parks. These results show that emissions from traffic are the main sources of soil lead in Khorramabad, which is in agreement with the results reported by Wei and Yang (46). Also Madrid et al. (47) confirmed this in their research on metal in urban park soils of Seville, where they found that traffic is one of the main sources of metals such as Pb. Shaghayegh park had the second highest concentration of Pb that can be derived from produced wastes and residues from homes and buildings surrounding this park. In addition the lowest concentration of lead was measured in newly built urban parks and those that were located far from the city center. Chen et al. (30) concluded that the age and location of the urban parks is an important factor in the accumulation of metals (particularly for Pb) in the urban park soils. The older parks are more famous and attract a large number of tourists and visitors, which consequently lead to a greater amount of traffic.
Elevated Pb concentrations were found in the center of the city, which has a long history and higher traffic volumes. Many studies have shown highest lead concentrations in the center of urban areas as a result of traffic density and age of the urban area (48-50). The concentrations of Pb in other parts of the city were relatively low. Low soil lead concentrations were mainly distributed in two areas within the city: one was the eastern part of the city and the other was the northern part of the city (Figure 5A). This suggests that the low lead accumulations probably could be related to lower anthropogenic influence because of their history and location. Another possibility was that the increase of unleaded fuel utilization was followed by a rapid decline of Pb levels in the atmosphere.
The CFs for lead in different urban park soils ranged from 0.004 to 2.58 that falls in to two classes: CF < 1, indicates low contamination and 1 < CF < 3, moderate contamination. Consequently, soils from urban parks are considered to be of low to moderate pollution. Based on the map, the highest CF was found in center and south and least in the north. The moderate values of CF >1 can be due to the influence of urban activities such as traffic and disposal of waste containing lead.
In the current study, urban soil samples collected from twenty-five urban parks of the Khorramabad city were analyzed for Pb using atomic absorption spectroscopy (AAS). The concentrations of Pb in urban soil ranged from 0.05 to 35 mg/kg, with mean value of 7.38. The concentrations of lead were compared with other cities and with the earth crust value. These results showed that urban soils in Khorramabad city have lower lead concentrations as a whole. The measured CF levels showed low to moderate contamination of urban soil in the Metropolis by lead. Also this study evaluated the spatial distribution of Pb in soils of Khorramabad city. The obtained results showed that emissions from traffic are the main sources of soil lead in Khorramabad. Also concentration of lead was relatively low in soils of newly constructed urban parks.
