1. Background
Air pollution is an important issue and public concern throughout the world. It is responsible for many adverse health effects on human health and the environment (1, 2). Sulfur dioxide is one of the pollutants that come from combustion of fuels containing sulfur (such as oil, coal, gas and petroleum), refineries and vehicle emissions (3). This pollutant is a severe irritant and reactive gas, which can be absorbed through nose and lower respiratory tract at inhalation exposure (4). Sulfur dioxide causes inflammation, constriction and creates mucus by reducing the diameter of airways (3). At various concentrations of SO2, pollutant has effects on different systems and organs and exposure can lead to a wide range of side effects from bronchospasm to coughing, eye irritation, edema and vascular changes (4, 5).
Sulfur dioxide and particulate matters (PM) are pollutants co-existing in coal-smoke air pollution that account for the main portion of the pollutant burden in many cities of the world (5-7). They can affect the respiratory system because of their synergistic impacts (8). Emission of sulfur dioxide can contribute to the acidification of surface water, crops, forests and ecosystem that can be considered as a cause of deforestation (9). Some epidemiological studies reported that exposure to elevated air pollutants such sulfur dioxide can contribute to an increase in mortality due to respiratory and cardiovascular causes (10, 11) and daily hospital admissions due to chronic obstructive pulmonary disease (COPD) (12, 13), asthma (14) and respiratory disease (15, 16) in short and long term exposure to ambient air pollution. A multi-center study on air pollution and mortality in Spain by Ballester claimed that SO2 concentrations higher than daily average were related to mortality (17). An Italian meta-analysis of short-term effects of air pollution reported that an increase of 2.8% in cardiovascular diseases was observed due to an increase in sulfur dioxide pollutant levels of 10 μg/m3 of daily average (18).
In addition, according to a time-stratified case-crossover study conducted by Lin et al. in Hong Kong, SO2 pollutant had a significant association with increasing acute myocardial infarction (AMI) mortality (19). According to the findings of a study conducted in Shiraz, air quality exceeded standards in 85 days and in another study by Gharechahi et al., significant relationship between sulfur dioxide pollutant and hospitalizations due to respiratory diseases in elderly group and COPD (P < 0.001) (20, 21) was indicated. In many cases sulfur compounds are the main causes of damage to materials (22). Although SO2 and other sulfur oxides have been studied, many questions about their impacts on human health have remained unclear.
2. Objectives
Our study aimed to estimate excess hospitalization cases due to chronic obstructive pulmonary disease and acute myocardial infarction disease as a result of short-term exposure to SO2 during years 2011 and 2012 in six major cities of Iran.
3. Methods
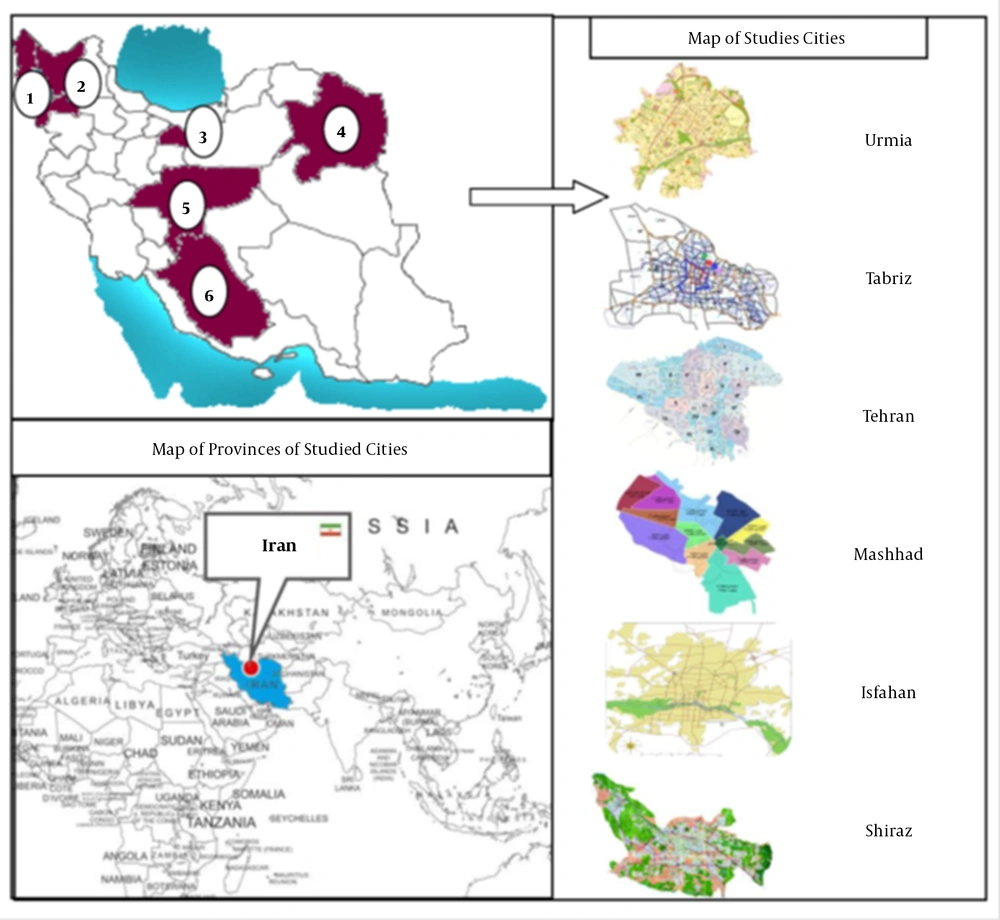
This study was conducted in six major cities of Iran. We used the AirQ software to assess and evaluate the health impact of SO2 exposure on human health in six major cities of Iran. Hourly air pollution data related to SO2 were obtained from department of environmental (DOE) of six study cities, from March 2011 to March 2012. Thereafter, 24-hour means were calculated. Map and location of studied cities is shown in Figure 1.
Gathered data were in volumetric base but the AirQ software was designed on gravimetric base, so we obtained data of pressure and temperature from Islamic Republic of Iran meteorological organization and used the following equation (22) to convert ppb unit (DOE data) to µg/m3 unit (model required):

Where, MW is molecular weight of pollutant, T is temperature as Kelvin degree and P is pressure (22). To quantify the health impact due to exposure to SO2, annual mean, winter and summer mean, annual 98 percentile, annual maximum and winter and summer maximum were calculated in all cities and their stations.
All of these corrections, processing and required statistical parameters calculation were performed using microsoft office excel spread sheet. We calculated hospital admission due to acute myocardial infarction and chronic obstructive pulmonary disease (COPD) attributed to SO2 by AirQ2.2.3 tool.
The air quality health impact assessment tool (AirQ) was proposed by the world health organization (WHO) in 2004 and developed by the WHO European centre for environment health, Bilthoven division (23, 24). This tool is based on epidemiological studies and statistical equations. Four-screen input of this model are AirQ user screen, location screen, air quality data and parameter screen (25). Outputs of model, present results in tables and graphs. Estimation is based on the attributable proportion (AP), defined as the fraction of the health outcome in a specific population attributable to exposure to specific pollutant during the period of time in a certain area. Attributable proportion is calculated using the following equation (26);

Where, p(c) is the population of the city and RR is the relative risk of health endpoints in category “C” of exposure that is obtained from an epidemiological study and exposure-response functions.
Relative risk (RR) is defined as a ratio of the probability of the event when people exposure to probability of the event when people non-exposed. Rate of health outcome attributable to the exposure (IE) was calculated as follows:
IE = I × AP (27)
Where, I is the baseline frequency of the health outcome in the population under investigation. Number of cases attributable to the exposure to pollutant (NE) with known size of population (N) can be calculated as follows:
NE = IE × N (27)
Baseline incidence (BI) is multiplied at population size and attributable proportion (AP) then divided by 105 to obtain number of excess cases (28):

Finally, after importing prepared data to the AirQ tool, results were presented as the excess cases of hospital admission attributed to sulfur dioxide pollutant in each city (28).
4. Results
Table 1 shows some calculated parameters of environmental data required for quantification by the model in six cities of Iran. Since SO2 data obtained from DOE were expressed on an hourly basis, we computed daily average values. We applied census data reported by statistical centre of Iran (SCI) in 2010 to determine the exposed population.
| Cities | Average | Winter Maximum | Summer Minimum | 98% | Exposed Population |
|---|---|---|---|---|---|
| Mashhad | 31 | 61 | 41 | 48 | 2750000 |
| Tehran | 49 | 118 | 88 | 94 | 9000000 |
| Isfahan | 12 | 26 | 20 | 19 | 1987000 |
| Tabriz | 21 | 18 | 34 | 66 | 1495000 |
| Shiraz | 11 | 34 | 32 | 25 | 1540000 |
| Urmia | 76 | 176 | 188 | 159 | 680000 |
As it can be seen in Table 1, highest annual concentrations of sulfur dioxide (μg/m3) were recorded in Urmia and Tehran, with mean values of 76 and 49 μg/m3, respectively. Overall, 20 μg/m3 was determined based on the Iranian national standards as annual average of SO2. According to these standards, in all of the studied cities except Shiraz and Isfahan SO2 exceeded the national standards. During the study period, annual mean concentrations of SO2 in Tabriz and Mashhad were approximately 1.05 and 1.55 times higher than national standards, respectively.
Baseline incidence (BI) and relative risks (RR) with 95% confidence intervals (95% CI) used for the health effect estimation in this study are shown in Table 2. Relative risks and BI used for SO2 based on other studies conducted in Iran and these parameters calculate in Iranian cities (9, 29).
| Indicators | HA- COPD, CI 95% | HA-Acute myocardial infraction, CI 95% |
|---|---|---|
| Relative risk (95% CI) per 10 µg/m3 | 1.0044 (1 - 1.011) | 1.0064 (1.0026 - 1.0101) |
| Baseline incidence (per 105 inhabitants) | 101.4 | 132 |
Days (%) which people in these six cities were exposed to different levels of SO2 are shown in Table 3. In the AirQ, it was assumed that measured concentrations show average exposure of people (30). According to the results, highest percentages of person-day for Urmia, Shiraz, Tabriz, Isfahan, Tehran and Mashhad were 12.5% (at 30 - 39 µg/m3 concentration interval), 49.86% (at 10-19 µg/m3 concentration interval), 47.95% (at 10 - 19 µg/m3 concentration interval), 21.64 (at 40 - 49 µg/m3 concentration interval) and 31.78% (at 40 - 49 µg/m3 concentration interval), 55.62% (at 20 - 29 µg/m3 concentration interval), respectively (Table 3).
| Concentration intervals, µg/m3 | Urmia | Tabriz | Tehran | Shiraz | Isfahan | Mashhad |
|---|---|---|---|---|---|---|
| < 10 | 2.14 | 16.99 | 0.27 | 8.22 | 5.48 | 0 |
| 10 - 19 | 2.86 | 47.95 | 4.93 | 49.86 | 21.37 | 0 |
| 20 - 29 | 7.5 | 16.99 | 6.3 | 14.25 | 14.25 | 55.62 |
| 30 - 39 | 12.5 | 9.04 | 16.44 | 8.22 | 7.4 | 35.62 |
| 40 - 49 | 10 | 4.66 | 31.78 | 15.07 | 21.64 | 6.85 |
| 50 - 59 | 5 | 1.37 | 20.82 | 4.11 | 14.79 | 1.37 |
| 60 - 69 | 4.29 | 1.37 | 9.59 | 0 | 5.21 | 0.55 |
| 70 - 79 | 6.43 | 0.27 | 3.84 | 0 | 1.1 | 0 |
| 80 - 89 | 6.79 | 0.27 | 2.47 | 0.27 | 3.29 | 0 |
| 90 - 99 | 3.57 | 0.82 | 2.47 | 0 | 0.82 | 0 |
| 100 - 109 | 6.07 | 0 | 0.55 | 0 | 3.01 | 0 |
| 110 - 119 | 5.71 | 0.27 | 0.55 | 0 | 0.82 | 0 |
| 120 - 129 | 3.93 | 0 | 0 | 0 | 0 | 0 |
| 130 - 139 | 5.71 | 0 | 0 | 0 | 0.27 | 0 |
| 140 - 149 | 3.93 | 0 | 0 | 0 | 0.55 | 0 |
| 150 - 159 | 5.71 | 0 | 0 | 0 | 0 | 0 |
| 160 - 169 | 4.64 | 0 | 0 | 0 | 0 | 0 |
| 170 - 179 | 1.43 | 0 | 0 | 0 | 0 | 0 |
| 180 - 189 | 1.07 | 0 | 0 | 0 | 0 | 0 |
| 190 - 199 | 0.36 | 0 | 0 | 0 | 0 | 0 |
| 200 - 249 | 0.36 | 0 | 0 | 0 | 0 | 0 |
| 250 - 299 | 0 | 0 | 0 | 0 | 0 | 0 |
| 300 - 349 | 0 | 0 | 0 | 0 | 0 | 0 |
| 350 - 399 | 0 | 0 | 0 | 0 | 0 | 0 |
| ≥ 400 | 0 | 0 | 0 | 0 | 0 | 0 |
Number of excess cases of hospital admissions due to COPD and AMI, as a result of short-term exposure to SO2 concentrations above 10 µg/m3 in six cities was estimated (Tables 4 and 5).
| Health End Point (Hospitalization) | City | RR | AP | No. of Excess Cases, Uncertainty Range |
|---|---|---|---|---|
| Hospital admission due to chronic obstructive pulmonary (HA- COPD ) | Mashhad | Central | 0.89 | 25 |
| Lower | 0 | 0 | ||
| Upper | 2.21 | 62 | ||
| Tehran | Central | 1.67 | 152 | |
| Lower | 0 | 0 | ||
| Upper | 4.07 | 371.7 | ||
| Shiraz | Central | 0.61 | 9 | |
| Lower | 0 | 0 | ||
| Upper | 1.51 | 22 | ||
| Isfahan | Central | 1.33 | 27 | |
| Lower | 0 | 0 | ||
| Upper | 3.28 | 66 | ||
| Tabriz | Central | 0.5 | 8 | |
| Lower | 0 | 0 | ||
| Upper | 1.25 | 19 | ||
| Urmia | Central | 3.18 | 22 | |
| Lower | 0 | 0 | ||
| Upper | 7.59 | 52 |
Abbreviations: AP, Attributable Proportion; RP, Relative Risk.
| Health End Point, Hospitalization | AP, Attributable Proportion | No. of Excess Cases, Uncertainty Range | |
|---|---|---|---|
| HA-Acute myocardial infraction | Mashhad | 1.29 (0.53-2.03) | 47 (19-74) |
| Tehran | 2.41 (0.99- 3.75) | 286 (118-446) | |
| Shiraz | 0.89 (0.39-1.39) | 17 (7-27) | |
| Isfahan | 1.93 (0.79-3.02) | 51 (21-79) | |
| Tabriz | 0.73 (0.3-1.15) | 15 (6-23) | |
| Urmia | 4.56(1.9-7.01) | 41 (17-63) |
According to Table 4, maximum number of excess hospital admissions due to COPD in investigated cities is related to Urmia considering the AP and exposed population.
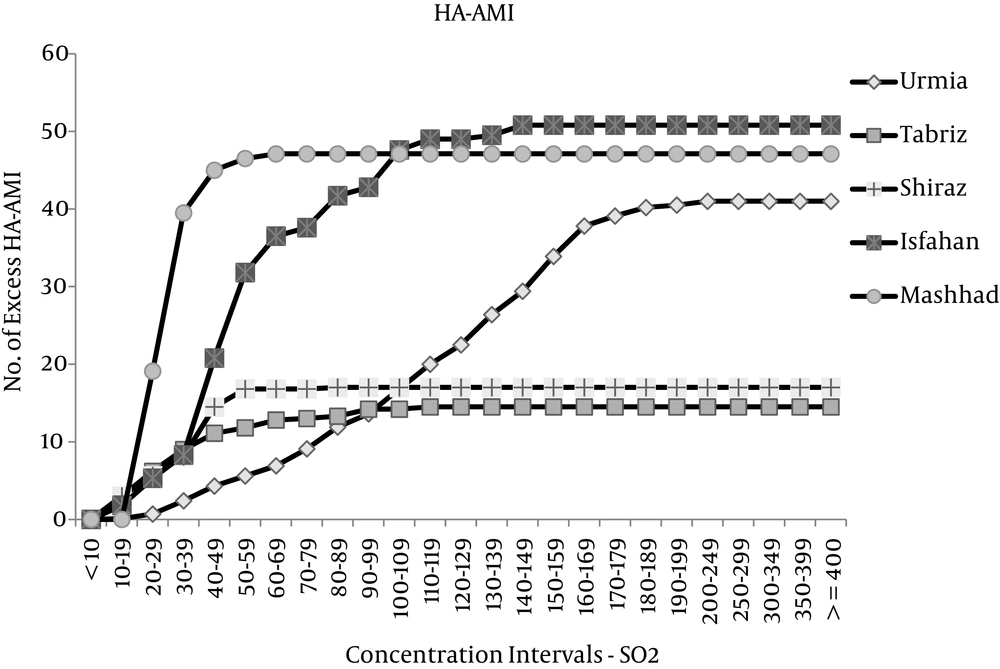
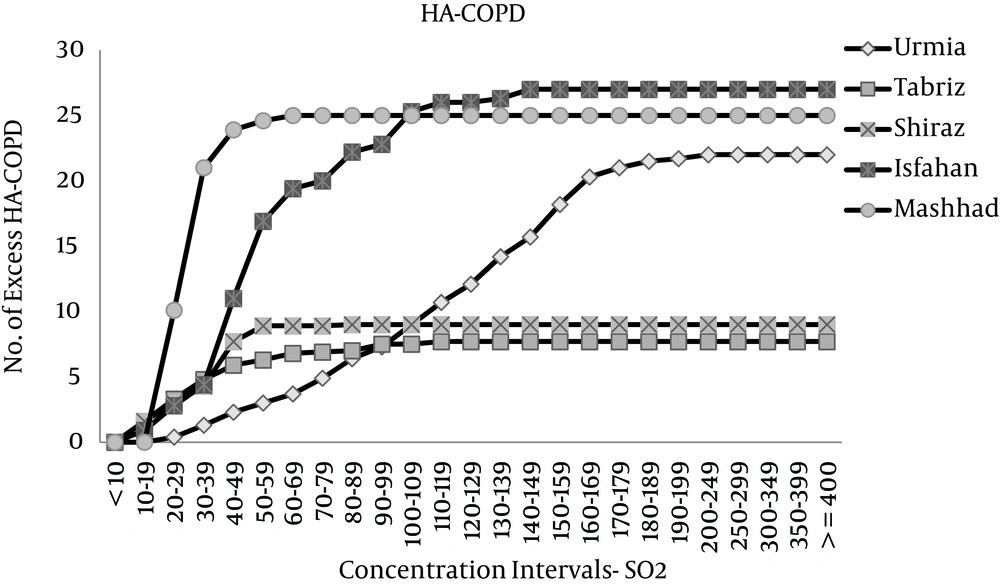
Results indicate that risks of HA-COPD and HA-AMI increase by 0.44% and 0.64% with every 10 µg/m3 increase in SO2 concentration, respectively. Output results of AirQ are shown by graphs (Figures 2 and 3).
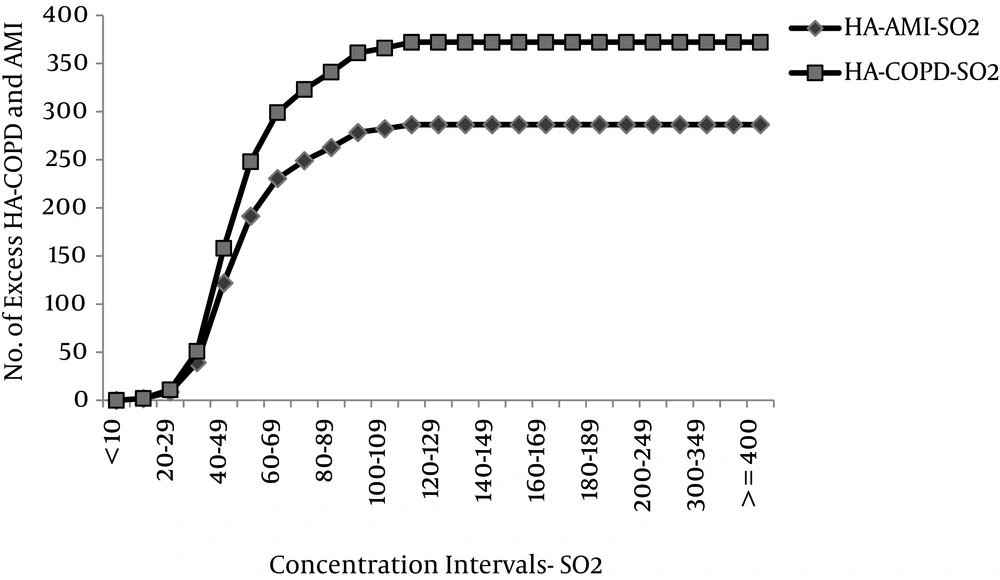
Since the number of excess HA-AMI and HA-COPD for Tehran is much higher than other cities we preferred to show this city in a different scale (Figure 4).
5. Discussion
In this study estimation of excess hospitalization due to chronic obstructive pulmonary disease (HA-COPD) and acute myocardial infarction disease (HA-AMI) due to short-term exposure to SO2 pollutants during years 2011 and 2012 was performed using a model in six major cities of Iran.
According to Table 3, the highest exposure to SO2 in mentioned cities occurred at different concentration levels as follows: 10 - 19 μg/m3 in Shiraz, Isfahan and Tabriz, 20 - 29μg/m3 in Mashhad, 30 - 39μg/m3 in Urmia and 40 - 49 μg/m3 in Tehran. Based on Table 1, annual concentration of SO2 in Tehran, Mashhad, Isfahan, Shiraz, Tabriz and Urmia was 2.45, 1.55, 0.6, 0.55, 1.05 and 3.8 times higher than the WHO standards (20 μg/m3), respectively. Therefore, all of the studied cities exceeded the SO2 national standards except Shiraz and Isfahan.
The total cumulative number of hospital admissions due to COPD (HA-COPD) was estimated in six Iranian major cities, which was 243 cases in central relative risk in a year. For hospital admission due to acute myocardial infraction (AMI), the highest impact of SO2 exposure was for Urmia with attributable proportion (AP) of 4.56%, corresponding to 41 excess cases in this city. Overall, 225 AMI hospital admission cases attributed to SO2 were reported in Tehran city by Kermani et al. (2014) (31).
In a study conducted in Korea (from January 2011 to December 2011), number of excess cases of HA COPD and HA AMI was 32.1 and 6 in central RR, respectively (26). In our study total number of excess hospitalization cases due to COPD and AMI as a result of short-term exposure to SO2 was 690 in all studied cities. Geravandi et al. (2015) studied the incidence of health endpoint in Ahvaz and recorded 173 μg/m3 for maximum annual concentration of SO2, which was observed during winter of 2012. Their study also reported that about 5.6% of COPD cases attributed to SO2 occurred at higher than 20 μg/m3 concentrations (26). In another study in Ahvaz (2014), the number of myocardial infarction and cardiovascular death cases associated with sulfur dioxide exposure was estimated to be 37 and 165, respectively (32).
Results implied that sulfur dioxide with highest and lowest AP was reported in Urmia and Tabriz, respectively, indicating the highest and lowest health end points (hospitalizations). The status of SO2 is more critical in Urmia and Tehran compared with other areas.
In a study conducted in six cities of Harvard, increased death rates in cities were reported with higher SO2 levels (33). Overall, studies carried out on this issue showed convincing evidences on the role of pollutants in the incidence of disease and death. Some other studies have shown that pollutants are a growing concern for public health (34).
Despite the fact that there is positive and direct relationship between sulfur dioxide and the total daily number of mortality, ranges of impacts attributable to exposure to SO2 or a mixture of pollutants are yet unclear. According to Dennison et al. (2002), since there are correlations between SO2 and other pollutants in the air, attributing the observed effects just to SO2 is difficult (35).
Although relative risk per 10 µg/m3 is low and sometimes mortality and morbidity attributable to pollutant seems slight because of sensitive and large population exposed to air pollutants, burden of disease associated with air pollution will be great. Sulfur compounds are the main cause of damage to materials in many cases (22). Although SO2 and other sulfur oxides have been studied, many questions about their impacts on human health have remained unanswered.
Some possible measures proposed to reduce sulfur dioxide emissions are as follows: use of low-sulfur heavy fuel oils, diminution in coal consumption, reducing the sulfur content of fuels and desulphurization of flue gas, etc. Thus, authorities should apply necessary actions and efforts based on comprehensive scientific researches in order to control air pollutants and abate their negative effects on human health. Adopting effective methods to improve air quality and to reduce people’s exposure to air pollution can be considered by policy makers.


