


1. Background
One straightforward tool to collect data from human subjects is direct questioning. Although this method is recommended as an effective approach when obtaining data on legitimate behaviors, it may not provide reliable information in many cases. Direct questioning findings are always subject to some information biases that reduce the data validity, particularly when seeking information on sensitive or stigmatized issues such as drug abuse, sexual behavior, sexual violence, or sexually transmitted infections STIs (1, 2).
Indirect questioning methods such as crosswise, a relatively new non-randomized response (NRR) model, tend to tackle these problems. Owing to its straightforward implementation, more attention was paid to crosswise model over the recent years. In this method, two yes/no questions, one sensitive, and one unrelated non-sensitive, are paired, and the respondents are asked to provide answers to the paired questions. The answers to both questions could be in concordance (both yes and both no) (A) or in discordance (one yes and one no) (B). Given that the answer to the unrelated question is unknown, the respondent’s answer to the sensitive question remains covert. Crosswise converts the reporting of concordance/discordance answers into a prevalence estimation of the sensitive response when the non-sensitive question probability is clear (1, 3)
Application of NRR methods results in reduced errors within the sensitive questions, cost reduction, increased efficiency of data acquisition, and participant engagement increase (4, 5). It is believed that crosswise can protect respondents’ privacy more than any method other that asks people directly about their sensitive behaviors (6). The social desirability bias leading to underestimated prevalence is controlled more in the crosswise model compared with direct methods and even some indirect methods such as randomized response technique (RRT) and triangular model (7). Unlike RRT and item count technique (ICT) there is no self-protective no bias in the crosswise model (7-9). Another merit of this method is that the chance of a wrong answer and self-protective strategic responding is much less compared with RRT (1).
For the first time, crosswise was applied to measure plagiarism in an experimental survey among students. Using crosswise by paper-and-pencil technique, the prevalence of plagiarism was estimated significantly higher than that of direct questioning (1). This method is performed on particular fields and among specific groups up to now; consequently, the results may not be generalized to other populations. One limitation attributed to the current study was that crosswise requires high-level of understanding skills. In Iran, this technique is so far conducted more as an experience among educated groups such as students and athletes (10-12). This method is not used in Iranian general population where people have different levels of literacy and understanding skills and are stigmatized for being infected with STIs.
The need to estimate the STIs prevalence and their associated symptoms originate from the necessity to develop intervention programs to prevent and control these infections (13). There are several techniques to estimate the STIs prevalence in general population, e g, bio-survey and routine case reporting. Howsoever, each technique has limitations. For example, the sensitivity of syndromic case reporting system in Iran is low and the information is not reliable (14). Bio-survey studies are costly and are problematic in practice. Application of simpler methods such as crosswise seems more reasonable, particularly when asking general population to report their STI-associated symptoms.
The current study aimed at assessing the crosswise method efficiency in Iranian general population and finding out if this method could be applied to this population to ask sensitive questions about STI-associated symptoms.
2. Methods
To estimate the frequency of four STI-associated symptoms, including vaginal discharge among females; urethral discharge in males; and rectal discharge and genital ulcer in both genders, a cross sectional study was conducted in 2014 on the general population of Iran using the crosswise method. Then, the findings were compared with the results obtained from a population-based survey conducted at the same time and setting (15). Since the exact prevalence of STIs was not available in the community, the STIs prevalence rate was assumed 50%. Considering the prevalence of 50%, margin of error of 0.008, and 95% confidence interval (CI), convenience sampling technique was employed to enroll 128 subjects.
The data were gathered from the general population, 18 - 60 years old people in Kerman city as an eligible representative of a developing community. Kerman is the capital city of Kerman Province in Iran located in the Eastern Mediterranean and Northern Africa (MENA) region. The population of the 18 - 60-year-old age-group was about 643,000. Moreover, 50.4% were male and 82.2% were literate. Academic education among this population was 16% (males: 17%, females: 15%) (16).
One hundred twenty-eight people participated in the current study. Kerman has four municipal areas considered as strata in the current study. The convenience sampling technique was employed and among people passing through the crowded downtown and streets, in the morning and evening rush hours (9 - 12 am and 3 - 7 pm), 16 males and 16 females were selected in each stratum. Individuals with Iranian nationality and the age range of 18 - 60 years were eligible to participate in the study. Subjects not eager to contribute were excluded from the study.
A four-part, interviewer-administered, gender-matched questionnaire was designed with two (paired) questions in each part, one sensitive and the other non-sensitive. Based on Table 1, the four sensitive questions enquired about any experience of specific STIs’ symptoms including, genital ulcer and anal discharge (in both genders), vaginal discharge, and male urethral discharge. Non-sensitive questions about birth in the spring season and having a family of four members were allocated to the inquiries about genital ulcer and anal discharge, respectively. A question about vehicle ownership among main family members was assigned to the sensitive questions regarding vaginal discharge and male urethral discharge. The following rule was used to select non-sensitive questions: The prevalence of positive response to the non-sensitive question should be known and unequal to 0.5. The non-sensitive question ought to be independent of the sensitive one. The response categories were as follows:
1: whether the answer is yes, or no to both questions: concordance option.
2: whether the answer is yes to one question and no to the other: discordance option.
| Sensitive Questions | Non-Sensitive Questions | Proportion of Similar Answers to Both Questions (95%CI) | ||
|---|---|---|---|---|
| % | Male | Female | ||
| Genital ulcer | Was he/she born in a special solar month?a | 25 | 48.4 (35.8 - 61.0) | 58.1 (45.4 - 70.6) |
| Rectal discharge | Is the number of the main family members four? | 31 | 60.9 (48.6 - 73.2) | 54.8 (42.1 - 67.5) |
| Vaginal discharge | Do his/her main family members own vehicles (car, motorcycle)? | 22 | - | 27.4 (15.9 - 38.8) |
| Urethral discharge | Do his/her main family members own vehicles (car, motorcycle)? | 22 | 37.5 (23.3 - 49.6) | - |
a21st March to 20th April, 23rd September to 22nd October, 21st June to 19 February.
The content validity of the questionnaire met the desired standards defined by experts’ evaluations (17). According to a time-location schedule, trained interviewers went to the predetermined locations and chose individuals of their same gender based on a designed age-gender table. Interviewers obtained verbal informed consent from the respondents after giving them a brief explanation about the study, how to answer the questions, independency of response, and confidentiality. Then, interviewers administered questionnaires and checked the concordance or discordance option as mentioned before.
Subsequent to screening and cleaning, all available data were coded and transferred into Stata software version 11.0. According to the prevalence of positive response to non-sensitive questions, the prevalence of sensitive questions was estimated using crosswise analyzing tool, Equation 1 (8):
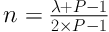
While λ was the prevalence of the same answers to both sensitive and non-sensitive questions, P was the prevalence of positive response to a non-sensitive question. The current study estimated 95% CI using estimation variance, Equation 2 (10):
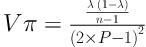
Crosswise estimations were compared with the results of the population-based survey conducted in 2014 aimed at estimating the prevalence of STI-associated symptoms in the 18 - 60-year-old Iranian population. Likewise, one of the selected cities in that survey was Kerman, wherein 615 males and 475 females were included through a multistage sampling technique and in the same setting of the current study. Participants were interviewed directly about experiencing any of the STI-associated symptoms (15). The results of the current study were assessed (95%CI of the crosswise estimations) to find out if the estimations overlapped with the results of the mentioned survey.
2.1. Ethics Approval
The research ethics committee of Kerman University of Medical Sciences approved the study protocol (ethical code: IR.KMU. ECR.1394.171) (15).
3. Results
Overall, 128 adults aged 18 - 60 years (50% male) were enrolled in the current study. About 3% were illiterate in each gender group and 59% were not university graduates. The graduation rate was higher among males. This difference was not statistically significant (P = 0.39). About 16.4% of the individuals refused to participate in the study (12.5% males, 20.3% females) stating lack of time as the main reason. Table 2 compares some characteristics of participants in the two studies (15).
| Population-Based Survey | Crosswise Method | |||
|---|---|---|---|---|
| Male | Female | Male | Female | |
| Sample size, n | 615 | 475 | 64 | 64 |
| Age groups, y, % | 28.5 | 22.4 | 25.0 | 25.0 |
| 18 - 25 | ||||
| 26 - 35 | 31.0 | 37.4 | 23.4 | 25.0 |
| 36 - 60 | 40.5 | 40.2 | 51.6 | 50.0 |
| Education, % | 0.3 | 1.9 | 3.13 | 3.13 |
| Illiterate | ||||
| Complete/incomplete high school diploma | 51.0 | 61.9 | 62.47 | 48.47 |
| Graduated | 48.7 | 36.2 | 34.4 | 48.4 |
As shown in Table 1, the prevalence of positive answer to non-sensitive questions was different from 50%. The frequency of similar answers to both questions (both yes, or both no) is also given in Table 1; there was no difference in the same answers between male and female participants (P > 0.05).
Estimated frequency for genital ulcer by crosswise was 53.1% and 34.9% in males and females, respectively, while it was 2.1% and 1.5% in the same order in the population-based survey. Using crosswise, the estimated frequency of urethral discharge in males was 72.3%, whereas it was 2.2% in the survey. The estimated prevalence of other STI-associated symptoms by the crosswise model was unexpectedly higher than that of obtained by population-based survey. Their confidence intervals did not cover each other as well. The same conclusion was drawn by subgroup analysis based on education. Crosswise estimations among illiterate people were higher (data not shown) (Table 3).
| Prevalence (% and 95%CI) | ||||
|---|---|---|---|---|
| STI-Associated Symptoms | Crosswise Method | Population-Based Survey | ||
| Male | Female | Male | Female | |
| Genital ulcer | 53.1 (50.0 - 56.1) | 34.9 (31.7 - 38.0) | 2.1 (1.3 - 2.7) | 1.5 (0.9 - 2.1) |
| Vaginal discharge | - | 86.3 (83.8 - 88.7) | - | 32.3 (29.9 - 34.6) |
| Urethral discharge | 72.3 (69.6 - 74.9) | - | 2.2 (1.5 - 2.9) | - |
| Rectal discharge | 21.1 (17.1 - 25.1) | 33.6 (29.5 - 37.6) | 1.8 (1.1 - 2.4) | 1.1 (0.6 - 1.6) |
4. Discussion
The current study aimed at evaluating the feasibility of using the crosswise model application to a general population. The estimated prevalence of STI-associated symptoms using the crosswise model in the general Kerman population was high and appeared inconsistent with the mentioned population-based survey results (15) and the estimation was not approved by STI experts in Iran (14). The observed overestimation seems to be caused by some reasons discussed hereunder.
The estimations of crosswise are higher compared to direct or even indirect estimation methods (18). Crosswise was determined as the more valid method based on the more is better assumption, since it was less likely to be affected by the self-protective no and social desirability biases (1, 10, 19). However, the higher estimated prevalence may be the artificial features’ results of this method and not an outcome of its higher validation. Confirmatory studies are needed to evaluate different techniques of estimating sensitive information; the validation study should determine the real responses and explore the crosswise results at both aggregate and individual levels (1). The possibility of validation on the crosswise model is reported low in many studies. There is no gold standard to do this evaluation. Validation needs to be outlined for each topic separately.
In a study on lifelong anabolic steroid use in Iran, the estimated prevalence by the crosswise was higher than that of self-reported one. The most important limitation of this study was lack of a gold standard for precise statistical comparison of the two methods (12). In an investigation of illicit drug use among students, crosswise estimated a higher prevalence than direct questioning. Lack of biological confirmation of self-reported behavior was mentioned as a limitation of that study (10). Another study on high-risk behaviors among students showed higher estimates by crosswise in comparison with the network scale-up (NSU) method. These two approaches are different in many aspects such as nature of questions, how to ask questions and respond to them, and data analysis; they may be incomparable (11). Another limitation was a lack of laboratory tests to confirm self-reported STI-associated symptoms. To assess the validity of the crosswise method the application of the aforementioned tests in future studies are suggested.
Another item of interest in the crosswise is the expected distribution of the non-sensitive question on which the final estimates depend on. One of the most important and difficult parts of the crosswise method is to select a non-sensitive question with an appropriate probability distribution among the study population (11). Authors believed that the incorrect selection of non-sensitive questions produced an error in the obtained estimations. Some of the non-sensitive questions were assessed in other studies (10). In the current study, the 10% sensitivity analysis was performed for non-sensitive questions probability. It did not widely change the results (data not shown). The current study evaluated the independency between sensitive and non-sensitive questions. Further studies are required to assess the indirect correlation between sensitive and non-sensitive questions.
One of the disadvantages of crosswise, particularly compared to RRT, is the low statistical efficiency (1). Although statistical efficiency improves by increasing the sample size, recruiting a large number of participants in the context of sensitive questions appears to be difficult. Bayesian methods are more convenient for the analysis of binary sensitive questions in NRR methods, mainly when the researcher has information about the considered parameters prior to the data collection (4, 20). Another limitation of the current study was the absence of Bayesian approach in data analysis.
The crosswise model efficiency mostly depends on how to implement the study (1). The study setting (2), along with themethod of completing the questionnaire seem to be important influential factors. The results of various investigations show that crosswise could be convenient for face-to-face interviews and self-administered questionnaires (9, 11, 21). Inquiry affects the respondent’s answer in two ways: providing a valid answer to the question depends on understanding the question first, and face-to-face interviews may not provide sufficient time for it. This method is believed to affect the respondent’s comfort to provide honest answers to the sensitive questions (22). Since low-literate and illiterate individuals are a part of the current study population, the face-to-face interview seemed to be more applicable for the current study. Experts believed that informing and assuring participants about the confidentiality of their responses increased their cooperation as wells as honest responding (23). Two studies evaluated high-risk behaviors among college students and 18 - 24-year-old participants in Iran. The self-administered questionnaires were applied and the participants were not worried about their responses. In another study on illicit drug use among students, the respondents were interviewed while concerned about disclosing their behaviors (5, 10-12). Nevertheless, authors think that participants had still some concerns answering questions, particularly when choosing the concordance option (both yes or both no).
Although authors believe that indirect questioning in crosswise model decreased the social desirability bias, the location selected for data collection had a great impact on the rates of real estimates. Given that the participants were interviewed in public the confidential questions made them feel embarrassed and unwilling to respond. The results of a study in Kerman showed that the best place for directly asking personal questions is the street where people feel comfortable and not worried about being recognized or pursued (17). Another study in Iran revealed that disclosure of risky behaviors on the street was higher than that of at door to door interaction or on the phone interview (24). The population-based survey on STI-associated symptoms in Kerman enjoyed the similar settings of the current study (15). Due to the crosswise model features and the bustle of the street in the current study, people might have misunderstood the questions or the responding technique. The street may be unsuitable to implement the crosswise method. Respondents may be confused and randomly answer the questions pushing the prevalence to 50% (1). Trust and understanding how to answer the questions in the crosswise model are the key prerequisites to increase the possibility of honest responding (1). Further investigations on the impact of the interview location on people’s comfort, perception, and the way of responding are proposed.
The crosswise method is mainly applied among relatively educated groups, and not in the general population, particularly in the developing countries. The crosswise studies in Iran (5, 10-12) are so far conducted among well-educated people and their results were consistent with other similar studies. It seems that understanding this method for ordinary people from the general population, with different educational/socioeconomic levels and various understanding abilities, is more or less difficult. Subgroup analysis in the current study also showed that misunderstanding of the questions and awareness paucity about how to answer them especially among illiterate people was the main reason of unreal estimates. In fact, one of the most important limitations of the current study was using the same method for the literate and illiterate individuals. More studies on how to improve the perception of questions and the responding rate in the crosswise method as well as how to detect and control the influencing factors among various socioeconomic classes and educational levels of general population are suggested.
4.1. Conclusions
The crosswise method resulted in an overestimation of STI-associated symptoms prevalence. Hence, experts in the field of STIs opposed the crosswise method. However, authors believe that other reasons, such as participants’ different levels of understanding and responding to questions, could have intensified the overestimation. Further studies are required to evaluate the influence of the study setting and questionnaire’s administration method on the reliability of the participants’ self-reports.
