1. Background
Air is at paramount of importance among vital elements in this universe. Air pollutants produced have been effects in environments and human health (1). Its seriousness lies in the fact that high, potentially harmful pollutant levels are produced in environments, which can be harmful for human health (1-3). In recent years, different epidemiological studies have shown a relationship between the air pollution typically Nitrogen Dioxide (NO2) in urban air and diseases, pulmonary damage, and mortality among population (2, 4-6). Nitrogen Oxide (NO) is gaseous colorless and odorless whereas NO2 is gaseous red amenable to organic close to brown; has a boiling point of 21.2˚C and low component pressure that it holds in gaseous state (7-9). This corrosive gas, strong oxidant and of the physiological is stimulus respiratory lower ducts and the toxicity of is several fold NO. NOx comprise of nitric oxide (NO) and NO2 and both are considered to be deleterious to humans as well as environmental health. NO2 is considered to be more toxic than NO. NO is formed inside the combustion chamber in post-flame combustion process in the high temperature region. NO gets quickly oxidized in the environment, forming NO2 (10, 11). The most important human resource producer of this gas can be of automobile exhausts and fixed sources such as fossil fuels, power plants, industrial boilers, waste incineration and heating homes named (12, 13). The main source of NO2 is in urban areas’ transportation within the city (14). Nitrogen dioxide concentration varies from morning to night. This gas absorbs sunlight of energy and primers have photochemical reaction leading to the formation of photochemical smog (8, 15). The primary and secondary standard of NO2 according to national ambient air quality standard annual average is 40 µg/m3. In particular, excessive NO2 in the air can have a marked effect on human health. Also, NO2 can cause breathing problems, bronchitis symptoms, coughing, asthma attacks, decreased pulmonary function, enzyme inhibitory activity the, pathological effects of general and systemic effects, increased risk of respiratory infections, increased susceptibility to pulmonary inflammation, irritation in the lungs that can result in reduced respiratory system resistance toward influenza, reduced lung function and lung diseases (16-25). The results of short and long term exposure to NO2 showed that this pollutant had adverse effects on human health (26). Investigations during two recent decades showed the significant contribution of particulates as air pollutants to public health (26). Dockery et al. (27) in cohort study has shown adverse health impact of long-term air pollution exposure in the six cities of the United States. This study demonstrated that chronic exposure to air pollutants is independently related to cardiovascular mortality. In another study which was conducted in Taiwan, there was an association between air pollutants’ levels and hospital admission in patients suffered from ischemic stroke, chronic obstructive pulmonary disease and asthma exacerbation (28). Results showed that higher NO2 concentration can increase the risk of cardiovascular and respiratory death. Based on the results of Katsouyanni study in 12 European cities, an increase of 50 μg/m3 in concentrations of air pollutant can were increase 3% and 2% number of mortality (29). In another study conducted in Taiwan, there was an association between NO2 levels and hospital admission in patients suffered from ischemic stroke, chronic obstructive pulmonary disease (COPD), and asthma exacerbation (28). Also, Geravandi et al. (30) in their study estimated the number of myocardial infarction and cardiovascular death cases associated with nitrogen and sulfur dioxide exposure in Ahvaz, Iran during 2014. In a similar work by Mohammadi (31) they studied the association of daily mortality with NO2 levels in Ahvaz City in 2009. In another study, Zallaghi et al. (32) showed the effects of NO2 in urban air on the health of citizens of west and southwest cities of Iran. Also, Goudarzi et al. (33) studied the association of daily mortality with NO2 levels in the Tehran, Iran, in 2009.
Furthermore, health effect of air pollutions in terms of NO2 in most of megacities, particularly Tabriz was reported. Therefore, we decided to assess health effects of NO2 that it has been not studied before (34, 35).
2. Objectives
The aim of this study was to estimate the health effects attributed to NO2 exposure using the AirQ model in Tabriz City during 2012.
3. Materials and Methods
3.1. Methods
In this quantitative study, the health effects attributed to NO2 pollutant in Tabriz City were evaluated using the AirQ models. This model is an authentic and reliable model to estimate the short-term effects of air pollutants which have been introduced by WHO in 2004. In the first stage: NO2 concentrations were measured using the air pollution monitoring stations. The stations were selected based on the US environmental protection agency (EPA) standards and 6 station available covered whole of in Tabriz. The stations were selected based on the EPA standards. Moreover, temperature and pressure parameters through the software (www.weather.ir) were recorded and read per hour. In this study 6 × 365 samples of Tabriz’s air were taken and collected.
In the second step: Raw data were processed using the Excel software (coding, averaging, and filtering) and then the impact of meteorological parameters was converted as an input file to the AirQ model.
3.2. Quantifying the Health Effects
The attributable proportion (AP), i.e. the fraction of the health outcome, which can be attributed to the exposure in a given population (assuming there is a causal association between the exposure and the health outcome and no major confounding effects on this association) for a certain time period can be calculated using the equation:

Where: RR (c)-relative risk for the health outcome in category c of exposure; p (c)-proportion of the population in category c of exposure.
The relative risk (RR) for the selected health outcome can be derived from the exposure-response function obtained from epidemiological studies.
The above formulas are based on the assumption that the RR estimate that was used in this analysis adjusted for any possible confounding factors. When the limits of confidence interval for the RR estimate are used in the formula (32, 36), one can obtain the corresponding upper and lower limits of the AP estimate, and the respective range for the number of cases in the population, attributed to the exposure. In practice, however, the uncertainty of the impact (and the range of the estimated effect) is greater due to errors in exposure assessment and non-statistical uncertainty of exposure-response function.
3.3. AirQ Model Data Analysis
Using the results of processing of information and data recorded in pollution monitoring stations in the Tabriz City and the estimated population in year 2012, the number of deaths due to No2 air pollutant can be achieved. Considering the population equivalent 1545000 persons in year 2012 and with the estimated total number of death cases caused by exposure to different NO2 concentrations, health consequences under the title number of cardiovascular deaths associated with NO2 per 100,000 people as follows would be calculated:

Mct: The number of cardiovascular dead cases due to exposure to NO2; Pt: The total number of population; Unit: the number of deaths per 100,000 people.
3.4. Geographical Features of Tabriz
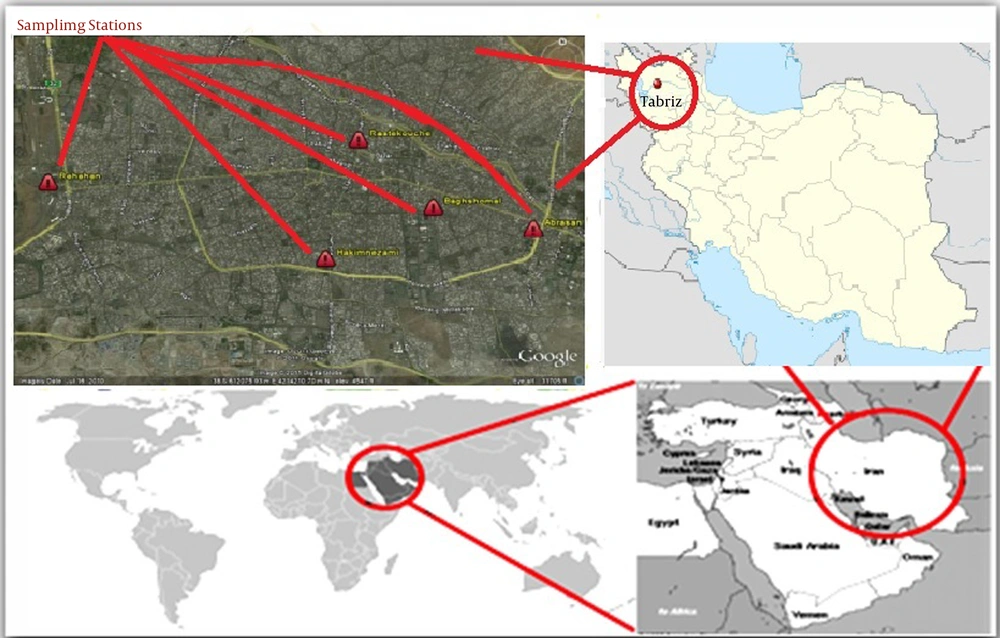
Tabriz City as the provincial capital of east Azerbaijan in the north-western Iran is currently regarded as one of the Iran’s industrial centers. Consequently, it is considered as one of the most populated and polluted Iranian cities (37-39). Tabriz city with height 1,400 meters is situated in 17/46 east longitudes and 38/08 northern latitude. Topography of the surrounding Tabriz city like a pit in three directions the North West, East and South-of side West to altitudes and to the Tabriz plains is limited. Area of this city is approximately 1781 Km2 and its population has been equivalent to 1,545,000 people in 2012 (39). The climate of Tabriz is Mountainous temperate zone with temperate summers and cold winters. Average maximum temperature of 18˚C and average minimum temperature of 6.9˚C, the average annual rainfall is 310 mL and the annual frost days were of 104 days (38-40). Location of the study area and sampling station are displayed in Figure 1. Sampling was performed for 24 hours in 6 stations. Stations were Namaz Square, Hakim Nezami, Bagh Shomal, Rahahan, Abresan and Health Stations.
3.4. Statistical Analysis
Data were analyzed using the Excel and SPSS software version 16.0.
4. Results
Regarding NO2 concentrations, Rasteh Kocheh and Baghshomal had the highest and lowest NO2 concentrations, respectively in 2012. The annual average, summer average, winter average, 98 percentile, annual max, summer max, and winter max are essential for model. In these stations have presented in Table 1. Table 1 shows that the annual mean of NO2 in Tabriz was 31.51 µg/m3 in 2012.
| Station Parameter | Baghshomal (Minimum) | Rasteh Kocheh (Maximum) | Average Tabriz |
|---|---|---|---|
| Annual average | 17.79 | 85.02 | 51.31 |
| Summer average | 17.01 | 74.87 | 86.24 |
| Winter Average | 18.60 | 95.58 | 42.38 |
| Annual 98 percentile | 33.94 | 202.83 | 66.07 |
| Annual maximum | 39.34 | 261.95 | 85.16 |
| Summer maximum | 39.34 | 241.09 | 66.70 |
| Winter maximum | 29.45 | 261.95 | 85.16 |
Table 1 shows the results of the AirQ model for health effects attributable to NO2 pollutant in Tabriz. Relative risk and estimated AP percentage for total number of deaths were estimated in Table 2. According to the model’s default, the baseline incidence (BI) of this health endpoint for NO2 was 132 per 105; so, the estimated number of excess cases was 16 at the centerline of relative risk (RR = 1.0036 and AP = 0.7649%).
| Estimate | RR (Low) | Estimated AP, % | Estimated Number of Excess Cases, Persons |
|---|---|---|---|
| Low | 1.0015 | 0.3201 | 6.5 |
| Medium | 1.0036 | 0.7649 | 15.6 |
| High | 1.0084 | 1.7667 | 36 |
a Abbreviations: AP, attributable proportions; RR, relative risk.
Relative risk and estimated AP percentage were estimated in Table 3 for cardiovascular death. Baseline incidence of this health endpoint is 497 per 105, the estimated number of excess cases was 33 at centerline of relative risk (RR = 1.002 and AP = 0.4264%).
| Estimate | RR | Estimated AP, % | Estimated Number of Excess Cases, Persons |
|---|---|---|---|
| Low | 1 | 0 | 0 |
| Medium | 1.002 | 0.4264 | 32.7 |
| High | 1.004 | 0.8492 | 65.2 |
a Abbreviations: AP, attributable proportions; RR, relative risk
The results of Table 4 showed that the AP percentage to comply with the three levels of the estimated relative risk, obstructive pulmonary cumulative number of cases was equal to 13 people.
| Estimate | RR | Estimated AP, % | Estimated Number of Excess Cases, Persons |
|---|---|---|---|
| Low | 1.0004 | 0.0856 | 1.3 |
| Medium | 1.0038 | 0.8071 | 12.6 |
| High | 1.0094 | 1.9729 | 30.9 |
a Abbreviations: AP, attributable proportions; RR, relative risk
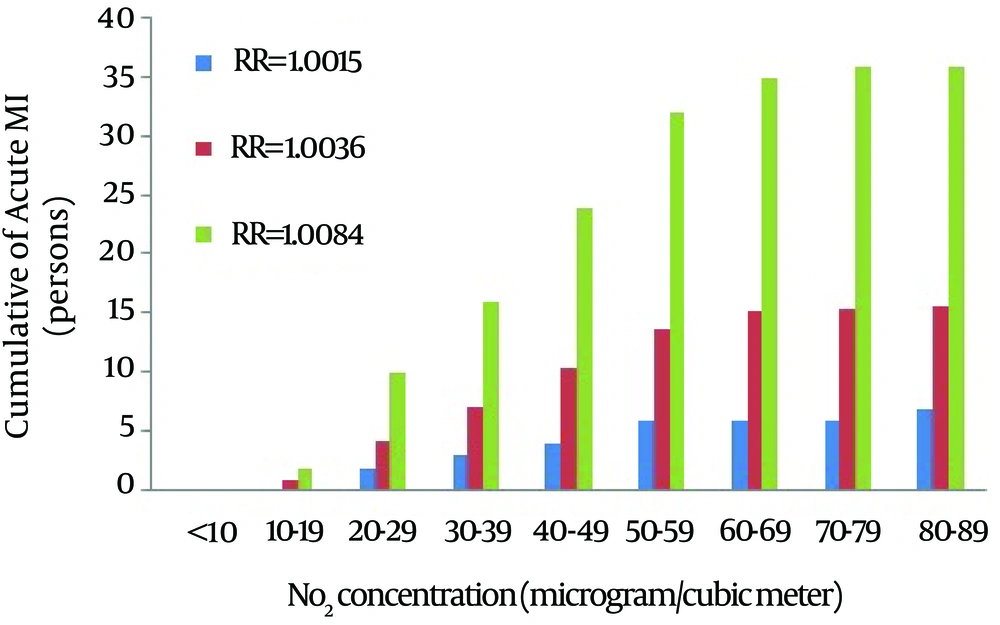
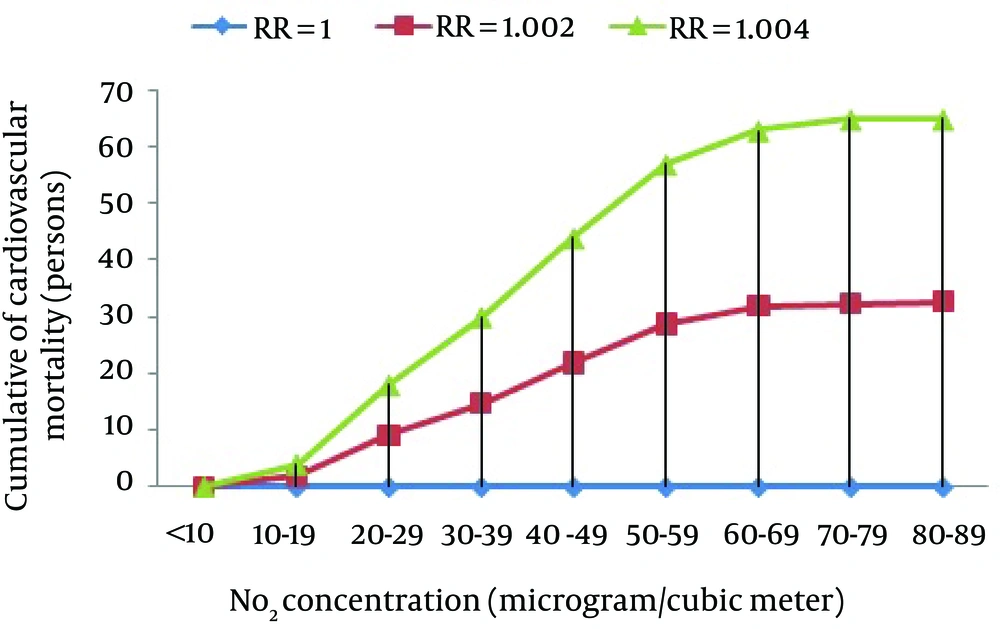
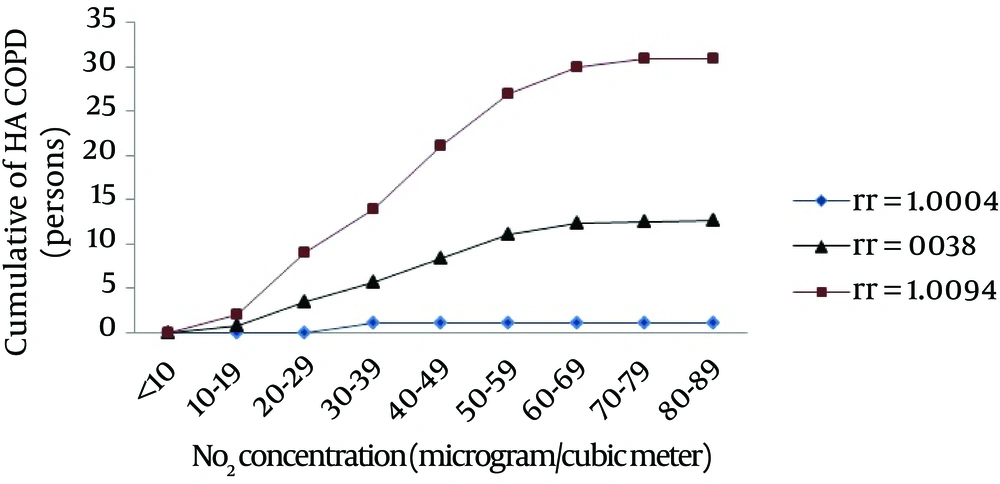
Figure 2, 3 and 4, show the results of the cumulative number of cases of acute myocardial infarction, cardiovascular deaths and chronic obstructive pulmonary disease related to NO2 concentrations.
Figure 2 shows the cumulative myocardial infarction versus NO2 concentrations. Also, it shows that because of the lack of population contact with concentrations lower than the 10 μg/m3 health effects related to NO2 was zero during 2012.
Cardiovascular deaths versus NO2 concentration has shown in Figure 3. Estimated cases which attributed to NO2 for cardiovascular deaths at lower, central and higher of RR were 0, 33, and 66, respectively. Sixty-eight percent of this number has occurred in the days with concentrations lower than 40 µg/m3.
Chronic obstructive pulmonary disease versus NO2 concentration has shown in Figure 4. It should be noted that 79% of cardiovascular deaths are corresponded to the days with concentrations below 50 µg/m3.
5. Discussion
In recent decades, air pollution is considered as a serious threat to the environment, quality of life and health of people. In this study, we estimated the number of excess cases attributed to NO2 for myocardial infarction, cardiovascular deaths and COPD cases at lower, central and higher confidence interval of RR, using the Air Quality model in Tabriz, Iran. Results showed that Tabriz with approximately 2.6% incidence myocardial infarction, cardiovascular deaths and COPD cases is one of the most polluted cities. Estimated number of excess cases attributed to NO2 for myocardial infarction, cardiovascular deaths and hospital admission of COPD at lower, central, and higher confidence interval of RR. Table 1 show that the NO2 concentration in Tabriz city is less than the annual standard in year 2012. According result Table 2, the number of people suffering from myocardial infarction at central relative risk and in BI = 132 was 15 persons. Figure 2 and 3 have illustrated NO2 concentrations versus related health endpoints and average concentrations during this year. Based on the results of this study, 7.1%, 6.3% and 8.9% of all myocardial infarction, cardiovascular deaths and COPD cases were attributed to respiratory concentrations over 20 µg/m3. With increasing the concentration of NO2 to 10 µg/m3, the risk of myocardial infarction was increased 0.36%. Figures 2, 3 and 4 showed that despite RR, health effects of NO2 in concentrations lower than 10 μg/m3 because of the lack of population contact, health effects related to NO2 was zero. In other words, there was no day in which the NO2 concentration reached below the 10 μg/m3 in Tabriz city in 2012. By reviewing the long-term national database, researchers found a higher risk of death from respiratory diseases associated with increased NO2 concentrations. According to one study in 6 Italian cities, it was shown that an increase in the NO2 pollutant levels of 10 μg/m3 of daily average was associated with an increase of 2.8% in cardiovascular diseases (41). In the United States, approximately 6.3% of the adult population (15 million people) diagnosed with COPD have been attributed to NO2 (42). Based on the results in Toronto Canada, the rates of hospital admissions due to COPD is 7.72 persons that 40.4% of them caused by exposure to NO2 (43). In 2007, Goudarzi et al. (33) exploited the AirQ model to estimate the NO2 hygienic effects on Tehran. Based on the results of Goudarzi et al. (33) study, about 2.18% of the whole cardiovascular cases and 3.8% myocardial infarction were attributed to the NO2 concentrations greater than 20 µg/m3. Low percentage of the observed health endpoints in this study was associated with low concentration of measured NO2 in Tabriz. In a similar work, Mohammadi (31) study showed that almost 2.3% of myocardial infarction and 3% of hospital admissions for COPD in concentrations more than 20 μg/m3 were compared. Based on the results of our study, the number of cases with adverse NO2 health effects was relatively lower because of the low NO2 concentration in Tabriz city, Iran. In 2010, Zallaghi et al. (32) estimated NO2 health endpoint in urban air on the health status of west and southwest cities, Iran; almost 7.5% and 5.6% of all cardiovascular death and myocardial infarction cases were attributed to NO2. The results of this study showed that the concentration of ozone in Ahvaz City is very high compared to Kermanshah and Bushehr Cities. Based on the results of our study, the number of cases with adverse health effects was the relatively high because of greater NO2 concentrations in Ahvaz City, Iran. The major limitations of this study were the lack of databases and indicators, which forced us to use the figures of WHO (Middle East Region) for calculating health effects attributed to NO2.
According to the present research findings and the relieving nitrogen dioxide exposure had effects on citizen health in Tabriz (located in north-western Iran) during year 2011 and increased cases of myocardial infarction, cardiovascular deaths and COPD. Based on the results of this study, 2.6% of myocardial infarction, cardiovascular deaths and COPD were attributed to NO2. Pollution prevention, cost-effective measures, limiting emissions of pollutants from various sources such as changing modes of transport, reducing energy consumption, management schemes and careful monitoring of air pollution are necessary to reduce NO2concentrations.


