1. Background
Statistics of deaths and mortality patterns give us insights into the current and past health status which is necessary for health planning and priority-setting of interventions (1). In addition, mortality is a main indicator of health information; it is a broader measure of socioeconomic development (2, 3). Moreover, investigating the trend of mortality rate gives a pattern of health status over time, making it useful for planning resource allocation (3).
Most of the studies on mortality carried out in Iran are limited to a specific province and a specific cause of death, such as explaining cancer mortality in 2006 (4) or road-traffic-related mortality in 2000 (5).
There are very few studies that have investigated the total mortality in the provinces of Iran which include: (i) the provincial differences in mortality estimated in 2007 by Khosravi et.al. (2), (ii) infant mortality between 1992 and 2004 evaluated by Khosravi et.al. (6), and (iii) the pattern of mortality trend in 1970 - 2010 explored by Amani and Kazemnejad (7).
Mortality is linked to many factors such as age, sex, occupation and environment (8-10). By analyzing the data from all causes of deaths in different areas and comparing them, we were able to understand the effect of environment on death. In Iran, provinces have different mortality rates (2). Iran has variant climatic, rainfall and solar radiation conditions in the western and eastern provinces (11-13); the east of Iran is more mountainous, whereas the west is more desert which may cause diversity in the pattern of mortality between these two regions.
The use of map and spatial analysis in health science is a well-established method and has become more popular in the last decade (14). In addition, mapping in mortality data can explore the relationship between environmental exposure and mortality, which can provide guidelines for intervention strategies (15).
A popular tool for mapping risk is standardized mortality ratio (SMR) but it can exaggerate the results (16), so we used smoothed SMR (relative risk) estimates to overcome this issue. The Bayesian methods are powerful tools for spatial analysis and disease mapping (17, 18).
2. Objectives
The main purpose of this study is to examine and compare the mortality trend in the east and west region of Iran in order to find out whether different climatic conditions of these two regions have any effect on the total mortality rate or not. Moreover, the gender differences are also worth studying. This contributes to planning resource allocations in the health system.
3. Methods
Registered mortality data from 2006 to 2010 were procured from the Ministry of Health and Medical Education (MOH&ME). The data on the population at risk were extracted from the Statistical Centre of Iran (SCI); these data were only available from the national censuses of 2006 and 2011, so the population at risk data for the range of 2007 to 2010 was linearly estimated.
In order to avoid any misleading results and to be able to properly compare the mortality ratios, we adjusted the effect of age. Thus, using the direct method of standardization (19), SMRs were calculated. For this standardization, Tehran’s population was used as the standard population.
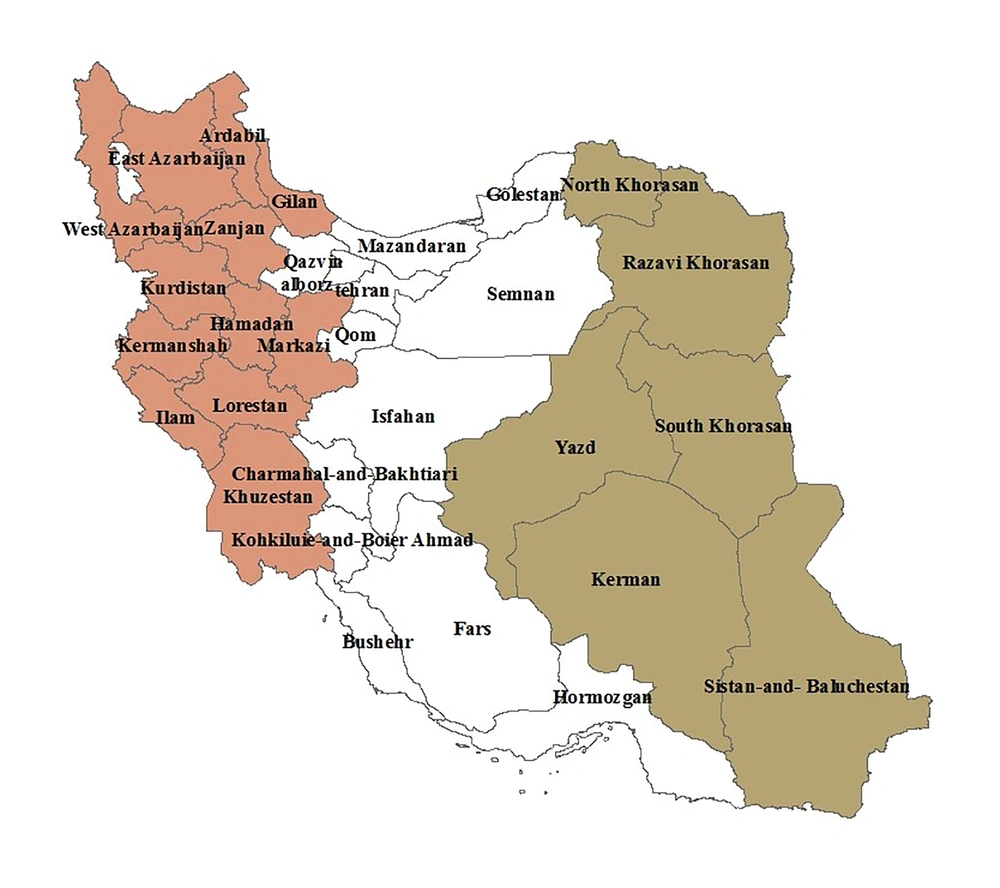
Iran’s Ministry of Interior Affairs has divided the thirty-one provinces into five regions (20). Regions three and four contain 12 provinces which are geographically located in the west (including Kordestan, Zanjan, Guilan, Ardabil, East Azarbaijan, West Azarbaijan, Kermanshah, Hamadan, Markazi, Lorestan, Ilam, and Khuzestan provinces) and region five (including Sistan and Baluchestan, Kerman, Yazd, South Khorasan, Khorasan-e-Razavi, and North Khorasan provinces) is geographically classified into the east. These divisions are shown in Figure 1.
In order to smooth the SMRs (relative risk), we utilized the Besag-York-Mollie (BYM) model (21). In order to explore the spatio-temporal linear trend, we used Bayesian spatio-temporal model as suggested by Bernardinelli et al. (22), shown in the following equations:
The number of mortality cases in each province yik was assumed to follow a Poisson distribution. In the model α is used to quantify the average mortality rate in all areas; eik is the number of expected mortalities for each area, which acts as an offset; ui is the spatially structured component for counting neighborhood structure by using conditional auto regressive (CAR) modeling; and vi is the unstructured component modeled. The every year mortality risk is multiplied by exp (β), so parameter β is an indicator of the global time effects and δi indicates the trend differences in each province. For all of the parameters in these models, suitable prior distributions were considered as follows: ui ~ N(0,τu), vi ~ N(0,τv) , δi ~ N(0,~τδ) and non-informative distribution N(0,1e-5) for β .We considered gamma distributions (0.5,0.0005) for all precision parameters.
The BYM model is similar to Bayesian spatio-temporal model, but it doesn’t have the β and δi parameters. An exposition of methodological details of the BYM model and Bayesian spatio-temporal model is presented in Lawson et al. (23) and Blangiardo and Cameletti (24).
We implemented the models using OpenBUGS version 3.2.3, a standard public domain package for Bayesian inference, using Markov Chain Monte Carlo (MCMC) methods (25). ArcGIS version 9.2 (26) was used for mapping the cases in the studied regions. Convergence for the chain was checked through graphing their traces, densities and auto-correlations. The first 1000 samples were omitted as a burn-in and the chain was run for 10000 iterations.
4. Results
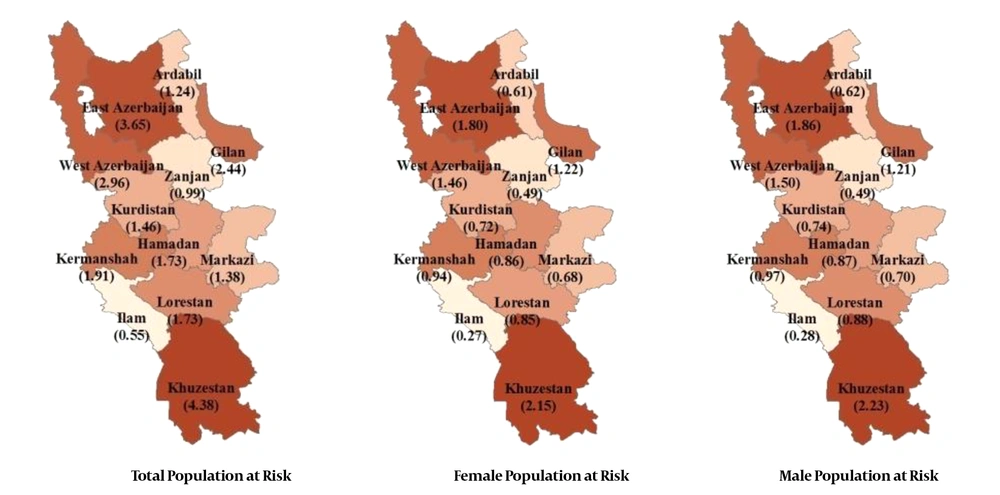
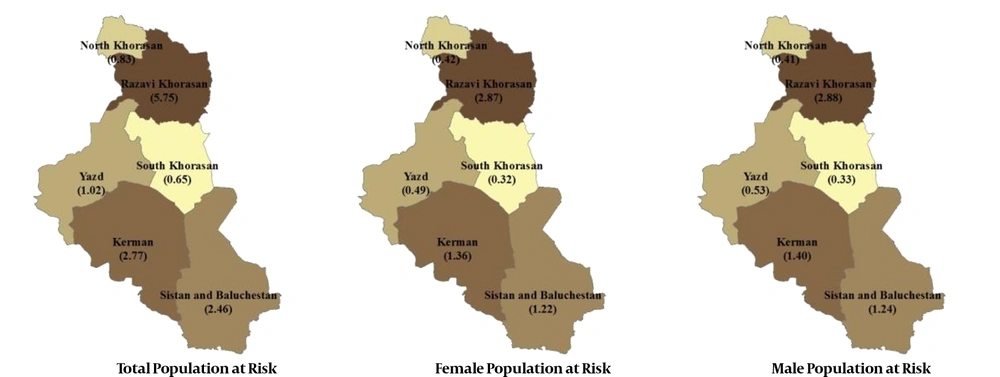
Population at risk (total and split by sex) for the western and eastern regions are shown in Figures 2 and 3, respectively (scaled 1/1000000 of 2006).
Population, number of mortality cases, total SMRs, and the total smoothed SMRs, for each of the eastern and western provinces are presented in Table 1.
| Region, Province | Total Population | Number of Mortality Cases | SMRs × 106 | Smoothed SMRs (SD) | ||
|---|---|---|---|---|---|---|
| Total | Female | Male | ||||
| West | ||||||
| Ardabil | 1236288 | 20500 | 8303 | 12197 | 0.75 | 0.75 (0.005) |
| East Azarbaijan | 3651922 | 89506 | 37050 | 52456 | 1.10 | 1.11 (0.004) |
| Guilan | 2435266 | 67466 | 27714 | 39752 | 1.25 | 1.26 (0.005) |
| Hamadan | 1725267 | 44704 | 17079 | 27625 | 1.20 | 1.18 (0.005) |
| Ilam | 550512 | 10519 | 4231 | 6288 | 0.86 | 0.87 (0.008) |
| Kermanshah | 1905722 | 50966 | 19738 | 31228 | 1.20 | 1.21 (0.005) |
| Khuzestan | 4377675 | 80591 | 32035 | 48556 | 0.83 | 0.84 (0.003) |
| Kordestan | 1461552 | 33497 | 13318 | 20179 | 1.03 | 1.04 (0.006) |
| Lorestan | 1731613 | 32409 | 12316 | 20093 | 0.84 | 0.85 (0.005) |
| Markazi | 1376338 | 33566 | 14306 | 19260 | 1.10 | 1.11 (0.006) |
| West Azarbaijan | 2956306 | 55792 | 22726 | 33066 | 0.85 | 0.86 (0.004) |
| Zanjan | 985054 | 22883 | 8711 | 14172 | 1.04 | 1.06 (0.007) |
| East | ||||||
| Kerman | 2767043 | 51496 | 20071 | 31425 | 0.93 | 0.93 (0.004) |
| North Khorasan | 834034 | 14066 | 5796 | 8270 | 0.85 | 0.84 (0.007) |
| Razavi Khorasan | 5753608 | 126243 | 51137 | 75106 | 1.10 | 1.10 (0.003) |
| Sistan & Baluchestan | 2457176 | 35806 | 12913 | 22893 | 0.73 | 0.73 (0.004) |
| South Khorasan | 646866 | 16320 | 6979 | 9341 | 1.27 | 1.26 (0.010) |
| Yazd | 1024262 | 24548 | 10774 | 13774 | 1.20 | 1.20 (0.008) |
4.1. Western Provinces
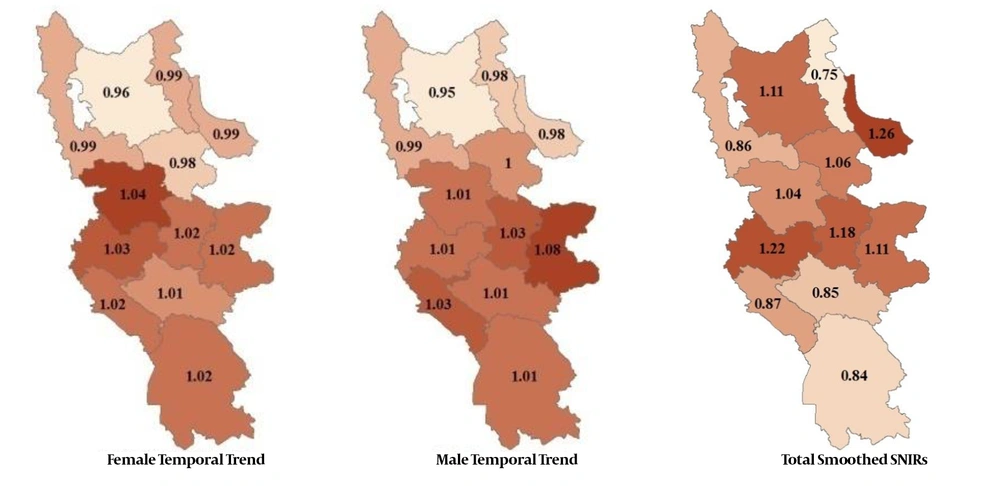
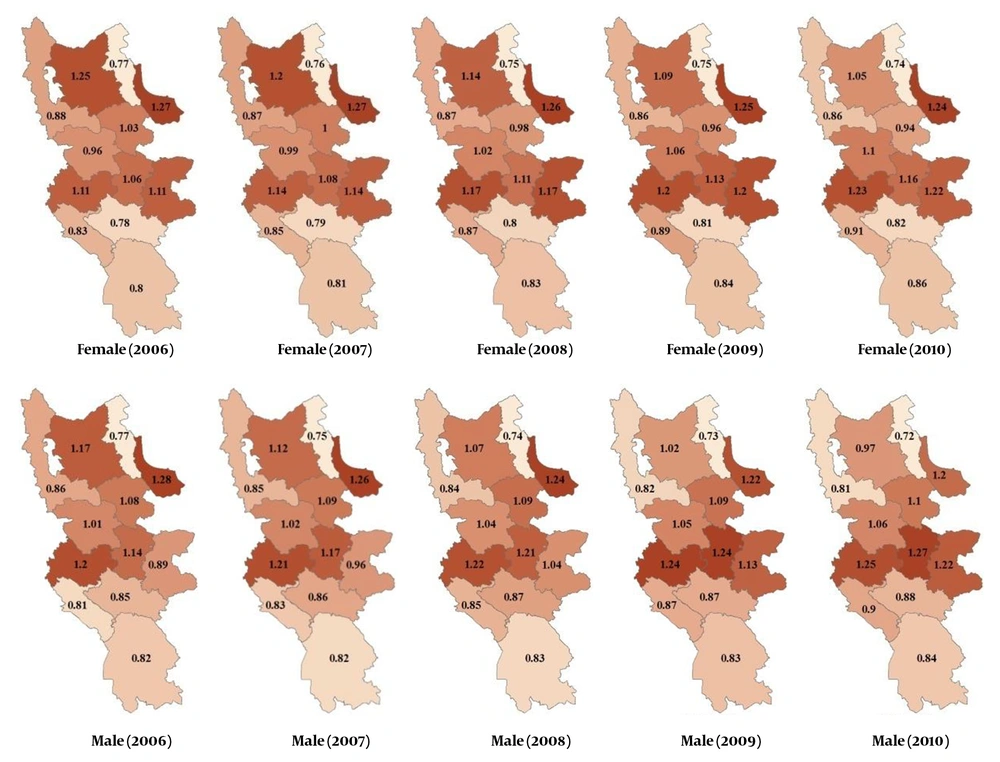
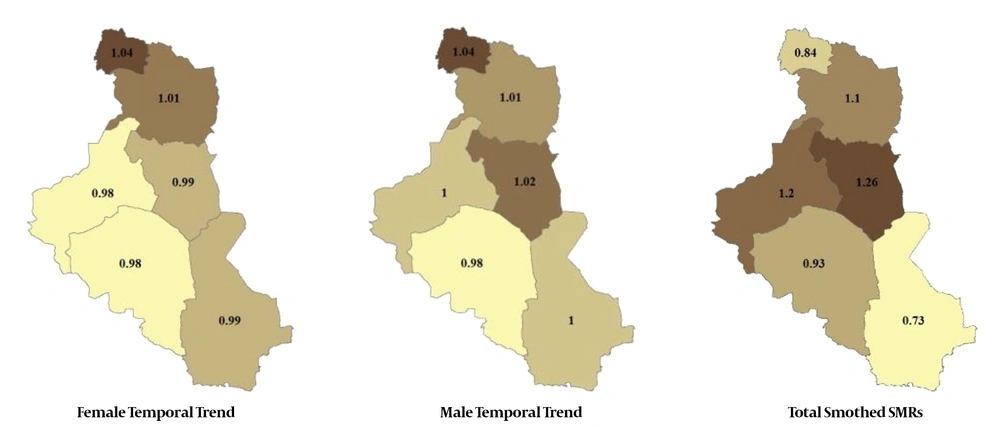
Mean overall smoothed SMRs in the west of Iran is 1.005. Smoothed SMR in each province (total and by sex) is shown in Figure 4. Guilan province with smoothed SMR of 1.26 had the highest incidence of mortality. Total Mortality risk is multiplied by 1.007 (with credibility interval (1.005, 1.01)) in every year, where in males this number is 1.007 (1.004, 1.01) and in females it is 1.006 (1.003, 1.01). There is an increase in the males’ trend compared to the females’, but the trend is generally very smooth.
The estimated relative risks in years 2006 - 2010 is shown in Figure 5. Gradual darkening of the provinces indicates that the mortality rates are increasing over time.
In fact, the relative risks shown in Figure 5 indicates a linear trend for the slope of mortality in each province. Hamadan, Kurdeistan and Markazi show the most increase in total mortality, females and males, respectively.
4.2. Eastern Provinces
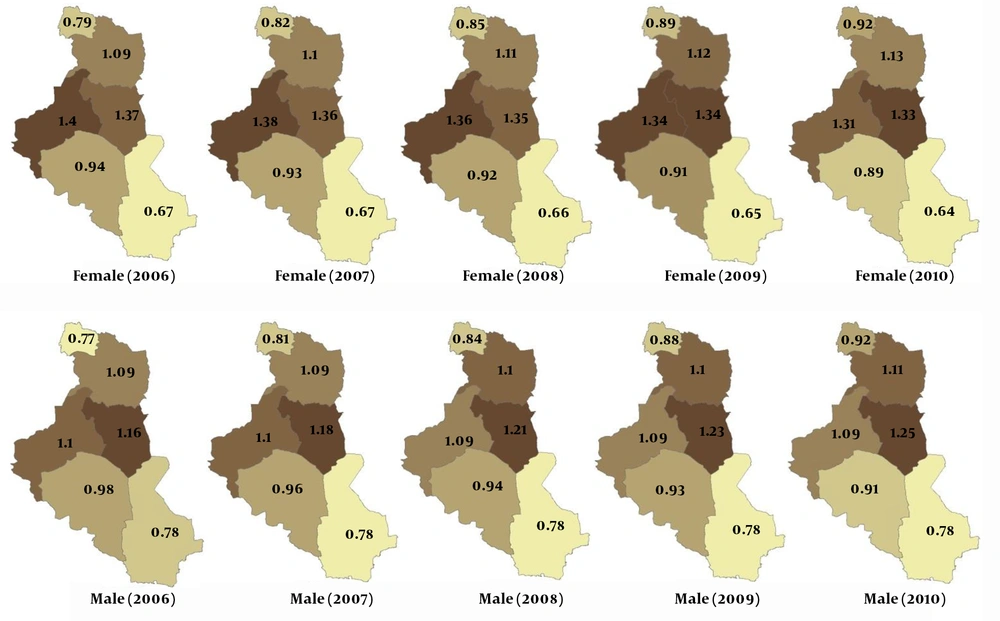
Mean overall smoothed SMRs in the east of Iran is 0.998; the smoothed SMR in each province is shown in Figure 6. The South Khorasan province with smoothed SMR of 1.26 had the highest incidence of mortality.
Total mortality risk is multiplied by 1.005 (with credibility interval (1.002, 1.01)) in every year, while this number in males is 1.007 (1.003, 1.012) and in females is 1.000 (0.994, 1.005). There is an increasing trend in males compared to females, but the trend is generally very smooth. Among all of the mentioned trends, females in the east have the best condition since their credibility intervals contains one, indicating they have a stable trend.
The estimated relative risks in years 2006 - 2010 is shown in Figure 7. Gradual darkening of the provinces indicates that mortality rates have increased over time. In fact, the relative risks shown in Figure 7 indicate that the slope of mortality has a linear trend for each province. North Khorasan has the highest mortality increase in total, females and males.
Every year, the mortality risk for females in the west was multiplied by 1.006, and for females in the east it was multiplied by 1. However, the males’ mortality risk in the west is the same as the east. Thus, the mean overall smoothed SMRs, general mortality risk and females’ mortality risk in the west are higher than the east.
5. Discussion
From 1965 to 2001, MOH&ME (Deputy of Research and Technology) collected the mortality data from cemeteries. The quality of data in this system was poor; hence, in 2002 a new comprehensive death registration system was initiated by MOH&ME (Deputy of Health). In this system, substantial changes were made to integrate the mortality data from various systems into one comprehensive system. This system is now registering death by sex, age, place and cause of death (2, 27). The use of BYM model assisted us in obtaining the appropriate and reliable results. The Bayesian approach with its advantage of accounting uncertainty improves the accuracy and precision of the results (24).
In this work, for the first time, the mortality trend in the west and east of Iran was assessed. The results indicated that the total mortality trend in these two regions was smooth (flat over five years), but due to substantial climatic differences in the west and east of Iran, perhaps the mortality trends in some causes of death in these two regions are different, which would be beneficial to study further. In addition to the smooth total mortality trend, there was a minor increase in the mortality risk in the west compared to the east, especially in females, which may be due to a risk factor related to women. Therefore, it would be valuable for policy debates to investigate the reason of this risk. Among the different combinations of region and sex, the best condition is observed in females in the east; hence, it is worthwhile to investigate the epidemiologic factors that cause this favorable condition.
Execution of effective health policies in Iran has brought upon an approximately smooth trend of mortality in the east and west of Iran. Thus, essential climatic differences in these two regions have no effect on the total mortality trend. With improvement of medical science and effective health programs in Iran, it is expected that the mortality trend to be negative in the future.
