1. Background
Water treatment plants plan a very important role in contemporary society. However, the pollution of the majority of water sources has become a subject of significant concern. Conventional methods for water treatment that involve removing the colloidal and suspended solids from raw water have a good level of efficiency (1-5). However, there are increasing concerns about the presence of organic compounds in water because these compounds provide an important resource for the formation of trihalomethanes (THMs) and mutagenic substances and they can also act as a source of carbon for microorganisms. As such, there is a need to develop new systems for removing organic compounds (5-9). Surface waters can be easily polluted and are often threatened by urban communities and industries. Because surface water represents the most important source of drinking water, it is critical that these sources are protected (10-12). Tehran’s drinking water supplies are one of the best in the world. A total of 70% of Tehran’s drinking water is sourced from the waters of the rivers of Karaj, while the remaining 30% is from walls (10). The most important organic matters that are found in natural waters are created by the decomposition of plants and include humic acid, lignins, tannins, hydrocarbons, amino acids, phenolics, and fatty acids (5, 10, 13-16). Natural organic materials (NOMs), which enter into the water from both natural and artificial sources, are of particular significance due to their odor and taste. In addition, they react with chlorine and consequently produce disinfectant by-products (DBPs), which are carcinogenic and impossible to completely eliminate via conventional treatment processes (11, 13, 17, 18). One of these natural organic materials is carbon, which is found in the chemical structure of all NOMs. The total organic carbon (TOC) that is found in the water supply in most cities is produced both naturally from special microorganisms and artificially from human-created chemical materials. Coagulant substances, alum or ferric salt, and sedimentation are required to remove high concentrations of TOC. According to the world organization health and the environmental protection agency (EPA) standards, the maximum permissible amount of TOC is 3 and 2 mg/l in the effluent of treatment plants respectively (19-21). In most cities in Iran, chlorine is used as a disinfectant to treat water because it is relatively cost effective, easier to apply, and more effective at eliminating water-borne diseases such as typhoid and cholera (22). In recent years, scientists have discovered that THMs are formed from the reaction between chlorine and water organic matters and that around 850 carcinogenic compounds may be present in water (22, 23). A similar study by Safari and et al. found that filtration units are able to eliminate dissolved organic carbon (DOC), which is a part of TOC, more efficiently than clarifier units in most seasons. However, this difference was not significant at the 5% level of the Friedman test (P < 0.05). Also, this finding was correct about turbidity with a higher percent. It is probably due to overloud and consequently increases in times the reverse washing times. In addition, the removal of TOC in the clarifier has a direct and close relationship with the removal of turbidity in the filtration unit. This relationship was found to be significant in the Wilcoxon test at the 5% level. As such, there is a strong possibility that higher amounts of soluble TOC removal can be achieved through the correct operation of the units, especially coagulation, flocculation, clarification, and the application of enhanced coagulation substances, which decrease the problems observed while working with these units (24). Due to the problems outlined above, it is important that the removal of substances and the concentration of TOC in the effluent of water treatment plants are closely monitored. A specific focus should be placed on developing an understanding of how TOC react with disinfectants and the formation of DBPs like THMs and also the existence of THMs in the WHOs and EPAs list of suspected carcinogenic substances with the aim of ascertaining how engineers can create the optimal conditions in which the formation of DBPs can be reduced (12, 25).
2. Objectives
The main objective of the present study was to investigate the TOC removal efficiency of the conventional water treatment processes in use in the Jalaliyeh water treatment plant.
3. Methods
This applied cross-sectional study employed a random sampling approach. In accordance with the standard method for sampling water for the purposes of determining TOC concentration (method B-3 5310 along with B 5910), all water samples, after filtration, were stored in glass bottles (26). Three types of water samples were extracted from the Jalaliyeh water treatment plant over the course of six months: raw water, effluent after the accelerator process, and effluent after filtration. Three samples of each type were taken on two specific days of each week, equating to 24 samples in each month and 144 samples in total. To evaluate the efficiency of the various water treatment processes that were employed to eliminate TOC at the Jalaliyeh water treatment plant, TOC experiments were conducted on samples taken from both the input and output of each process and treatment plant. The TOC was measured using a spectrophotometer (JENWY 6305, England) at a wavelength of 555 nm so that, at first, a standard curve was drawn, the vertical and horizontal axes of which were absorption rate and concentration of TOC (ppb) respectively. Following that, the amounts of TOC were calculated according to the curve. To extract samples, the sampling bottles were placed at two-thirds of the depth of the water with their openings facing the opposing direction to the water flow. The turbidity experiment on the samples was also carried out using a spectrophotometer at a wavelength of 540 nm such that the relationship between the amount of turbidity and the TOC could be evaluated (26). After the data was collected and the questionnaires were coded, SPSS statistical software was employed according to the hypothesis mentioned to conduct a range of statistical tests, which included x2, T-Test and correlation analysis. The P values of each test were also described (P < 0.05).
4. Results
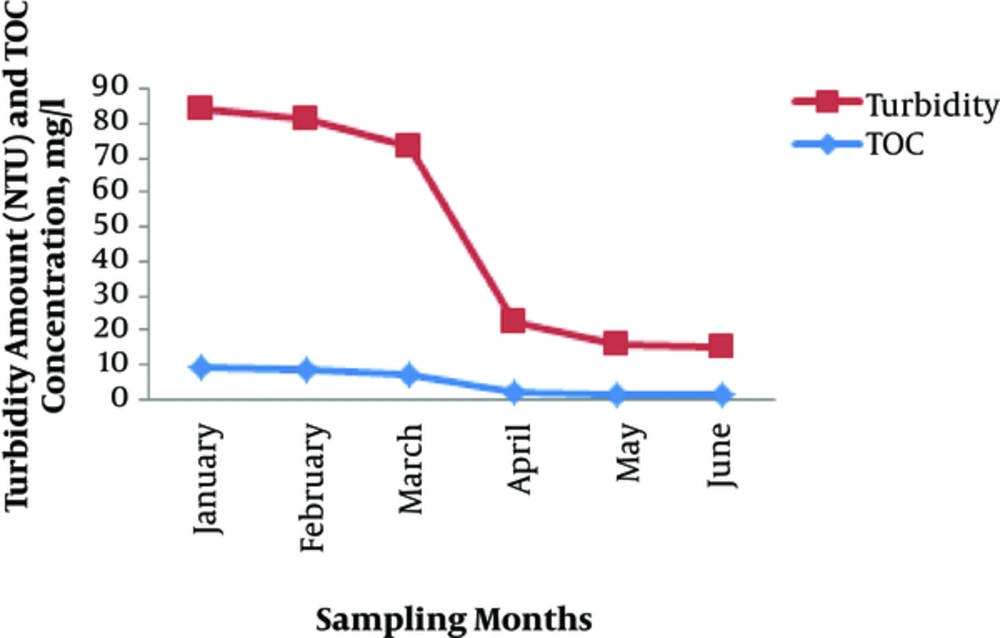
Table 1 presents the average TOC removal efficiency for each of the sampling months. As the results show, in the days that turbidity and, thereby TOC, were high, the injection of coagulant and ferric chloride was enhanced to improve the elimination of TOC input into the accelerator. As the Figure 1 shows, the amount of TOC input had a direct relationship with the amount of turbidity. This is because the water transfer line and all various process units in the treatment plant are open; therefore, as rainfall rate increases, which mainly occurs in late December and early January, the entry amount of foliage into the water also increases. As evident in the data presented in the table, the samples that were taken on the days after rainfall contained higher TOC than the others.
| Sampling Month | Input TOC (mg/l) | Output TOC (mg/l) | Elimination Efficiency (%) |
|---|---|---|---|
| January | 9.55 | 1.82 | 80 |
| February | 8.72 | 1.91 | 78 |
| March | 7.14 | 1.61 | 77 |
| April | 2.15 | 1.02 | 52 |
| May | 1.75 | 0.96 | 45 |
| June | 1.46 | 0.79 | 45 |
| Average | 5.12 | 1.35 | 62.83 |
Average TOC Content and Elimination Efficiency of TOC per Sampling Month
According to Table 1, the removal efficiency had a direct relationship with the amount of TOC input. For this reason, in the months that were characterized by a high rate of rainfall, the processes employed in the water treatment plant efficiently eliminated TOC. As the above table shows, in January, which had the highest value of TOC input, the water treatment plant achieved an efficiency of 80%, which is a little lower than expected. This could potentially be improved by increasing the amount of coagulant substances employed or through the use of a coagulant aid.
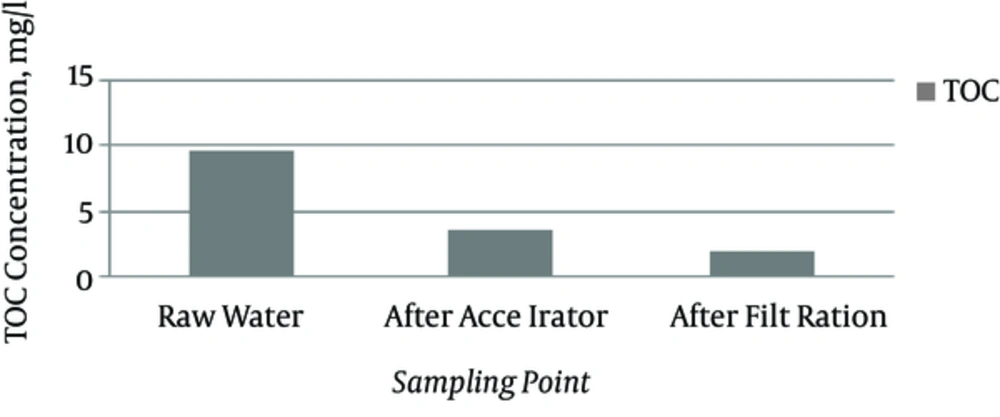
As Figure 1 shows, in January, the TOC and turbidity were at its highest during the entire sampling period. In this condition, the efficiency with which the accelerator eliminated TOC (Figure 2) was acceptable; this indicates that the majority of the constituents of TOC are suspended settleable particles that can be precipitated with coagulant substances such as ferric chloride. To enhance the efficiency of accelerator efficiency, we can either introduce more coagulant substances or exchange them for alternative substances that have a high capacity and/or have a lower surface-to-volume ratio when combined with colloidal substances.
5. Discussion
Like all treatment plants in Iran, the processes in this treatment plant have been designed in accordance with conventional water treatment processes. The main aim of this type of treatment plant is to eliminate turbidity because a considerable amount of TOC concentration is decreased as a result of the removal of turbidity removal; i.e., there is a direct relationship between these two parameters. As the water transfer line that is used in this treatment plant is open and various process units operate within it, turbidity and TOC are enhanced in the months that have high rainfall. Therefore, to improve the efficiency with which the treatment plant eliminates TOC during these months, it is necessary to employ processes such as enhanced coagulation, chemical oxidation, adsorption, and membrane methods. Among the treatment approaches that are available, enhanced coagulation is the most prevalent and economical technique, and the EPA has described it as the most appropriate method. While membrane methods may offer high efficiency, they are not economical. A study by Kim found that the maximum and minimum amounts of TOC (0.74 and 6.20 mg/L) were in summer and winter, in that order, and that the average concentration was 1.63 ± 0.56 mg/L. In addition, the average efficiency with which conventional water treatment processes eliminated TOC was 26.5% (6). In 2005, in a study in Iran, Torabian concluded that there is a relationship between air temperature and the efficiency of TOC elimination. This research also reported that the processes employed at the Tehranpars water treatment plant did not achieve a good efficiency in terms of TOC removal (21). The current study found that the processes in use at Jalaliyeh water treatment plant eliminated TOC efficiently. However, during periods of high rainfall, there were higher amounts of organic material, which increased the amount of TOC that was introduced into the water treatment plant. The present study showed that there is a direct relationship between turbidity and TOC. Unfortunately, the current research did not include any experimentation involving natural organic materials, NOMs, and such experiments were not permitted. In one study, Torabian and Pardokhti compared water that was supplied from the countryside with that supplied from the surface water supplies and high-quality water, the main source of which was in the south and west south of Tehran. They concluded that the concentration of THMs in the countryside water, like the north part of Tehran, was higher than that in other areas and that the concentration of THMs was lower than the EPA standard, the permission limit of which is 8 ppb. The highest concentration of chloroform in the water samples that were extracted from the countryside were observed in the spring and summer seasons. During the study, the average concentration of chloroform in the countryside’s water was 7 to 9.9 ppb. The study found that air temperature had a significant impact on the rate at which THMs were produced, while, in the present study, rainfall rate and the entry amount of foliage impacted the amount of TOC. In addition, Torabian and Pardokhti found that there was a direct relationship between air temperature and the concentration of chloroform; that is, the more the temperature increased, the more the formation of THMs enhanced. However, the present study concluded that the increase in the concentration of TOC could be attributed to the presence of foliage in the water, which increased turbidity (in the same way snow and rainfall caused the increase in turbidity) (27). Alsheyab and et al. found that two oxidation processes, O3 and MnO2/O3, for the degradation of precursors of THMs, humic and fulvic acids, in aqueous solution. These were investigated in this paper. The TOC and chemical oxygen demand (COD) parameters were examined to evaluate the performance of both processes of oxidation and the impact they had on the enhancement of the biodegradability was studied. While ozonation efficiently reduced the COD by 73% and the TOC by 67% at [O3] = 47 mg/l, CODi = 205 mg/l and TOCi = 28 mg/l in 30 minutes, ozone in the presence of MnO2 efficiently reduced COD by 89% and TOC by 79% in 30 minutes at [O3] = 47 mg/l, COD0 = 180 mg/l and TOCi = 38 mg/l (7). Cornelissen and et al. found the application of different anionic resins could result in a reduction of NOMs in the water from anywhere between 1% - 60%, and the amount of elimination increased as the size of the resins decreased (28). Amin et al. simulated a process whereby active carbon was added to the rapid mix basin to the coagulant substances and found that this resulted in lower elimination efficiency than that expected. This might be explained by the fact that the coagulant substances reduced the porosity of the active carbon. Considering the efficiency of different procedures, adding the active carbon in the intake is more appropriate (11). Ferric chloride is used in the Jalaliyeh water treatment plant as a coagulant substance for the elimination of TOC, and to augment both treatment efficiency and TOC removal, an enhanced coagulation method is used.
5.1. Conclusion
The samples taken from the treatment plant after days on which it had rained contained a larger amount of input organic matter, especially TOC, than the days without rainfall. It is for this reason that the water transfer line is both long and, in particular, open; therefore, the foliage has been able to enter into the water. Based on the results that were obtained before final chlorination, the amount of TOC should be reduced as much as possible to avoid the production of DBPs. In order to achieve this goal, the TOC removal efficiency should be enhanced.


