


1. Background
Volatile organic compounds (VOCs) are defined as hydrocarbons with a boiling point below 240°C to 260°C with high vapor pressure. They mainly originate in oil refineries, petrochemical and automotive industries, fossil fuels, and petroleum products (1). The operation of petroleum refineries and petrochemical plants is associated with the emission of organic compounds into the atmosphere, causing local and regional pollution that is harmful to people’s health. Long-term exposure to VOCs affects the respiratory, immune, and reproductive systems, and at its worst, it causes leukemia, a potentially fatal cancer of blood-forming organs (2, 3).
The American conference for governmental industrial hygienists (ACGIH) has classified benzene as a confirmed human carcinogen (group A1). Trichloroethylene is a suspected human carcinogen (group A2). Tetrachloroethylene, epichlorohydrin, and ethylbenzene are confirmed animal carcinogens with unknown relevance to humans (Group A3) (4).
Most petrochemical areas are located in the north of the Persian Gulf. Sixteen petrochemical complexes in the area emit high quantities of air pollutants. These petrochemical industries produce chemical products that are exported to Europe and East Asia.
The VOCs measurements in industrial areas are usually undertaken by monitoring agencies in Iran. Few studies have examined personal exposure to VOCs in petrochemical complexes (5, 6). Maghsoudi et al. (2011) measured the air concentrations of BTEX at several petrochemical complexes in Bandar_e_mahshahr in Iran. They found that 34% of the complexes in the summer and 13% of the complexes in the winter have concentrations above the permissible limits. The mean of concentrations of the pollutants in the winter was less than in the summer, and a strong variation occurred among the sampling site, which was attributed to the change in meteorology. In addition, a significant difference was found between the concentrations of the compounds in the ambient air inside and outside the factories in both seasons (5). In a study, benzene and epichlorohydrin were measured in some oil dependent industries and no significant difference was observed for benzene exposure in various occupations (6). Rahimpoor et al. (2014) studied respiratory exposure to different VOCs concentrations and compared the results with the urinary levels of its metabolites and found a significant relationship between benzene in breathing zone and urinary t, t-MA in those exposed to benzene at petrochemical complexes. The mean concentration of benzene in breathing environment and urinary t, t- ma was higher than the ACGIH's Threshold Limit Values (TLV) and Biological Exposure Indices (BEI), while the mean concentrations of other compounds were lower than TLV and BEI (7).
The hydrocarbons emitted from petrochemical complex react to oxides of nitrogen under the ultraviolet radiation of the sun and synthesize some secondary pollutants such as peroxyacetyl nitrate, hydrogen peroxide, and aldehydes. These secondary compounds are destructive ingredients of oxidizing or photochemical smog that are harmful to people and vegetation exposed to this type of pollution. The difference in the ratio of hydrocarbons in seasons shows the rate of participation of each compound in photochemical reaction at ambient air. Photochemical reaction over different seasons has been reported in some studies (8).
2. Objectives
Iran’s ministry of health and medical education has recommended the occupational exposure limits for most compounds that are emitted into the workplaces. Hence, there is an urgent need for a database of such emissions. To the best of our knowledge, only few studies have been conducted in Iran on determining personal exposure to hydrocarbons in petrochemical complexes (5, 6). Most studies have focused on 1 compound or VOCs around a petrochemical complex (9, 10); therefore, this study was conducted to evaluate the workers’ exposure to VOCs in a petrochemical complex in south of Iran. The present study aimed at determining the levels of personal exposure to hazardous compounds among different groups of workers in petroleum complexes in Iran. The effects of photochemical reaction on pollutants and the ratio of the BTEX have also been discussed in this paper to determine the changes in different seasons of the year.
3. Methods
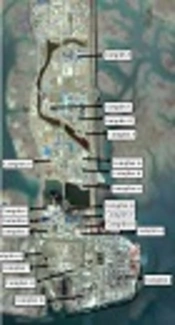
The research area was in southwest of Iran (Figure 1). This area has a warm and humid climate, and the temperature ranges from 10°C to 25°C in the winter and 35°C to 50°C degrees in the summer.

Map of Petrochemical Complex in South of Iran
A total of 716 personal air samples in 18 complexes located in Mahshar Petroleum industrial zone were collected in the winter and summer of 2014. Similar groups of exposed workers were identified, and a minimum sample size was specified for each group (346 in the winter and 370 in the summer).
Sampling was performed according to the methods proposed by the national institute for occupational safety and health (NIOSH) with the numbers 1,501, 1,500, 1,003, and 1,300 (11). Charcoal desorption tubes (SKC, USA) connected to a personal pump sampling were used to obtain samples from VOCs. The pumps were operated at 100 to 200 mL/min flow rate for 4 hours. Two samples were obtained for each worker. In some jobs (mechanics, security officers, and maintenance operators) work shift time was longer than 8 hours a day. Occupational exposure limits have been adjusted with Brief and Scola Model according to the working hours in these jobs. The Brief and Scala model reduces the threshold limit value (TLV) proportionately for both increased exposure time and reduced recovery time (12).
After samples were taken, they were transferred by ice-bag, and analyzed immediately; some samples were stored in a refrigerator for a few days at 4°C to 10°C. The compounds were extracted from charcoal with carbon disulfide. A gas chromatography equipped to mass spectrophotometry (Varian CP-3380) was used to identify compounds, and a gas chromatography equipped to flame ionization detector (SHIMATZO-2010) was used for quantification of the compounds. In both sets, separations were performed using a SGE capillary column, 25 m, and 22 mm ID with 0.25 μm stationary film thickness. The GC condition was as follows: injector temperature 200°C, the initial temperature of the column was 40°C for 10 minutes, which was increased from 180°C to 200°C at a rate of 6°C/min.
Prior to sampling, to ensure the precise identification of all compounds and determine their retention times, working standards of all compounds were prepared in the laboratory, and calibration curve was obtained for each.
After determining the concentration of each compound, the ratio of benzene to toluene (B/T), benzene to xylenes (B/X), ethylbenzene to toluene (E/T), and ethylbenzene to xylenes (E/X) were calculated in samples in the summer and the winter.
Data were analyzed using SPSS software Version 16. Kdmogrov-Smirnov test was used to check the normality of the variables; the variables were not normally distributed. To compare the measured quantities in each season, Mann-Whitney test, a non-parametric test, was used whenever the data did not follow a normal distribution.
4. Results
More than 40 VOCs were recognized in all samples (Table 1). Fourteen VOCs (benzene, toluene, xylene, styrene, ethyl benzene, clorobenzene, epichlorohydrin, tetrahydrofuran, tetra chlorethylene, methyl ethyl ketone, n-hexane, 2-butanol, acetone and 1,4 diethyl benzene) were detected in some of the samples.
| Hydrocarbons | ||
|---|---|---|
| Benzene | Arsine | 1,3 dimethyl benzene |
| Toluene | Chloro disulfide | 1-ethyl 4-methyl benzene |
| Styrene | Octane | Naphthalene |
| Xylene | Decane | Cyclo Propyl benzene |
| Ethylbenzene | Tetra decanol | Propyl benzene |
| Acetone | Tetra decane | 1-methyl 2-methyl benzene |
| n-hexane | CycloPentadecane | Alpha-methyl styrene |
| Tetrahydrofuran | Hexadecane | 1-propyl benzene |
| Epichlorohydrin | 3,5 dimethyl octane | 2-propyl benzene |
| 2-butanol | 1-Tetradecane | 1-ethyl 4-methyl benzene |
| Tetrachlorethylene | 2-methyl pentadecane | Azoline |
| Chlorobenzene | Dimethyl amine | 1-methyl naphthalene |
| Methyl ethyl ketone | 2-methyl butane | Biphenyls |
| 1,4 diethyl Benzene | Dimethyl disulfide |
The mean concentrations of most important hydrocarbons in the winter and the summer are presented in Table 2. The mean concentration of VOCs in the summer was more than the winter. BTEX was used as the raw material in petrochemical complexes 3, 4, and 5. The results in Table 2 demonstrate that most important pollutants in petrochemical complex were benzene and toluene, while 33.51% of benzene samples and 3.24% of toluene samples were more than TLV in the summer.
| Complexes | Season | Benzene | Toluene | Styrene | Xylene | Acetone | N-Hexane | Tetrahydrofuran | Epichlorohydrin | 2-Butanol | Tetra Chlorethylene | Chlorobenzene | Ethyl Benzene | Methyl Ethyl Ketone | 1,4 Diethyl Benzene |
|---|---|---|---|---|---|---|---|---|---|---|---|---|---|---|---|
| Complex 1 | Summer | 1.04 ± 1.99 | 1.31 ± 3.59 | 1.67 ± 5.00 | 3.79 ± 1.68 | 0 | 0 | 0 | 0 | 0 | 0 | 0.12 ± 0.40 | 0.11 ± 0.50 | 0 | 0 |
| Winter | 0.16 ± 0.12 | 0.32 ± 0.68 | 0 | 0.01 ± 0.02 | 0 | 0 | 0 | 0.006 ± 0.01 | 0.01 ± 0.03 | 0 | 0 | 0 | 0.03 ± 0.12 | 0 | |
| Complex 2 | Summer | 0.62 ± 0.36 | 0.04 ± 0.10 | 0.08 ± 0.14 | 0.04 ± 0.13 | 3.89 ± 1.05 | 1.94 ± 6.70 | 15.13 ± 35.51 | 0.05 ± 0.13 | 0.10 ± 0.20 | 0.03 ± 0.10 | 0.04 ± 0.10 | 0.01 ± 0.06 | 0.03 ± 0.13 | 0.01 ± 0.06 |
| Winter | 0.17 ± 0.12 | 0.06 ± 0.08 | 0 | 0.007 ± 0.01 | 0 | 0 | 0 | 0.02 ± 0.07 | 0.03 ± 0.05 | 0 | 0 | 0 | 0 | 0 | |
| Complex 3 | Summer | 0.74 ± 1.24 | 0.74 ± 1.26 | 1.82 ± 9.72 | 0.24 ± 0.83 | 6.18 ± 1.56 | 0.68 ± 3.12 | 6.46 ± 24.54 | 0.08 ± 0.32 | 0.81 ± 4.44 | 4.66 ± 30.04 | 0.05 ± 0.20 | 0.03 ± 0.11 | 0.002+0.01 | 0.005 ± 0.03 |
| Winter | 0.20 ± 0.19 | 0.19 ± 0.47 | 0 | 0.22 ± 1.13 | 0 | 0.06 ± 0.22 | 0 | 0.02 ± 0.05 | 0.05 ± 0.16 | 0 | 0.001 ± 0.01 | 0.02 ± 0.05 | 0.004 ± 0.02 | 0.002 ± 0.008 | |
| Complex 4 | Summer | 0.20 ± 0.14 | 9.19 ± 1.68 | 0.83 ± 1.88 | 8.88 ± 2.46 | 0 | 0 | 0 | 0 | 0 | 0 | 0 | 11.56 ± 2.94 | 0 | 0 |
| Winter | 0.75 ± 1.48 | 2.11 ± 6.44 | 0 | 1.78 ± 5.32 | 0 | 0 | 0 | 0.23 ± 0.63 | 0.04 ± 0.10 | 0 | 0 | 0.29 ± 0.94 | 0.005 ± 0.01 | 0.006 ± 0.01 | |
| Complex 5 | summer | 0.66 ± 0.28 | 0.08 ± 0.22 | 0.35 ± 0.33 | 0.09 ± 0.26 | 0.51 ± 0.61 | 0.13 ± 0.19 | 0 | 0 | 0 | 0 | 0 | 0.05 ± 0.14 | 0 | 0 |
| Winter | 0.13 ± 0.09 | 0.14 ± 0.28 | 0 | 0.01 ± 0.03 | 0 | 0 | 0 | 0.006 ± 0.01 | 0.02 ± 0.06 | 0 | 0.01 ± 0.02 | 0.01 ± 0.02 | 0.002 ± 0.008 | 0.01 ± 0.01 | |
| Complex 6 | Summer | 0.14 ± 0.25 | 0.20 ± 0.25 | 0.42 ± 0.74 | 0 | 0 | 0 | 0 | 0 | 0 | 0 | 0 | 0 | 0 | 0 |
| Winter | 0.10 ± 0.04 | 0.08 ± 0.08 | 0 | 0.03 ± 0.05 | 0 | 0 | 0 | 0.02 ± 0.04 | 0.17 ± 0.28 | 0 | 0 | 0.009 ± 0.02 | 0.03 ± 0.06 | 0.002 ± 0.005 | |
| Complex 7 | Summer | 0.04 ± 0.03 | 0 | 0.01 ± 0.02 | 0.08 ± 0.18 | 0 | 0 | 0 | 0 | 0 | 0 | 0 | 0.09 ± 0.20 | 0 | 0 |
| Winter | 0.17 ± 0.14 | 0.11 ± 0.20 | 0 | 0.06 ± 0.09 | 0 | 0 | 0 | 0.005 ± 0.01 | 0.05 ± 0.05 | 0 | 0.01 ± 0.03 | 0.04 ± 0.09 | 0 | 0 | |
| Complex 8 | Summer | 0.26 ± 0.43 | 0.06 ± 0.04 | 0 | 0 | 0 | 0 | 0 | 0 | 0 | 0 | 0 | 0 | 0 | 0 |
| Winter | 0.54 ± 0.37 | 0.10 ± 0.02 | 0 | 0.06 ± 0.01 | 0 | 0 | 0 | 0.09 ± 0.02 | 0.08 ± 0.08 | 0 | 0.02 ± 0.02 | 0.04 ± 0.01 | 5.50 ± 11.92 | 0.03 ± 0.05 | |
| Complex 9 | Summer | 1.08 ± 1.46 | 0.62 ± 1.22 | 0.15 ± 0.21 | 0 | 3.82 ± 6.27 | 0 | 0 | 0 | 9.58 ± 2.53 | 0 | 0 | 0 | 0 | 0.15 ± 0.22 |
| Winter | 0.20 ± 0.12 | 0.11 ± 0.17 | 0 | 0.02 ± 0.01 | 0 | 0.03 ± 0.07 | 0 | 0.11 ± 0.17 | 0.02 ± 0.05 | 0 | 0.03 ± 0.03 | 0.01 ± 0.01 | 0.03 ± 0.07 | 0.003 ± 0.007 | |
| Complex 10 | Summer | 0.03 ± 0.04 | 0.23 ± 0.24 | 0.05 ± 0.04 | 0 | 0 | 0 | 0 | 0 | 0 | 0 | 0.06 ± 0.21 | 0 | 0 | 0 |
| Winter | 0.23 ± 0.16 | 0.38 ± 0.86 | 0 | 0.04 ± 0.05 | 0 | 0 | 0 | 0.03 ± 0.05 | 0.04 ± 0.12 | 0 | 0.31 ± 0.41 | 0.01 ± 0.05 | 0.01 ± 0.03 | 0.01 ± 0.01 | |
| Complex 11 | Summer | 2.91 ± 2.43 | 2.68 ± 4.56 | 0.57 ± 0.29 | 0 | 1.18 ± 1.62 | 0.37 ± 0.38 | 0.33 ± 0.58 | 0 | 0.80 ± 1.39 | 0 | 0 | 0 | 0 | 0.17 ± 0.15 |
| Winter | 0.22 ± 0.11 | 0.12 ± 0.09 | 0 | 0.09 ± 0.11 | 0 | 0 | 0 | 0.12 ± 0.09 | 0.02 ± 0.04 | 0 | 0 | 0.06 ± 0.09 | 0.14 ± 0.14 | 0 | |
| Complex 12 | summer | 0.65 ± 0.07 | 0 | 0.14 ± 0.16 | 0 | 0.44 ± 0.44 | 0.08 ± 0.17 | 0 | 0 | 0 | 0 | 0 | 0 | 0 | 0 |
| Winter | 0.15 ± 0.21 | 0.20 ± 0.37 | 0 | 0.02 ± 0.04 | 0 | 0 | 0 | 0.19 ± 0.37 | 0.04 ± 0.08 | 0 | 0.07 ± 0.14 | 0.07 ± 0.15 | 0.23 ± 0.46 | 0 | |
| Complex 13 | Summer | 0.23 ± 0.36 | 9.70 ± 2.11 | 1.59 ± 3.31 | 0.52 ± 1.46 | 0 | 0 | 0 | 0 | 0 | 0 | 0 | 11.14 ± 4.06 | 0 | 0 |
| Winter | 0.27 ± 0.19 | 0.31 ± 0.48 | 0 | 0.24 ± 0.72 | 0 | 0 | 0 | 0.27 ± 0.47 | 0.07 ± 0.20 | 0 | 0.01 ± 0.07 | 0.04 ± 0.08 | 0.07 ± 0.20 | 0.001 ± 0.007 | |
| Complex 14 | Summer | 0.39 ± 0.23 | 0 | 1.27 ± 1.11 | 0.13 ± 0.18 | 0.36 ± 0.52 | 0.17 ± 0.25 | 0 | 0 | 0.20 ± 0.28 | 0.09 ± 0.13 | 0 | 0 | 0 | 0 |
| Winter | 0.20 ± 0.16 | 0.01 ± 0.01 | 0 | 0 | 0 | 0.11 ± 0.001 | 0 | 0 | 0 | 0 | 0 | 0 | 0 | 0 | |
| Complex 15 | Summer | 0.53 ± 0.05 | 0 | 0.08 ± 0.14 | 0 | 0 | 0 | 0.35 ± 0.60 | 0 | 0 | 0 | 0 | 0 | 0 | 0 |
| Winter | 0.28 ± 0.20 | 0.05 ± 0.05 | 8.45 ± 8.29 | 0.006 ± 0.01 | 0 | 0 | 0 | 0.04 ± 0.05 | 0 | 0 | 0 | 0 | 0.01 ± 0.02 | 0 | |
| Complex 16 | Summer | 0 | 0.35 ± 1.05 | 0 | 0.27 ± 0.81 | 0 | 0 | 0 | 0 | 0 | 0 | 0 | 0.18 ± 0.56 | 0 | 0 |
| Winter | 0.26 ± 0.11 | 1.93 ± 4.66 | 0 | 0.01 ± 0.01 | 0 | 0 | 0 | 0.23 ± 0.19 | 0.01 ± 0.04 | 0 | 0.004 ± 0.01 | 0.007 ± 0.01 | 2.36 ± 5.48 | 0.002 ± 0.005 | |
| Complex 17 | Summer | 0.33 ± 0.35 | 0.07 ± 0.17 | 0 | 0.05 ± 0.12 | 0.57 ± 0.51 | 0.09 ± 0.21 | 0.16 ± 0.22 | 0 | 0 | 0 | 0 | 0 | 0 | 0 |
| Winter | 0.17 ± 0.10 | 0.23 ± 0.27 | 0 | 0.15 ± 0.23 | 0 | 0 | 0 | 0.16 ± 0.29 | 0.55 ± 1.12 | 0 | 0.01 ± 0.04 | 0.06 ± 0.05 | 0.21 ± 0.38 | 0 | |
| Complex 18 | Summer | 0.49 ± 0.20 | 0.19 ± 0.34 | 0.48 ± 0.24 | 0 | 1.12 ± 0.47 | 0 | 0.63 ± 0.54 | 0 | 0.29 ± 0.51 | 0 | 0 | 0 | 0 | 0 |
| Winter | 0.07 ± 0.008 | 0.02 ± 0.002 | 0 | 0 | 0 | 0 | 0 | 0.01 ± 0.01 | 0 | 0 | 0.009 ± 0.01 | 0 | 0.01 ± 0.02 | 0 | |
| %of samples more than Threshold limit value | Summer | 33.51 | 3.24 | 1.08 | 0 | 0 | 0.54 | 0 | 1.08 | 0 | 0.54 | 0 | 1.08 | 0 | 0 |
| Winter | 7.56 | 1.16 | 0 | 0 | 0 | 0 | 0 | 4.07 | 0 | 0 | 0 | 0 | 0 | 0 |
A comparison of seasonal concentration of BTEX in Complexes 3, 4, and 5 is displayed in Table 3. The results revealed that benzene concentration in different seasons were significantly different in Complexes 3 and 5. Moreover, concentration of toluene and ethylbenzene in Complex 3 was significantly different in different seasons (P < 0.05). The average concentration of benzene in most petrochemical complexes was higher than the permissible exposure limit, and the average concentration of toluene in all the petrochemical complexes was lower than the occupational permissible exposure limit.
| Complexes | Total Number of Samples | Pollutant | Mean ± SD | Statistical Test | ||
|---|---|---|---|---|---|---|
| Summer | Winter | Mann-Whitney | P Value | |||
| 3 | 168 | Benzene | 0.75 ± 1.24 | 0.2 ± 0.19 | -4.58 | < 0.001 |
| Toluene | 0.74 ± 1.27 | 0.19 ± 0.47 | -1.41 | 0.161 | ||
| Xylene | 0.24 ± 0.83 | 0.23 ± 1.14 | -3.47 | 0.001 | ||
| Ethylbenzene | 0.032 ± 0.111 | 0.025 ± 0.054 | -2.398 | 0.016 | ||
| 4 | 40 | Benzene | 0.21 ± 0.15 | 0.76 ± 1.48 | -1.06 | 0.290 |
| Toluene | 9.19 ± 16.83 | 2.11 ± 6.45 | -0.908 | 0.364 | ||
| Xylene | 8.89 ± 24.64 | 1.79 ± 5.33 | -0.268 | 0.789 | ||
| Ethylbenzene | 11.57 ± 29.49 | 0.30 ± 0.95 | -1.91 | 0.056 | ||
| 5 | 36 | Benzene | 0.67 ± 0.29 | 0.13 ± 0.99 | -3.376 | 0.001 |
| Toluene | 0.08 ± 0.23 | 0.15 ± 0.29 | -1.718 | 0.086 | ||
| Xylene | 0.09 ± 0.26 | 0.02 ± 0.03 | -1.012 | 0.312 | ||
| Ethylbenzene | 0.05 ± 0.14 | 0.01 ± 0.03 | -0.274 | 0.784 | ||
In this study, n-Hexane, tetrahydrofuran, epichlorohydrin, tetracloroetilen, and ethylbenzene all had concentrations above the occupational permissible exposure limits in few petrochemical complexes.
The highest concentrations of compounds were recorded in the summer and were attributed to toluene and tetrahydrofuran. The highest concentrations of toluene were found in the winter. The highest concentrations of benzene in the summer (7.92 ppm) and the winter (4.69 ppm) were significantly higher than those of the other compounds.
The concentration ratios of B/T, B/X, E/T, and E/X in the summer and the winter samples are demonstrated in Table 4. The ratio of benzene to each compound in the winter was more than in the summer, but the ratio of ethylbenzene to xylene was less in the winter than in the summer.
| Season | B/T | B/X | E/T | E/X |
|---|---|---|---|---|
| Summer | 1.28 ± 1.74 | 1.91 ± 2.61 | 0.12 ± 0.42 | 1.21 ± 4.52 |
| Winter | 2.89 ± 2.82 | 7.52 ± 6.58 | 0.17 ± 0.67 | 0.38 ± 0.67 |
Abbreviations: B, benzene; EB, ethyl benzene; T, toluene; X, xylene.
aValues are expressed as mean ± Std. deviation.
Figure 2 displays exposure to the VOCs among different groups or workers in the complexes. The highest levels of exposure VOCs occurred among operators, site workers, analyzers, mechanics, samplers, and site men (Table 5).

Mean Concentrations of Benzene Exposure Among Different Working Groups in the Complexes
| Jobs | N | Mean ± Std. Deviation |
|---|---|---|
| Site man | 332 | 7.79 ± 32.21 |
| Analyzer | 18 | 12.14 ± 27.93 |
| Sampler | 56 | 9.43 ± 24.55 |
| Mechanic | 52 | 11.62 ± 36.24 |
| Site worker | 14 | 14.37 ± 34.75 |
| Operator | 36 | 12.95 ± 50.21 |
The results of this study revealed that samplers, maintenance operators, machinery operators, mechanics, security officers, and assembly workers worked 9-hour shifts and maintenance operators and mechanics worked 12-hour shifts. Thus, occupational exposure limits were corrected daily.
5. Discussion
The VOCs are emitted from industrial plants into the atmosphere because of different processes in each industry during petrochemical refining, production of solvents, and polymers (13). The emission of hydrocarbons to ambient air in workplaces causes the concentration of some pollutants to exceed occupational exposure levels. The results of this research revealed that the concentration of benzene is more than the exposure level recommended by centre of environmental and occupational health in Iran (14) and that the emission of hydrocarbons including benzene in the summer is more than in the winter.
Once released into the atmosphere, these atmospheric pollutants cause a local pollution problem, but are also involved in regional air pollution.
The highest concentrations of benzene come from Complex 3, which is the largest in the country. Due to the size of the complex and its southern location, the amount of pollution was explained by the prevailing winds from the northwest and west towards the south and southeast (5). In a study, Moradpour et al. (2015) demonstrated that the concentration of compounds emitted by oil-dependent chemical industry is significantly different in the winter and the summer (15).
The inter- specific ratios between the concentrations of VOCs especially benzene, toluene, ethyl benzene, and xylene specify the major emission sources of these compounds (16). In the present study, the ratios B/T, B/X, EB/T, and EB/X were studied. It was found that daylight and half-life may affect the ratios. The results of the current study revealed that both mean ratios of B/T and B/X are more in the winter than in the summer. Ethylbenzene and xylene are more reactive than benzene and toluene; therefore, their concentrations decrease quickly in the ambient air when photochemical reactions take place. Since the half-life of benzene is greater than that of toluene and xylene (17) and since solar radiation is more predominant in the summer than in the winter, the B/T and B/X ratios increase in the winter, mainly due to a decrease in the reactivity of benzene. In addition, the longer half-life and lesser reactivity of ethylbenzene along with less sunlight in the winter lead to an increase in EB/T ratio in the winter. The results of the studies by Bvkzynska et al. (2009) and Lee et al. (2002) on the urban atmosphere revealed that the ratio between VOCs depends on sun radiation and indicated that the abundance of reactive VOCs is reduced due to higher photochemical reactions during daylight (18, 19). At the same time, less reactive species usually tend to accumulate during daylight time and their abundance gradually increases. The results of research into the distribution of VOCs in Tehran showed that geography and photochemical reactions played an important role in the pollution conditions (20). The effect of season on emission of benzene was studied and the results revealed that distribution of VOCs in the summer is greater than in the winter (18, 19, 21).
Few studies have reported similar results to our study about benzene exposure. Rahimnejad et al. (2014) conducted a risk assessment of benzene in petroleum industries in the south of Iran and reported that the carcinogenic risk of benzene in 13 complexes was definitive, and the carcinogenic risk of benzene was possible in 8 complexes (22).
Negahban et al. (2014) studied the relationship between concentration of pollutants and jobs in the petrochemical complexes; and they found a significant difference in the mean of exposure to benzene and epichlorohydrin in various workshops. Occupational exposure to benzene in machiner and patrol officers were the highest and lowest values, respectively. There was no significant difference in the mean exposure to benzene in various occupations (6).
The results of the present study revealed that the maximum amount of personal exposure to the VOCs were associated with operators, site workers, and analyzers. The site workers clean the area and handle equipment, operators should have a constant presence on the site, and analyzers should also continuously perform sampling operations to determine the purity of the materials during the work shift at the site. These groups of workers spend most of their time on-site and working with equipment; therefore, their exposures are usually above the occupational limits. Golbabai et al. (2012) conducted a study in a petrochemical industry, and they found that some workers have the most exposure to the chemical compositions such as site men, analyzers and site workers. The results of this study are consistent with those of the current study (23).
5.1. Conclusions
The results of the current study revealed that benzene is the major pollutant in workplaces. Sources of fugitive emission should be recognized and be strictly controlled. The existence and concentration of VOCs depends on worker groups and raw or product materials in each petrochemical complex.
To prevent occupational diseases, it is suggested that extensive attention be paid to benzene exposure and that workers undergo periodic medical examinations. The engineering and administrative measures for controlling vapors exposure need to be strengthened, especially for operators, site workers, and analyzers. Health training should be emphasized for all workers.
Future studies should be conducted on monitoring VOCs on the suburb of petrochemical complexes; moreover, the health of those children who live near these industrial sites should be evaluated.
