1. Background
The safety of gas refineries is vital for their operation. The analysis of accidents in the past showed that the consequences of accidents in these plants may be catastrophic and irreversible, influencing human health, the environment, and the economy (1). There is a significant relationship between pressure for production and safety. Previous studies have shown that safety may be negatively associated with factors, such as pressure for production. Process industries need to provide safe working conditions for their employees, neighbors, and the environment. Safety instrumented systems (SISs) are necessary to keep the risks at acceptable levels in these industries (1, 2). Many flammable and toxic materials are used in process industries, which may have adverse effects on workers' health (3). Technical and organizational requirements can be used to reduce the risks to tolerable levels (4). According to the international electro-technical commission’s (IEC) 61511 requirements for safety of instrumented systems, LOPA is a semi-quantitative risk assessment method that can be used at different stages of systems’ life cycle from the design phase to the disposal phase. This method has often been applied to assess risks in design stages (5). Layer of protection analysis can be considered as a tool for assessing risk or hazard while it is also an engineering approach created to make sure that the risk is reduced to an acceptable level and the system is operated at a desired safety level. This is a logically defensible method. This method allows rapid and affordable identification of Independent Protection Layers (IPLs), by which the probability of accidents and consequences could be mitigated considerably (6). The method is based on separate evaluations of protection layers and determining necessary safety integrity levels (SILs) for each layer during the normal operation of a system (7, 8).
Safety integrity level recommended by IEC 61508 and IEC 61511 standards was considered as a useful tool for assessing the reliability of safety instrumented systems (9, 10). Layer of protection analysis scenarios were created according to the results obtained from qualitative hazard analysis methods, such as hazard and operability (HAZOP) analysis (11). The root cause analysis of initiating events of each scenario may be detected using HAZOP and the probability of initiating cause can be identified using the LOPA method (12).
The LOPA methodology has been used for assessing risks in a number of studies. The results of semi-quantitative risk assessment of a hydrogen production unit showed that LOPA could be successfully applied to assess risks in a hydrogen production unit. The findings of study also suggested that among 16 scenarios, without considering the independent protection layers, the levels of risks in 2 scenarios were higher than acceptable levels and these scenarios needed immediate corrective action. The levels of risks were significantly decreased after applying the independent protection layers (13).
The results of a study for determining safety integrity level at Chemtura Trafford Park site for 80 systems from 175 instrumented protective systems indicated that 25% of the systems had SIL1, 7.5% had SIL2, and 68% were in the “ungraded” classification (14).
Quantitative risk assessment methods, such as event tree analysis (ETA), which are performed to identify the causes and outcomes of initiating events, have become more practical ways to improve the levels of occupational safety and health at the workplace (15, 16). An important step in quantifying risk is considering the probability of initiating events with application of protection layers in the LOPA method. Protection layers of initiating events have been thought to be key elements in event tree analysis. The connection lines are formed from initiating events and they eventually reach the outcomes of initiating events and consequences of scenarios (11, 15).
2. Objectives
There is a high rate of accidents in oil and gas industries (1). Risks, such as fire and explosions, may have catastrophic and irreversible consequences. This study aimed at assessing risks using layer of protection analysis in gas sweetening units of 2 different gas refinery plants and determining the probability of initiating events with application of protection layers using the event tree analysis method.
3. Methods
This cross-sectional study was conducted in 2 gas sweetening units of 2 different gas refinery plants. Gas sweetening is the process of separating hydrogen sulfide and carbon dioxide from sour gas. Both studied units benefited from the same operating process as well as similar operating conditions.
To identify the hazards in gas sweetening processes, a committee of experts, including mangers of occupational health and safety departments (team leader), process control engineers, safety instrumentation system engineers, mechanical engineers, installation phase engineers, and chemical engineers with a minimum of 5 years of experience were enrolled. The HAZOP technique was applied to identify the hazards and to detect the causes of deviations and their adverse effects at the studied process plants (17). The what-if method as well as HAZOP was used for determining deviations from standard procedures and identification of potential hazards and these 2 methods were applied for formal safety audits. What-if and HAZOP methods could be used to identify hazards in petrochemical plants and related industries. Therefore, both methods could be accomplished in the same way (18).
Hazards identification was conducted by 2 complementary assessment methods and the outputs of both methods were used in LOPA and ETA risk analysis. In an attempt to identify hazards, the results of the what if method was considered as input data for the HAZOP process using the standard hazard identification (HAZID) procedure. Data obtained from the HAZOP analysis was used to assess risks using the LOPA technique (8).
Gas sweetening unit of each refinery plant was divided to 4 nodes, according to the diagram of the process and approaches of hazard identification methods. The scenarios were described for each node on the basis of identified hazards. Then, the frequency and severity of scenarios were investigated and identified hazards were recorded in appropriate worksheets. The studied operational nodes were chosen according to dangerous scenarios, including the path of entering the sure gas (node 1), absorption tower (node 2), the path of lean amine (node 3), and the path of rich amine (node 4). The functions of nodes in both gas sweetening units of both gas refinery plants were similar. It should be noted that each scenario in the LOPA method had its own causes and consequences.
Based on the results of HAZOP analysis, 4 hazards from node 2, 3, and 4 were selected for determining scenarios. The levels of risks were determined according to the risk matrix (1). More likely scenarios with significant consequences were selected. The purpose of this step was to reduce the number of scenarios in order to manage their study. Generally, 4 scenarios in the first and 4 scenarios in the second gas sweetening unit with the same hazards were selected. For each scenario, an analysis of root causes and consequences and the assessment of frequency and level of risk were conducted. Then, the levels of risks associated with each scenario were determined using the LOPA method considering the IPLs, SILs, and their associated probability of failure on demand (PFD). SILs were defined as (1):
SIL 1: The probability of failure per hour ≥ 10-5 to <10-6, and PFD ≥ 10-1 to <10-2.
SIL 2: The probability of failure per hour ≥ 10-6 to <10-7, and PFD ≥ 10-2 to <10-3.
SIL 3: The probability of failure per hour ≥ 10-7 to <10-8, and PFD ≥ 10-3 to <10-4.
SIL 4: The probability of failure per hour ≥ 10-8 to <10-9, and PFD ≥ 10-4 to <10-5.
The starting point of the analysis was determining the piping and instrumentation diagrams (P&IDs)for each studied plant. On completion of analysis, the data were analyzed using the LOPA standard template (PHA-Pro6 software) (13).
The likelihood of the scenarios and their consequences were determined using the ETA method. The probabilities of initial events in the event tree were determined by fault tree analysis (FTA) method and other branches were developed using the reliability block diagram (RBD). The initiating cause frequencies were estimated according to the approach of the center for chemical process safety (CCPS) (2001) (5). In any part of the event tree, when one branch is divided to 2 branches, the sum of their probabilities is equal to 1. It is suggested that the events were complementary. For comparing the results of ETA in 2 gas sweetening units, the initial events with different protection layers were considered.
4. Results
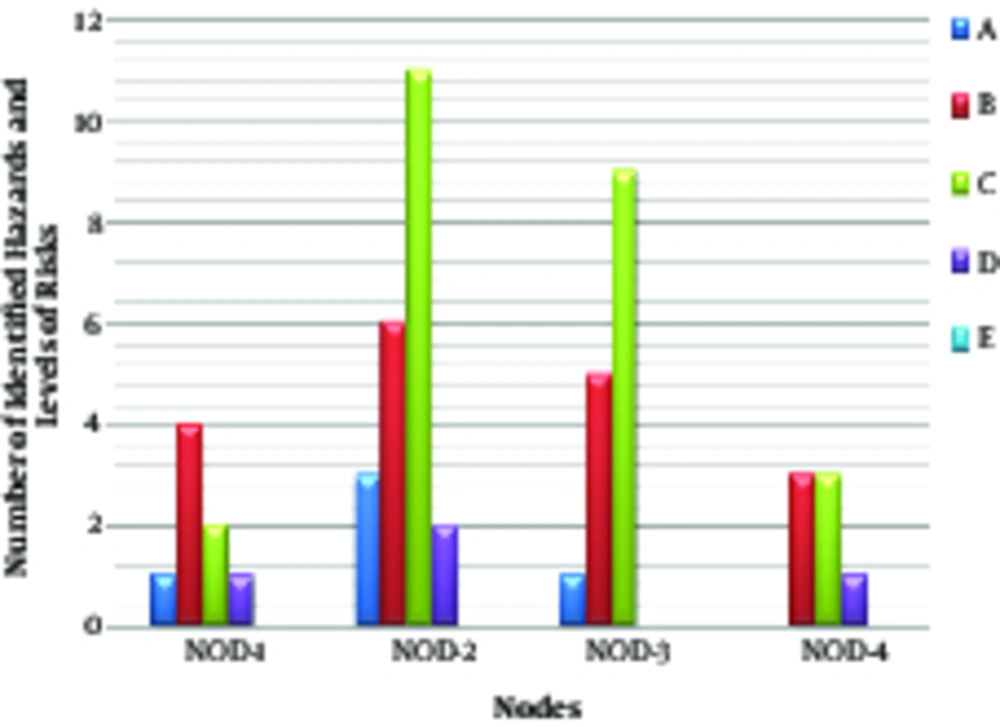
The results of hazards identification using the what-if method failed to show any differences in identified risks in 2 gas sweetening units of 2 different plants. Fourteen hazards were identified using this method. Outputs of the what-if method were then applied to determine hazards using the HAZOP method. The results of the HAZOP method led to identify 52 similar risks and their levels in the processes of 2 gas sweetening units considering the control equipment (Figure 1). Using the HAZOP method, the high level of risk (D) was calculated for the event of increase or decrease in pressure, toxic gas leakage, and rupture.
The second most significant risks were associated with scenarios of failure of valve operation, such as isolation valves. A lower level of risk (A) was associated with the scenario of lean amines entering the tower or sour gas streams to tower due to operator errors.
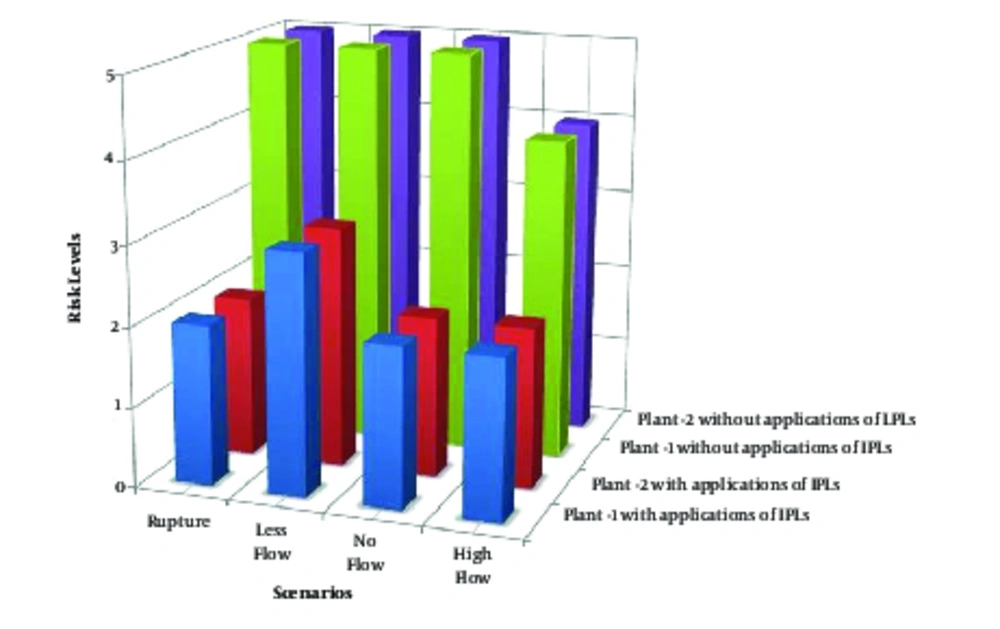
Except for the hazardous scenarios, which were defined for nodes 4 in both gas sweetening units (level of risks = D), the other scenarios obtained the same levels of risks without applications of independent protection layers. Table 1 shows the levels of risks and SILs of scenarios with and without applications of IPLs. Considering the independent protection layers for each scenario, the consequences of scenarios were decreased. Figure 2 compares the levels of risks using the LOPA method with and without the application of IPLs in both refinery plants. Table 2 illustrates the sample worksheet of LOPA using the PHA-Pro6 software.
| Plant | Node | Scenario | Without Application of IPLs | With Application of IPLs | |||||
|---|---|---|---|---|---|---|---|---|---|
| Probability | Severity | Risk Levels | Probability | Severity | Risk Levels | SILs | |||
| 1 | 2 | Severe gas leakage and rupture | Frequent | Catastrophic | Very high | Seldom | Major | Low | 4 |
| 3 | Less flow of amines to tower | Frequent | Catastrophic | Very high | Seldom | Catastrophic | Moderate | 4 | |
| 3 | No flow of amines to tower | Frequent | Major | Very high | Seldom | Major | Low | 4 | |
| 4 | More flow of amines to tower | Frequent | Serious | High | Seldom | Serious | Low | 2 | |
| 2 | 2 | Severe gas leakage and rupture | Frequent | Catastrophic | Very high | Seldom | Major | Low | 4 |
| 3 | Less flow of amines to tower | Frequent | Major | Very high | Seldom | Catastrophic | Moderate | 4 | |
| 3 | No flow of amines to tower | Frequent | Major | Very high | Seldom | Major | Low | 4 | |
| 4 | More flow of amines to tower | Frequent | Serious | High | Seldom | Serious | Low | 2 | |
| Critical Hazardous Scenario | Consequence | Initiating Event | Enabling Event or Condition | Unmitigated Event | Safeguard (Non-IPLs) | Independent Protection Layers | Mitigated Event | ||||||||||||
|---|---|---|---|---|---|---|---|---|---|---|---|---|---|---|---|---|---|---|---|
| Description | S | Description | Freq | Description | Prob | UMEF | L | RR | Description | Types of IPLs | PFD | TPFD | 1/Total PFD | SIL Equil | MEF | L | RR | ||
| Catastrophic Rupture | Catastrophic rupture of MDEA absorber with shrapnel, toxic gas release | 5 | 1- SDV-105 FAIL TO CLOSE | 1 | 5 | 1- PSV-26 and BDV-38 OR BDV-36 and PV-37 for decrease pressure and Bypass around shut down valve | 1- Pressure design are greater than max working pressure | Process Design | 1.00E-02 | 1.00E-06 | 1000000 | SIL 4 | 1 | 5 | |||||
| 2- Gas detector in site Close monitoring by operation and engineering | 2- PT-37- > PV-37 | BPCS | 1.00E-01 | ||||||||||||||||
| 3- Cheek valve in amine line | 3- PT-26- > PI-26send alarm to DCS | Operator’s Action | 1.00E-01 | ||||||||||||||||
| 4- LV-26 downstream lines lay-out to minimize pressure drop and length | 4- PSV-26 | Pressure Relief Device | 1.00E-02 | ||||||||||||||||
aNode: 2. MDEA absorber (T-101)
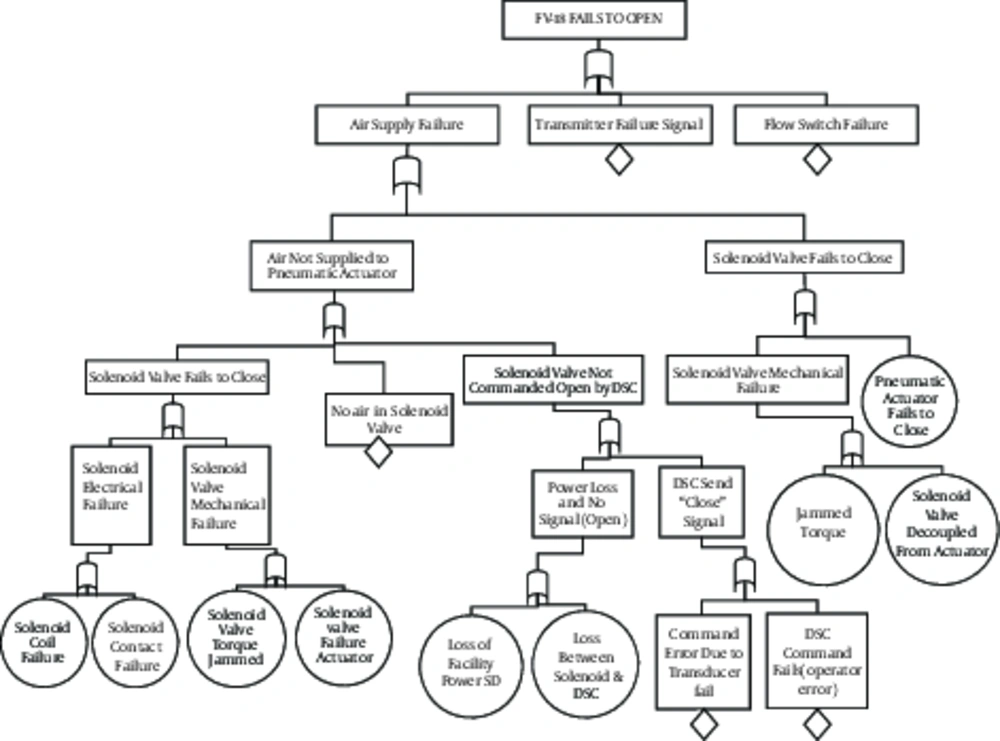
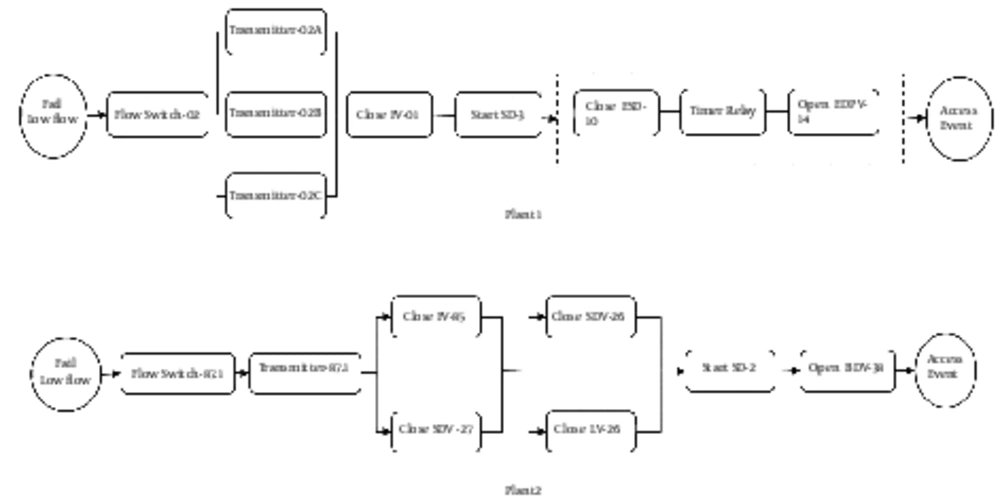
Perhaps the most serious drawback of the LOPA method was that the same safety integrity values may be calculated for systems with different independent protection layers. It could be suggested that event tree analysis may be usefully applied to more detailed analysis and explanation of different IPLs. Among 4 similar studied scenarios in both plants, 2 scenarios (no flow of amines to tower) from node 3 of studied plants were selected and analyzed using the ETA method. Using the FTA method, closing of minimum flow valves in the lean amines paths were considered as initial events in node 3 of both gas sweetening units (Figure 3). Figure 4 presents the reliability block diagrams of minimum flow of lean amines to sweetening towers in plant No.1 and No.2.
Overall, 119 near misses and incidents in plant 1 and 115 near misses and incidents in plant 2 were identified from the risk assessment procedure. Five near misses and 7 incidents with a similar path from plant 1 and 2 were selected for more detailed analysis. The results of near misses investigation and the percentage of the probability of successes of the protective layers to control the events are presented in Table 3.
| Near Miss | Plant 1 | Plant 2 |
|---|---|---|
| The probability of near miss 1 (Failure or poor performance of flow control valves) | 0.021424472 | 0.0212547 |
| The percentage of the probability of successes of IPLs | 99.75767019 | 98.96716954 |
| The probability of near miss 2 (Failure or poor performance of complementary valves) | 4.52e-05 | 4.48e-05 |
| The percentage of the probability of successes of IPLs | 0.210392133 | 0.20866187 |
| The probability of near miss 3 (Failure or poor performance of supplementary pumps) | 1.72e-06 | 1.71e-06 |
| The percentage of the probability of successes of IPLs | 0.008019085 | 0.007953152 |
| The probability of near miss 4 (failure or poor performance of signal sending apparatus) | 3.84e-06 | 0.000164021 |
| The percentage of the probability of successes of IPLs | 0.017864723 | 0.76372257 |
| The probability of near miss 5 (Failure or poor performance of pressure transmitter) | 1.46e-07 | 6.25e-06 |
| The percentage of the probability of successes of IPLs | 0.000680911 | 0.02910933 |
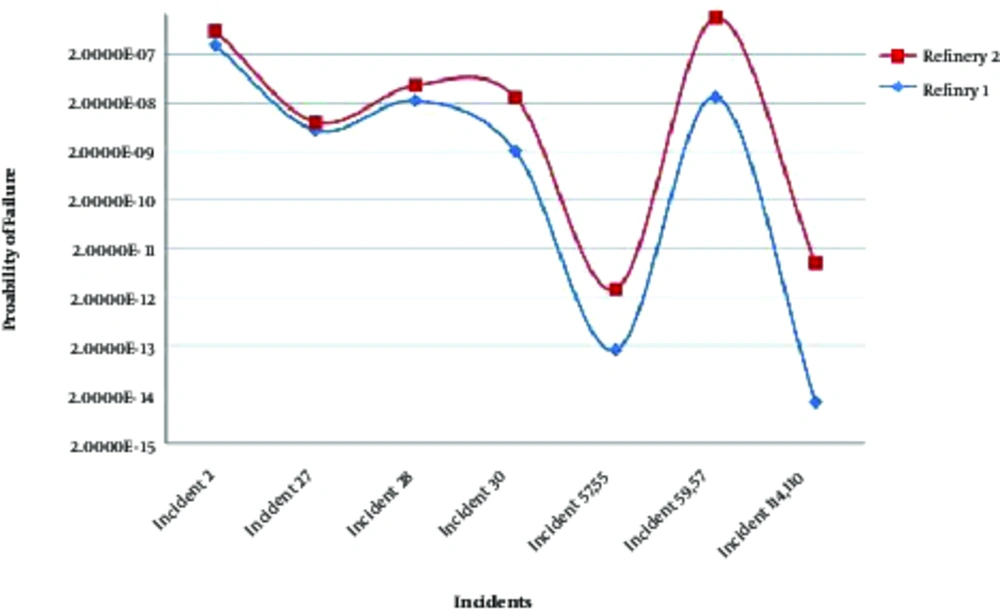
Figure 4 shows failure probabilities of identified incidents using the ETA method in both plants. The incidents will occur if the IPLs are not working properly. The control valves are closed and the gas is passed into the flare and the process stops. As shown in Figure 5, the probabilities of failures in gas refinery plant 1 were lower than those of plant 2.
5. Discussion
The results of the current investigation showed that severe gas leakage and rupture scenario (node 2) in both gas sweetening units without application of IPLs had the highest probability (frequent) and severity (catastrophic); however, considering the IPLs, the levels of risks were reduced to acceptable risk criteria. A possible explanation for this might be that the probability and severity of determined scenarios were reduced with the application of IPLs. This finding is in agreement with that of Jafari et al. (2013), who suggested that the probability of accidents was significantly reduced (P = 0.0000005) with application of necessary IPLs (13). The results of analysis using the LOPA method suggested that the calculated safety integrity level for this accident scenario in both units was 4 and the probability of failure on demand was < 0.0001. These results indicated that the maximum protection layers were performed for this scenario and an acceptable level of safety was observed. It is encouraging to compare this figure with that of Ouazraoui et al. (2012), who found that higher safety integrity levels could be achieved by application of required IPLs, which led to reduction of severity and probability of accidents (3).
The applications of proposed IPLs to less flow of amines to sweetening towers scenario in node 3 of both refineries could not reduce the severity of this scenario enough for acceptable risks. This scenario therefore needs administrative and engineering measures to be applied in order to reduce its’ risk to an acceptable level (19).
Calculated SILs in the LOPA risk assessment for this scenario in both plants was SIL 4, however, total PFD for this scenario with application of all protection layers in plant 1, such as relief valves, safety instrumented systems, and operator performance, was 1 × 10⁻⁷. This indicates the lower probability of failure and higher operation reliability at this gas sweetening tower.
The probability of dangerous failures per hour of system was at the lowest level. In plant 2, total PFD for less flow of amines to tower scenario with application of IPLs, such as check valves, was 1 × 10⁻⁶. Although the levels of SILs for less flow of amines to sweetening towers scenario in both plants were the same, a comparison between obtained PFD for this scenario in the 2 plants revealed that plant 1 provided a system with higher reliability by adding 2 check valves and relief valves, while plant 2 had 1 check valve and 1 relief valve in this line. The findings of Berg (2007) in the process industry for the PFD of basic process control systems and relief valves in studied industry was 1 × 10⁻² (2). A comparison of the 2 results reveals higher SILs for independent protection layers in this study. Also at this node, the probability and severity of no flow of amines to sweetening towers scenario were reduced with application of related IPLs. The obtained SILs for this scenario in both plants was SIL 4, which suggested effective layers of protection for this scenario, and the provided by-pass valves and alarms for warning about lack of adequate flows of amines to sweetening towers also improved the safety integrity of the systems.
In the fourth node, high flow of amines to tower had a high probability without application of IPLs. Considering existing IPLs, the probability of this scenario was reduced to its lowest level. The calculated SIL in the LOPA assessment for this scenario in both plants was SIL 2, which indicated inadequacy of liquid-level alarms, flow reducing valves, and an automatic alarm system to an operator to reduce or interrupt the flow. Systems need to be protected from hazards by adding more independent protection layers. Beckman (1998) suggested that safety integrity levels of SIL 2 and higher can be improved by adding more redundancies for safety instrumented systems (20). As mentioned in the literature (21), designing and application of special alarms, to warn operators, may greatly reduce the levels of risks in this scenario.
The results of ETA for more detailed analysis of lack of amines flow to the tower scenario suggested that the probability of control of incidents during the first seconds in refinery plant 1 was higher than that calculated for refinery plant 2. There are 2 check valves and a pressure transmitter in plant 1 in order to reduce the probability of incidents, however, there is no pressure transmitter in plant 2 and there is only 1 check valve for control of incidents in this plant. The probability of the total near misses in plant 1 and 2 were 0.00214753 and 0.00214149, respectively. The probability of incidents, according to top events in refinery 1 and 2, was 0.0000011 and 0.000005, respectively. The results of Hong et al. (2009) indicated that ETA is an effective tool for quantitative analysis of consequences and probability of accidents in some industries (22).
Risk assessment in process industries is an effective method for determining the levels of integrity for safety. Design of safer equipment as a principle could reduce the system requirements for safety instrumentation, leading to lower maintenance and installation costs.
