1. Background
Widespread emission of radioactive waste streams has led to a drastic growth in the concentration of rare-earth elements (REEs) in the surrounding environment. Lanthanum (III) is an important metal of REEs. These metals have irreversible effects on the human and environment if they reach water resources (1, 2). La (III) is used in the field of optical glasses, carbon arc lamps, catalysts, superconductors, agricultural, iron and steel, studio lighting, and cinema projection, and it is also observed in rare earth minerals like allanite and monazite (3, 4). Thus, the abatement of La (III) from polluted streams is necessary.
In this regard, researchers have explored various techniques. Among them, the adsorption process owing to its cost-effectiveness, practical in operation, simplicity of design, and good performance for adsorption of various types of pollutants such as radionuclides, lanthanides, and toxic metal ions, has been the most promising candidate (5). Recently, nano zero-valent iron particles (nZVI), which are Nano-magnetic particles, have been extensively utilized in the research of water and wastewater remediation because of their well-known merits (e.g. unique size, superparamagnetism, and ease of removal from liquid environments with an external magnet) (6). To date, these nanoparticles have been modified with different biomaterials viz alginate (7), chitosan (8, 9), cellulose (1), and biomass (10) to increase their efficiency.
Nowadays, researchers have investigated the adsorption of toxic metals by aforementioned biomaterials in liquid environments. For instance, Tolba et al. explored the process of removing Lanthanum from synthetic solutions by poly(carboxymethyl)-cellulose (11). Dong and colleagues determined the Cr(VI) separation potential from liquid environments by adsorption on stabilized nZVI/biochar composite (12). Chitosan (CS) is one of the most natural polymers on earth (second in amount). It has many attractive features i.e. nontoxicity, hydrophilicity, cost-effectiveness, recyclability, biodegradability, polyelectrolyte properties, and good adsorption performance for various pollutants. These high-performance results are related to its surface adsorptive sites, including hydroxyl (-OH) and amino (-NH2) (13-15). It has high tendency to adsorb pharmaceuticals, dyes, pesticides, heavy metals, and other hazardous pollutants. In addition to increasing the adsorption capacity, other important benefits for impregnating nZVI with chitosan (CS@nZVI), can be pointed to increasing in the mechanical strength, thermal resistance, and regeneration ability of chitosan compared to its raw state (16, 17). The CS or other polymers have largely resolved their aggregation problems in liquids (16).
2. Objectives
The aim of this study was to find suitable functional relationships between the response (Lanthanum removal efficiency) and operational parameters. Also, to develop empirical model equations using Solver in Excel. Additionally, to identify the behavior of adsorption reaction using isotherm models of kinetic equations and thermodynamic parameters.
3. Methods
3.1. Employed Chemicals and Reagents
Chitosan (Molecular Weight 105 g/mol, CAS Number: 9012-76-4) and LaCl3 salt were supplied from Sigma-Aldrich Co. (Germany). Appendix 1 in Supplementary File presents the chemical structure and characteristics of the utilized CS. The reagents used to prepare the nZVI-chitosan hybrid nanoparticles, FeCl3·6H2O, NaBH4, ethanol, and acetic acid (CH3CO2H, ≥ 99%) were provided by Merck Co. (Germany). Solution pH was adjusted to the needed values by HCl (0.1 M, 35% - 37%) or NaOH, (0.1 M, 93%) during the experiments.
3.2. Synthesis of Nano-Composites
The CS@nZVI nanocomposite was prepared in the laboratory using the liquid-phase reduction method (reducing ferrous ions to Fe0 using NaBH4), based on previous studies (16) as the following steps. In the first step, 0.25 g of CS was dissolved in 50 mL acetic acid (0.05 M) because of the poor solubility of chitosan, complete dissolution was achieved at 150 rpm by 4 h mixture overtaxing. In the second step, 1 g of FeCl3.7H2O was poured into the mixture and agitated quickly with stirring for 2 h under N2-purged atmosphere. Then, sodium borohydride solution (2%) was added to this mixture drop-wise. At the end of the stage, nanocomposite was successfully formed. In order to entirely reduce metal salts, the suspension was stirred for 60 min once again. Finally, the obtained particulates were collected by a magnet (1.3 T), and rinsed with deionized water and ethanol. After that, the produced powder was dried under vacuum conditions (at 100ºC for 4 h).
3.3. Employed Instruments
Target metal ions’ concentrations were analyzed by ICP-AES (ARCOS FHE12, model). A pH meter model WTW inoLab pH 720 was utilized for pH measurements. Solutions were mixed using a magnetic mixer (Sartorius, model PT 210). The agitation of samples were performed by orbital shaker (Heidolph, Rotamax 120 model). The adsorbent weights were observed by an electronic weighing balance (Sartorius, BL 210 S model). The surface textural and the microstructure of the adsorbents were inspected using an SEM image in a JSM-7100FA. A Technai G2 30ST- FEI transmission electron microscope (TEM) was used to observe a detailed structure of fabricated CS@nZVI nanocomposites. In addition, FTIR spectra of CS@nZVI samples were recorded on a Bruke EQUINOX 55 fourier transform infrared spectrophotometer (Germany) within the 450-4500 cm-1 range. Specific areas and average pore size of the nZVI and CS@nZVI nanocomposites were determined by N2 adsorption analysis (Micromeritics Instrument Crop., GA) using N2 adsorption-desorption isotherms. The XRD patterns of synthesized nanocomposites were collected using a NOVA, 2000 equipped with Cu Kα as radiation source (1.54056 Aº). The electric current and generator voltage were 40 mA and 40 kV, respectively.
3.4. Lanthanum Adsorption Kinetic and Isotherm Studies
The adsorption kinetic studies were conducted in batch mode at three La (III) concentrations (40, 160, and 300 mg/L) under the optimum conditions achieved by our optimization investigations (CS@nZVI dosage = 1.2 g/L, pH= 8). The shaking times for each concentration were 5, 30, 60, 100, 150 and 200 min, respectively. Moreover, in this context, three isotherm equations viz Langmuir (Equations 1 Freundlich (Equation 3), and Temkin (Equation 4) were considered to describe the experimental results and better understand the mechanism of La (III) ions sorption onto the CS@nZVI nanocomposites (18, 19), which their linear equations are given here:
Here, qm and ce represent the theoretical max uptake of CS@nZVI (mg/g) and equilibrium conc. (mg/L), respectively; b is the isotherm model constant concerned with the tendency of adsorbent functional groups (L/mg); qe is the quantity of La (III) adsorbed onto the CS@nZVI surface (mg/g) (Equation 1). c0 is attributed to the La (III) concentration in the initial samples (mg/L).
The adsorption kinetic study was conducted to employ general kinetic models (pseudo-first-order (PFO) together with pseudo-second-order (PSO)) to express the reaction of the liquid (metal ions)/solid (CS@nZVI NCs) phase. The Morris-Weber intraparticle diffusion (MWIPD) kinetic model also is employed to explore the adsorption energy and the diffusion mechanism. The liner formulas for the investigated kinetic models are summarized below:
Here, qt together with qe are the quantity of adsorbed La (III) on the CS@nZVI surface at time t (min) (mg/g) and adsorption equilibrium (mg/g), respectively. Moreover, k1 along with k2 are related to adsorptive rate constant for PFO (1/min) (Equation 5) and PSO (g/mg.min) (Equation 6) models, respectively. kd is MWID rate constant (mg/g) (Equation 7) (18, 19).
3.5. Central-Composite Experimental Design Based on RSM
The composition effects of operating (effective) parameters e.g., initial Lanthanum con. (x1), pH values (x2), adsorption period (x3), adsorbent quantity (x4), and a response parameter (Lanthanum uptake efficiency (
Here, b0 represents the intercept of the model; bi, bii, and bij are related to the regression coefficients and represent firs-order, second-order, and composition impacts, respectively; Xi and Xj are related to operating parameters. Moreover, C attributed to the error of prediction (24). To achieve the optimum values of investigated parameters, Solver in Excel was utilized. Subsequently, the model equation was written (21).
4. Results and Discussion
4.1. Characterization of Nano-Composites
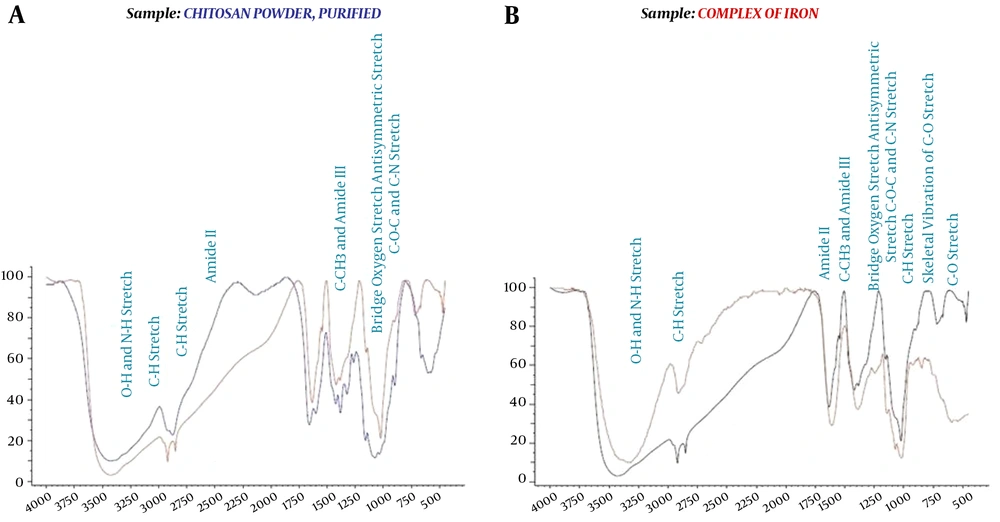
The physicochemical properties of the prepared CS@nZVI composites were obtained through FTIR, BET, XRD, SEM, and TEM techniques. The FTIR spectrums of CS, and CS@nZVI are depicted in Figure 1. Also, the main bands in the IR spectrums of pristine chitosan and CS@nZVI and its related functional groups were prepared in Appendix 3 in Supplementary File (25). According to the Appendix 3 in Supplementary File and Figure 1, it was observed that chitosan and CS@nZVI nanocomposite had a strong and broadband in 3430 and 3314 related to O-H and N-H stretch functional group, respectively. Also, in the spectrum of 1070 and 1015, CS@nZVI nanocomposite has a middle strong band attributed to C-O stretch functional group that indicates oxygen atom binding on sites of nZVI. These results are consistent with previous results of CS, and CS@nZVI in the literature (16).
Porosity, and BET surface area of CS@nZVI nanocomposites were studied by N2-sorption isotherm as shown in Appendix 10 in Supplementary File. The BET surface area was 86.4 m2/g. In addition, pore sizes were 10 - 80 nm. The results indicated that the values of these parameters for CS@nZVI significantly decreased in comparison to pure chitosan. The reason for this decrease in values was the partial blockading of pore mouths located on the mesoprous surface of chitosan. The impregnation of nZVI nanoparticles by the functionalized chitosan was clearly verified (16).
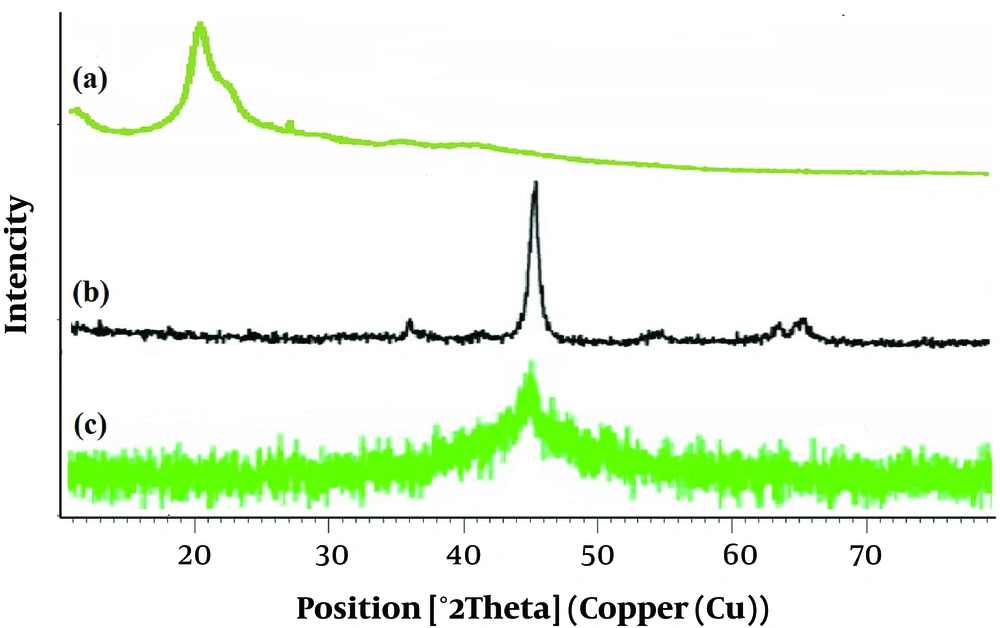
The XRD pattern of the pristine chitosan, bare iron, and final/produced nanocomposite are depicted in Figure 2, respectively. The diffract gram of CS@nZVI exhibits a sharp peak at 44.85º and indicates a constant zero valence state of CS-Fe0. It also represents crystalline structure of Fe0 (-Fe) in CS@nZVI. In the XRD spectra of CS@nZVI, diffraction peaks for chitosan became small width and were not detected, which can be due to their amorphous nature, and their low concentration (25, 26). They found that the Fe0 particles in the preparing process were successfully loaded on CS and this process might lead to the chitosan-mediated protection of Fe0 particles from air oxidation (16, 25). In previously published articles, similar results were reported (26).
The morphology and further texture properties of bare nZVI and CS@nZVI were investigated by SEM. The SEM schemes of the nZVI and CS@nZVI are depicted in Figure 3. The images demonstrated that the bare nZVI nanoparticles were chain-like aggregations, whereas the CS@nZVI due to the existence of chitosan, represented a notably higher dispersion (27).
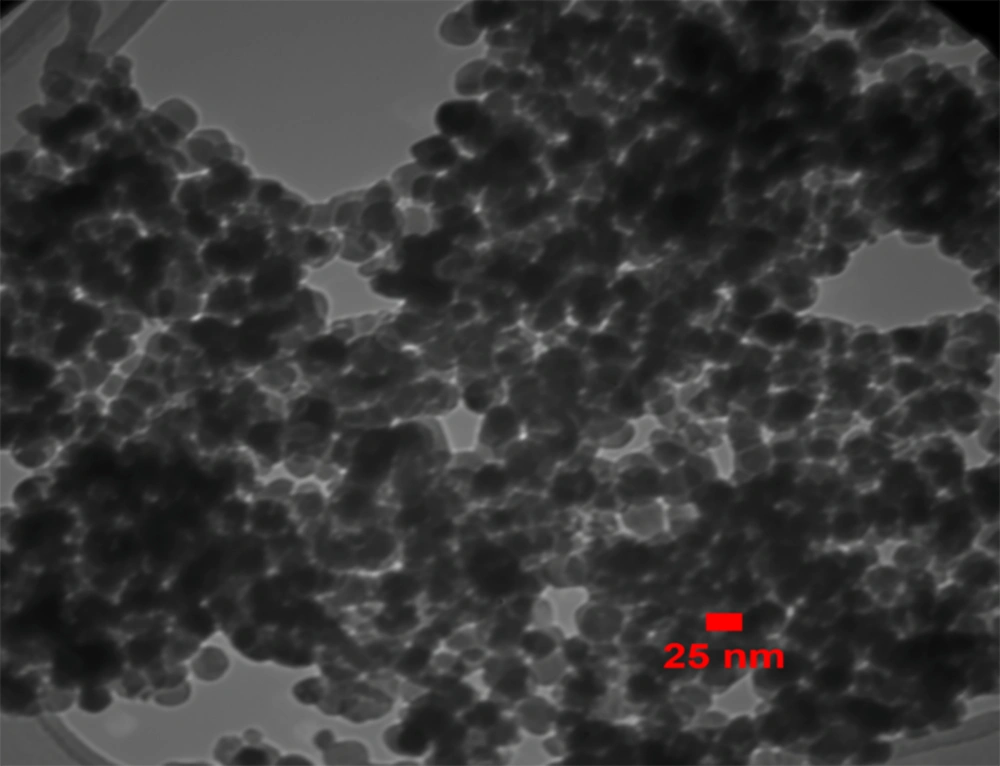
The lattice textures and morphology of the fabricated CS@nZVI were identified and affirmed by TEM. Figure 4 Shows TEM image of CS@nZVI, which clearly revealed the uniformity and high crystallization synthesized NCs with a smooth surface. This results were consistent with the SEM results.
4.2. Outputs of RSM Models
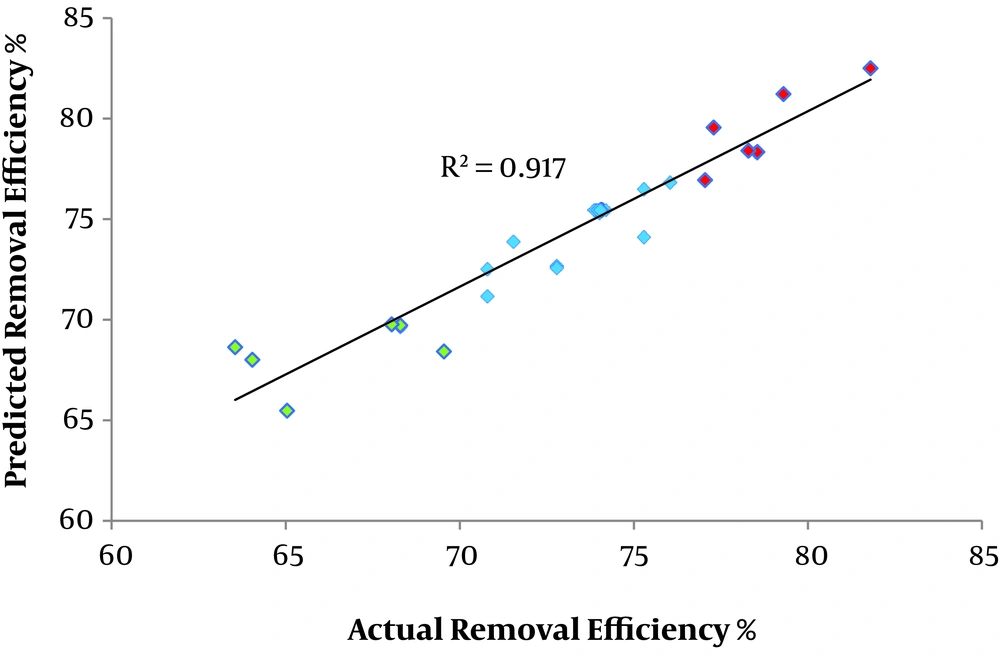
The 44 CCD runs are shown in Appendix 3 in Supplementary File. Particular information (P value, lack of fit, F-static, and R-squared (multiple and adjusted) was used to specify the response-surface portion of each model (21). The outputs of the models are presented in Appendix 4 in Supplementary File. Checking the lack of fit value was carried out for all studied models and its insignificancy was observed for all models, but a higher value was seen for the reduced model (22, 28). According to the comparison of models’ outputs, the reduced model was gorgeous well-fitted model. The chosen/well-fitted model should have the greatest F-value, smallest P value, highest R2, and smallest lack of fit. So, the insignificant factors (including; x1, x2 interaction, x1, x3 interaction, x1, x4 interaction, x2, x3 interaction, x2, x4 interaction, x3, x4 interaction, x12, and x42) are abandoned, and the best model was achieved. An ANOVA was applied to assess model adequacy (20, 24, 29). As presented in Appendix 5 in Supplementary File, four terms (R2, P value, lack of fit, and F-value) were applied to appraise the adequacy of the model (21). The P and F-values are ascribed to the significance of the model’s terms and the most significant influences of them, respectively. The results of these computations (F-value, 85.93 on 6 and 37 DF; P value, 0.03; lack of fit, > 0.05; and R2, 0.93) indicated that the reduced model fits well for La (III) removal by CS@nZVI. This model also provided good congruence between the actual data (30) and predicted values with high R2 (equal to 0.917), as represented in Figure 5.
In addition, for a powerful model, the related correlation coefficients (R-adjusted and multiple) should be close to each other; otherwise, non-important parameters can be present in the model and damage the validity of the model (20, 29). In our outputs, given the proximity of these two values to each other (0.933 and 0.922, respectively), we can use the model for further studies like optimization. Regression analysis outputs on the reduced model are given in Appendix 6 in Supplementary File. Accordingly, a list of independent variables with significant effects (x1, x2, x3, x4, x22, and x32) on the removal performance was present in the model. Of note, x1, and quadratics of x2, and x3 have a negative influence on the model’ output since x2, x3, and x4 have positive influence on the model’ output. Also, based on the coefficients analysis, x4, and x2 were the most significant parameters influencing the selected responses; as reported previously by Kumar Gupta et al. (31). The obtained model equation is given in Equation 9.
4.3. Optimization of Adsorption Condition
We used Solver in Excel to achieve the optimum values of investigated parameters in the model provided by RSM. For data collection, the stationary points in original units were estimated to be 5, 8, 178, and 1.2 for x1 (mg/L), x2, x3 (min), and x4 (g/L), respectively. The uncoded regression coefficients were put into the Solver software after designating the parameters as x1 (5 - 300 mg/L), x2 (2 - 10), x3 (5 - 200 min), and x4 (0.01 - 1.5 g/L). Validation of the predicted optimum conditions was done using laboratory experiments involving all parameters simultaneously. Under aforementioned provisions, the optimum value for R% La (III) was predicted as 87.18%. Also, the inspection of the obtained data indicated a consistency between the outcomes of experiments and the model prediction (reproducibility), with a maximum La (III) removal under experimental and theoretical conditions of 86% and 87.18%, respectively, with a bias of lower than 2%.
4.4. Adsorption Equilibrium Investigations
The closeness of the correlation coefficient values (R2) of aforementioned equations (section 3.4.), were employed to obtain an appropriate model. The related constants for isotherm models are given in Table 1. Based on the Temkin isotherm, the adsorption energy of adsorbed metal ions in an adsorbent layer reduces linearly with surface coverage because of occurred interactions between pollutant and adsorbent (21, 32).
| Variable | Value |
|---|---|
| Lang. | |
| R2 | 0.984 |
| qm, mg/g | 344.8 |
| RL | 0.989 |
| b, L/mg | 0.00003 |
| Freun. | |
| R2 | 0.938 |
| Kf | 47.6 |
| N | 1.34 |
| 1/n | 0.74 |
| Tem. | |
| R2 | 0.926 |
| b1 | 152 |
| kt, L/mg | 1.41 |
In the comparison of correlation coefficient values (R2), the Langmuir isotherm gave the most satisfactory fit for La (III) removal. So it was concluded that the complete monolayer sorption condition exists throughout the process and the adsorption of each ion to a given site had equal adsorption activation energy (12). Because the value of n exceeds unity, the adsorption of La (III) ions onto CS@nZVI should be considered a physical adsorption process. Also, a value of 1/n (equal to 0.74) in the permissible range (0.1 < n < 1), indicates a “favorable” adsorption process for La (III) onto CS@nZVI (33). As the equilibrium parameter, RL (equal to 0.98) authenticates this fact. The maximum adsorption capacity (qm) of CS@nZVI for La (III) with the minimum energy expense (0.00003 L/mg) was 344.8 mg/g, which indicated that the CS@nZVI can be used as a potential sorbent to the recycle of La (III) and other rare-earth elements due to its high porosity. The comparison of Langmuir adsorption capacity (qm) of CS@nZVI for La (III) removal with the other sorbents are displayed in Table 2.
| Material | qm | Related Reference |
|---|---|---|
| Cellulose | 38.4 | (11) |
| Iron oxide loaded Ca-alginate beads | 138.9 | (34) |
| Poly (carboxymethyl)-cellulose [PCMC] | 170.2 | (11) |
| Active carbon from fly ash | 175.4 | (35) |
| Bamboo charcoal | 215 | (36) |
| Magnetic alginate beads | 250.02 | (7) |
| Carboxymethyl cellulose based open cellular hydrogel adsorbent | 384.6 | (37) |
| Chitosan-imprinted nano zero-valent iron (CS@nZVI Nanocomposite) | 344.82 | This work |
4.5. Uptake Kinetics Studies
In this research, a higher correlation coefficient (R2) value in addition to the level of consistency between the laboratory accessed qe (qe) and calculated qe values (qe, cal) were assessed to select the best model. As seen in Appendix 8 in Supplementary File, comparing the two qe values indicated that the experimentally observed qe values were in good agreement with the predicted qe values for the PSO model but not for the PFO model. The congruence between those two parameters supported by high R2 values implies that the kinetic of the present process/mechanism/reaction (between La (III) ions and CS@nZVI) was best followed by PSO model.
In other studies (10), analogue findings were pointed out. It exhibits the chemisorption nature of involved adsorption mechanism, which take placed during this reaction. All these imply that CS@nZVI with its good performance for Lanthanum separation provide a promising and feasible method in order to treatment of La (III) and other rare earth-contaminated streams.
4.6. Thermodynamic Properties
The nature of the adsorption process/mechanism could be analyzed based on the thermodynamic values. In the present study, the van’t Hoff equation (Equation 10) is used to investigate adsorption equilibrium constant, then the conventional thermodynamic equation (Equations 11-13) is employed to calculate thermodynamic constants of CS@nZVI (ΔGº, ΔΗº, and ΔSº) (38).
In the above equation, qe and Ce are related to the quantity of pollutants adsorbed onto the composite surface (mg/g) and the pollutant conc. (mg/L) at equilibrium, respectively.
Here, R is gas constant (= 8.314 J/mol. K), T is temperature in Kelvin. Also, ΔGº is Gibbs free energy change of system (kJ/mol), ΔHº is enthalpy change of process (kJ/mol) and ΔSº is entropy change of reaction (J/mol. K). In our study, at first KD and attributed ΔGº at different temperatures was determined, as shown in Appendix 7 in Supplementary File; then the ΔHº of the process and the ΔSº value of the reaction are determined by slope and intercept of ln KD vs. 1/T plot, respectively.
The positivity of ΔHº together with negativity of ΔGº and the positivity value of ΔHº proved that the adsorption of La (III) onto the CS@nZVI have a spontaneous and endothermic nature (1). The free energy is reduced with increasing temperature and resulted in increasing the spontaneity of the reaction. The positive value of entropy further indicated a consequently increases randomness as a result of La (III) adsorption on the surface of CS@nZVI (38).
4.7. Conclusions
In this research, CS imprinted nZVI (CS@nZVI) nanocomposite was prepared and examined for its ability to remove noxious Lanthanum (III) from aqueous solution. The composition effects of operating parameters and La (III) removal efficiency were investigated using RSM with R software. Statistically significant, well-fitting quadratic regression models were successfully developed and confirmed statistically. According to the modeling results, adsorbent dosage and pH were the most significant parameters influencing the selected responses. Under optimum conditions (x1 = 5 mg/L, x2 = 8, x3 = 180 min, and x4 = 1.2 g/L) the remarkable value for La (III) Removal % was achieved (86%). A monolayer adsorption capacity (qm) of 344.83 mg/g was determined with a better fit for La (III) adsorption found using the Langmuir model. Also, it was predicted statistically that among the three applied kinetic models, the pseudo-second-order model is optimum in describing the rate equation of the adsorption process. The results (obtained from isotherm and kinetic studies) showed that multiple mechanisms are involved in La (III) separation process. The values of thermodynamic parameters (ΔΗº, ΔGº, ΔSº) indicated the natural spontaneity and feasibility of La (III) adsorption onto CS@nZVI composite. High capacity of CS@nZVI composite implies its potential application for the real-scale treatment systems.


