


1. Background
Portal hypertension is a major complication of cirrhosis (1, 2). Esophageal varices is one of the most serious complications of portal hypertension. There is a high risk of esophageal varices bleeding, which a serious threat to the health of patients.
Hepatic venous pressure gradient (HVPG) is the international golden standard for evaluating portal vein pressure (3). In addition, it has been used as a prognostic marker of portal hypertension, particularly for the occurrence of bleeding from gastroesophageal varices (4-6). The risk of variceal bleeding depends on the degree of portal pressure. Patients with an HVPG below 10 - 12 mmHg rarely experience bleeding (7). Some studies reported that reducing the HVPG to below 12 mmHg or by ≥ 20% from baseline after treatment with the nonselective β-blocker (NSBB) is associated with declined risk of both bleeding and mortality (8, 9).
NSBB can decrease portal pressure, and a number of diagnoses and therapeutic guidelines recommended this technique as the first-line therapy for the prevention of gastroesophageal varices hemorrhage in cirrhosis (3). However, in up to 60% of patients, propranolol treatment does not result in reduced HVPG, which increases the risk of rebleeding (4, 10, 11). As a result, providers prefer other pharmacological treatments. Carvedilol is a nonselective β-blocker with intrinsic anti-α1-adrenergic activity. The effect of carvedilol on lowering portal pressure is influenced by β1, β2, and a1-blockade. Β1-blockade reduces cardiac output, β2-blockade elicits splanchnic vasoconstriction, and a1-blockade reducts intrahepatic resistance (12). Banares et al. (13) reported that chronic carvedilol administration resulted in a hemodynamic response rate of 58% (number of responders to the total patients who receive drug treatment) compared to a 23% response rate in the propranolol group. Our literature review revealed that no study has evaluated the impact of the HVPG baseline on the response rate of carvedilol treatment.
2. Obectives
Hence, the present study intended to assess the association between HVPG baseline and the response rate of cirrhotic patients who received carvedilol treatment.
3. Methods
3.1. Selection of Patients
In this retrospective follow-up study, conducted from July 2011 to October 2014, 48 patients with cirrhotic portal hypertension who had an episode of esophageal and gastric varices bleeding were studied. All participants received at least 2 HVPG measurements. Esophageal and gastric varices bleeding was confirmed by endoscopy. Endoscopy showed signs of recent bleeding such as white nipple coating or blood clots on gastric varices in 29 (out of 48) patients. Besides, the presence of distinct and large esophageal gastric varices, as the source of the bleeding, was confirmed in 19 patients.
After initial HVPG measurement, all patients received carvedilol treatment. Initially, 12.5 mg oral carvedilol was administered daily. A second hemodynamic study was conducted 7 days later to assess response. Patients whose HVPG was reduced by more than 20% (or to less than 12 mmHg) were defined as responders. For all patients, bleeding was well controlled after drug therapy. Since our patients had a history of bleeding, all of them received EVL treatment following the secondary HVPG measurement. Demographic and clinical information of participants were collected. This study was approved by the local ethics committee, and informed written consent was obtained from all patients.
Patients with clinical and endoscopic signs of portal hypertension were evaluated for inclusion. Inclusion criteria were as follows: (1) Being aged 18 to 75 years; (2) A baseline HVPG of ≥ 12mmHg; (3) Having a history of esophageal and gastric varices bleeding during the past 6 months; (4) Signing the HVPG consent and NSBB clinical trial informed consent.
Exclusion criteria were (1) Being younger than 18 years or older than 75 years; (2) Child–Pugh score of > 12; (3) Hepatorenal syndrome or serum–creatinine of > 2.26 g/dL; (4) Receiving splenectomy, PSE, or EVL; (5) History of NSBB treatment; (6) NSBB contraindications; (7) treatment with blood transfusion or vasoactive drugs during the week before inclusion; (8) Suffering from major portal vein thrombosis; and (9) Malignancy or life expectancy less than 3 months.
3.2. Hemodynamic Investigations
Hemodynamic examinations were performed after an overnight fast. HVPG was measured by the methodology described by Groszmann and Wong Charatrawee (14) and Bosch et al. (15). A catheter was inserted percutaneously into the right hepatic vein through the femoral or jugular veins, and the pressure in both free and wedged positions was recorded with a 5-F balloon-tipped catheter. Standard criteria were applied to confirm an adequate wedging of the portal vein (14, 15). The HVPG was determined by subtracting the free hepatic venous pressure (FHVP) from the wedged hepatic venous pressure (WHVP). All measurements were repeated in triplicate, and their mean value was considered in each case. If the difference between the readings was greater than 1 mm Hg, a new reading was recorded.
3.3. Follow Up
After performing procedures, all participants were followed up at regular intervals of 1, 3, and 6 months, and then every 6 - 12 months. For each patient, a brief physical examination and medical history recording were performed, including estimation of ascites and HE.
3.4. Statistical Analysis
Continuous variables were reported as means ± SD or percentages. For variables that were normally distributed, the t-test was used for comparing groups. Nonparametric tests were used for variables that did not follow a normal distribution. Categorical data were compared using the χ2 test. The rebleeding rate and survival rate were examined by Kaplan-Meier estimation. The log-rank test was used to compare the differences between each curve. Cox analysis was employed to identify independent prognostic indicators for rebleeding and death. A two-sided P-value of < 0.05 was considered statistically significant. Data were analyzed using SPSS version 17.0 (SPSS Inc., Chicago, IL, USA).
4. Results
4.1. The Predictive Value of Baseline HVPG for Drug Response
The ROC curve was used for predicting carvedilol drug response, and the area under the ROC curve (AUROC) of the HVPG baseline was 0.715 (95% CI: 0.571 - 0.859, P = 0.012) (Figure 1), which suggests that HVPG baseline can predict the responsiveness of carvedilol treatment, and the relatively optimized cut-off value of the HVPG baseline ranged from 15.75 to 16.50 mmHg.

ROC curve of HVPG baseline for predicting carvedilol treatment response rate
4.2. Baseline Characteristics of Patients
As mentioned before, 48 patients were investigated in the present study, which their characteristics are provided in Table 1. Since the cut-off value ranged from 15.75 to 16.50 mmHg, we choose 16 mmHg as the cut-off value. We divided the patients into two groups according to their HVPG baseline [HVPG < 16 mmHg group (n = 28) and HVPG ≥ 16 mmHg group (n = 20)]. There were no significant differences between the two groups concerning baseline characteristics.
| Overal (N = 48) | HVPG Baseline <16 mmHg | HVPG Baseline ≥ 16 mmHg | |
|---|---|---|---|
| Age (y) | 51.02 ± 10.84 | 50.57 ± 10.33 | 51.65 ± 11.76 |
| Gender | |||
| Male | 37 (77.1) | 21 (75.0) | 16 (80.0) |
| Female | 11 (22.9) | 7 (25.0) | 4 (20) |
| Etiology | |||
| HBV | 38 (79.2) | 21 (75.0) | 17 (85.0) |
| Alcohol | 4 (8.3) | 3 (10.7) | 1 (5.0) |
| Others | 6 (12.5) | 4 (14.3) | 2 (10.0) |
| TBIL (mg/L) | 32.51±25.74 | 29.71±27.18 | 36.42±23.70 |
| ALT (IU/L) | 60.35±100.82 | 55.89±93.82 | 66.60±112.10 |
| AST (IU/L) | 54.17±61.85 | 43.29±22.20 | 49.40±91.34 |
| ALB (g/L) | 33.21±10.85 | 33.11±12.15 | 33.35±9.02 |
| Child-Pugh classification | |||
| A | 24 (50.0) | 14 (50.0) | 10 (50.0) |
| B | 17 (35.4) | 10 (35.7) | 7 (35.0) |
| C | 7 (14.6) | 4 (14.3) | 3 (15.0) |
| Time interval between bleeding episode to 1st HVPG measurement (weeks) | 13.54 ± 5.58 | 14.43 ± 5.42 | 12.30 ± 5.71 |
| Ascites | |||
| Yes | 24 (50.0) | 12 (42.9) | 12 (60.0) |
| No | 24 (50.0) | 16 (57.1) | 8 (40.0) |
Baseline Characteristics of all Patients z
4.3. The Difference of HVPG Decreasing Effect and Response Rate Between Different HVPG Baseline Groups
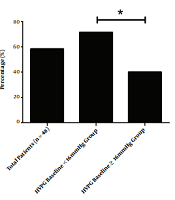
At the end of the treatment period, the mean HVPG for the total population of 16.04 ± 3.10mmHg decreased to 12.76 ± 5.26 mmHg (decreased by 21.47 ± 25.02%), which was statistically significant (P < 0.001). The response rate was about 58.33% (28/48). In the HVPG < 16 mmHg group, the HVPG decreased significantly from 13.98 ± 1.22 to 10.31 ± 3.50 mmHg (decreased by 26.21 ± 24.37%; P < 0.001), the response rate was about 71.4% (20/28). In the HVPG ≥ 16 mmHg group, the HVPG also decreased significantly from 18.93 ± 2.58 to 16.18 ± 5.46 mmHg (decreased by 14.82 ± 25.00%; P < 0.001), the response rate was about 40.0% (8/20). The findings reveal that HVPG decreased more significantly in the HVPG < 16 mmHg group than in the HVPG ≥ 16 mmHg group (P = 0.029), the response rate of the HVPG < 16 mmHg group was significantly higher than that of the HVPG ≥ 16 mmHg group (P = 0.030) (Figures 2 and 3).
.")
Mean decrease in HVPG after carvedilol treatment under different baseline (*P < 0.05, **P < 0.01).
.")
Response rate of carvedilol treatment according to different HVPG baseline groups (*P < 0.05).
4.4. The Difference of HVPG Baseline Between Responders and Non-responders
In the present study, all 48 patients were categorized into two groups according to their responsiveness (named as responders group and non-responders group). We compared the HVPG baseline of the two groups. We found that the HVPG baseline of the responders group was lower than that of the non-responders group (14.88 ± 2.98 mmHg vs. 16.92 ± 2.15 mmHg, respectively), with statistical significance (P = 0.042).
4.5. The Effect of Other Relevant Factors on Responsiveness
The clinical characteristics of participants, separated by their group, are provided in Table 2. There was no significant difference between the two groups concerning the following factors.
| Variable | Responder Group (N = 28) | Non-Responder Group (N = 20) | P Value |
|---|---|---|---|
| Age (y) | 51.79 ± 10.35 | 49.95 ± 11.69 | 0.441a |
| Gender | 23/5 | 14/6 | 0.488c |
| Male | 23 | 14 | |
| Female | 5 | 6 | |
| Etiology | 0.241d | ||
| Virus | 21 | 17 | |
| Alcohol | 4 | 0 | |
| Others | 3 | 3 | |
| TBIL (mg/dL) | 34.21 ± 29.11 | 30.12 ± 20.61 | 0.834b |
| ALT (IU/L) | 64.18 ± 94.97 | 55.00 ± 110.80 | 0.267b |
| AST (IU/L) | 50.93 ± 29.52 | 58.70 ± 90.49 | 0.579b |
| ALB (g/L) | 34.03 ± 9.87 | 32.05 ± 12.26 | 0.508a |
| BUN (mmol/L) | 5.33 ± 2.21 | 5.64 ± 2.36 | 0.741a |
| SCr (μmol/L) | 77.38 ± 21.48 | 75.24 ± 18.22 | 0.304a |
| Child-Pugh classification | 0.232c | ||
| A | 12 | 12 | |
| B | 11 | 6 | |
| C | 5 | 2 | |
| Ascites | 1.000c | ||
| Yes | 14 | 10 | |
| No | 14 | 10 |
Comparison of Baseline Characteristics and Hemodynamic Features between Initial Hemodynamic Responders and Nonresponders to Drug Therapy
4.6. Follow-Up Outcomes
All patients were followed up for a median of 26 months, ranging from 6 to 33 months. Among them, six were excluded, including two who were lost to follow-up, two who were due to drug intolerance, and two with poor compliance. Finally, 42 cases completed the clinical follow-up, that 10 (23.81%) experienced rebleeding, 7 (16.67%) died of gastrointestinal tract bleeding, and one (2.38%) died of hepatic failure. The outcomes of all participants, separated by HVPG baseline and hemodynamic response grouping, are provided in Table 3.
| HVPG Baseline | Hemodynamic Response | ||||
|---|---|---|---|---|---|
| All Patient Completed Follow-up (N = 42) | < 16 mmHg (N = 23) | ≥ 16 mmHg (N = 19) | Responders (N = 23) | Non-responders (N = 19) | |
| Rebleeding | 10 | 2 | 8 | 3 | 7 |
| Mortality | 8 | 2 | 6 | 3 | 5 |
Overall Rebleeding and Mortality During the Whole Follow-Up Period a
Figure 4 shows the rates of rebleeding and death in HVPG < 16 and HVPG ≥ 16mmHg groups, calculated using the Kaplan-Meier method. The rebleeding rate (at 2 years) was 9.97% (2/23) and 49.56% (8/18), respectively, the difference was statistically significant (Kaplan-Meier values, P = 0.004; OR, 8.352; Figure 4A). The mortality rate (at 2 years) was 5.26% (2/23) and 21.05% (6/19), respectively, the difference was also statistically significant (Kaplan-Meier values, P = 0.035; OR, 4.448; Figure 4B).
 than in HVPG ≥ 16 mmHg group (dotted line) (P = 0.004, log-rank test). B, Graph shows that cumulative survival rate is significantly higher in HVPG < 16 mmHg group (solid line) than in HVPG ≥ 16 mmHg group (dotted line) (P = 0.035, log-rank test).")
Cumulative non-rebleeding rate and survival rate in HVPG < 16 mmHg group and HVPG ≥ 16 mmHg group during the follow-up. A, Graph shows that cumulative non-rebleeding rate is significantly higher in HVPG < 16 mmHg group (solid line) than in HVPG ≥ 16 mmHg group (dotted line) (P = 0.004, log-rank test). B, Graph shows that cumulative survival rate is significantly higher in HVPG < 16 mmHg group (solid line) than in HVPG ≥ 16 mmHg group (dotted line) (P = 0.035, log-rank test).
Figure 5 shows the rates of rebleeding and death in responders and non-responders groups, calculated using the Kaplan-Meier method. The rebleeding rate (at 2 years) was 14.44% (3/22) and 42.58% (7/19), respectively; however, the difference was not statistically significant (Kaplan-Meier values, P = 0.050; OR, 3.830; Figure 5A). The mortality rate (at 2 years) was 13.04% (3/23) and 31.90% (5/19), respectively, the difference was not statistical significant (Kaplan-Meier values, P = 0.195; OR, 1.683; Figure 5B).
 and in non-responders group (dotted line) with no significant difference (P = 0.050, log-rank test). B, Graph shows the cumulative survival rate in the responders group (solid line) and in the non-rebleeding group (dotted line) with no significant difference (P = 0.195, log-rank test).")
Cumulative non-rebleeding rate and survival rate in responders group and non-responders group during the follow-up. A, Graph shows the cumulative non-rebleeding rate in responders group (solid line) and in non-responders group (dotted line) with no significant difference (P = 0.050, log-rank test). B, Graph shows the cumulative survival rate in the responders group (solid line) and in the non-rebleeding group (dotted line) with no significant difference (P = 0.195, log-rank test).
A Cox’s proportional hazards regression model was performed for other factors that might influence the rebleeding and survival rates after the treatment (gender, age, etiology, Child-Pugh classification, the severity of varices, ascites, and laboratory data). No risk factor was found for either rebleeding or death.
5. Discussion
This study demonstrated that the mean HVPG for the total population decreased significantly following carvedilol treatment, which confirms the effectiveness of carvedilol in reducing portal vein pressure. This finding is consistent with previous studies. Our study was focused on patients with bleeding histories, which also provided information for carvedilol’s usage in secondary prophylaxis of gastroesophageal varices hemorrhage.
The impact of the HVPG baseline on the responsiveness of carvedilol treatment was not reported. The findings revealed that HVPG decreased more significantly in the HVPG < 16 mmHg group, while the response rate was also significantly higher. These findings suggest that carvedilol is more effective in mild and moderate portal hypertension patients (HVPG baseline < 16 mmHg) for lowing portal pressure. The results are consistent with the Baveno V consensus, which proposed that patients with small varices with red wale marks or Child C class should be treated with nonselective beta-blockers (NSBB) (5). While for severe portal hypertension patients, the response rate was rather lower, which suggests the necessity of using NSBB in combination with other drugs or with endoscopic or interval therapy.
NSBB, such as propranolol and nadolol, which are the mainstay of pharmacologic therapy (16-18), can achieve this goal in 20 - 30% of patients. However, it causes an increase in portocollateral and intrahepatic resistance, which may hinder the reduction in portal pressure induced by the decreased inflow of portal venous (19, 20). Carvedilol is a nonselective β-blocker with intrinsic anti-α1-adrenergic properties, as such, its effect mimics those of the combination therapy using propranolol and prazosin. It’s now generally considered as a promising alternative that needs further investigation (5). In our study, we used a dose of 12.5 mg/day carvedilol in accordance with the studies by Tripathi D (21), our results also support the hypothesis that the dose is effective.
As we all know, the only way to determine the efficacy of NSBB is HVPG measurement, and there is no non-invasive way to replace it still (22-24), and the poor feasibility has been used as a reason against HVPG monitoring. Nevertheless, HVPG has been convincingly shown as a strong predictor of variceal bleeding and survival. Our study showed that the response rate is deeply influenced by the HVPG baseline, which may provide a theoretical base for guiding clinical medication.
In summary, patients with a HVPG baseline below 16mmHg are more likely to be responders than those with a HVPG baseline above 16mmHg. Carvedilol is effective in reducing HVPG, patients with portal hypertension may benefit from treatment with carvedilol as add-on therapy with EVL, especially for those whose HVPG < 16 mmHg.
