


1. Context
Hepatitis B virus (HBV) infection is a major public health concern (1, 2). According to the World Health Organization, in 2015, the global prevalence of HBV was 3.5%, corresponding to 257 million carriers of the virus. Most of the patients were concentrated in Africa and Western Pacific regions, accounting for 68% of all cases (3). Without effective controls, the number of attributable deaths to HBV is expected to be 20 million for the period of 2015 - 2030 (4).
Serum indicators are widely using to accurately screen, diagnose, and treat HBV infected patients (5). According to the guidelines published by the Asian Pacific Association for the Study of the Liver (APASL), the testing serum indicators should include HBsAg, Anti-HBs, and total Anti-HBc. A positive HBsAg test indicates the current hepatitis B infection (6). An anti-HBs positive test (≧ 10 mIU/mL) indicates immunity against HBV (7). However, anti-HBc positive may indicate current or previous HBV infection (8, 9). Based on the testing results of hepatitis B seroprevalence, chronic HBV infection can be classified into different phases, which each has its particular treatment. Therefore, hepatitis B serology is very important for the diagnosis and treatment of HBV infection.
According to the literature, income, as a socio-economic variable, may be causally linked to health (10, 11). Besides, it is a risk factor for infectious diseases (i.e., HIV, diarrhea), and also it affects the development of non-infectious diseases (i.e., diabetes, diarrhea, asthma, and cardiovascular diseases) (12, 13). Not surprisingly, there are also evidence regarding the association between income inequality and hepatitis B seroprevalence. However, results regarding this issue are controversial. For example, Zhang et al. reported that low income is associated with an increased risk of HBsAg seroprevalence (OR: 1.23, 95%CI: 1.07 - 1.42) (14). Meanwhile, there are studies that reported no significant association between income inequality and HBsAg seroprevalence (OR: 0.89, 95%CI: 0.63 - 1.27) (15). Such mixed results might be attributed to the heterogeneity of studies.
2. Objectives
In this study, we tried to address the abovementioned gap in the literature. We aimed to investigate the association between income inequality and hepatitis B seroprevalence, defined as the prevalence of any hepatitis B seromarker. We hope our results be helpful for hepatitis B prevention.
3. Data Sources
In this meta-analysis, the preferred reporting items for systematic reviews and meta-analyzes (PRISMA) standards were used as the guideline. We searched PubMed and Web of Science databases for articles published up to February 10, 2020. The search strategies were as follows: in PubMed, ("Hepatitis B"[Mesh]) AND "Socioeconomic Factors"[Mesh]; in Web of Science, (TS = Hepatitis B) AND (TS = ("social status" OR socioeconomic OR socioeconomic OR inequality* OR income OR earning* OR wage*)). Four of the authors (XYS, YX, LY, and YZ) were divided into 2 pairs, and each pair screened all titles and abstracts. If either pair included the article, the full-text paper was obtained for further reviewing. References of all articles as well as published relevant reviews were also independently double-checked by the two pairs. In case of a disagreement, a consensus was reached through discussion.
4. Study Selection
We included quantitative studies on the association between income inequality and hepatitis B Sero-prevalence. Inclusion criteria were: (a) Chinese or English language; (b) assessing the income (either in currency or grade); (c) case-control design, and (d) reporting odds ratio (OR) and its corresponding 95% confidence intervals (CIs), or reporting sufficient data to calculate these indicators. Besides, there were no restrictions regarding the age of respondents in our literature search. Exclusion criteria were non-data-based studies, such as reviews. The previously published articles of the same study were also excluded; that is, only the most updated one was included. We also excluded the articles if the income assessment was based on ownership of car, house, health insurance and etc.
5. Data Extraction
For each eligible study, the following information were extracted by 2 of the authors (LY and YZ), including authors, publication year, country, study design, hepatitis B seromarkers, sample size, seropositive numbers, gender, age, income inequality type, and levels, statistical modeling, statistical parameters, OR and its 95%CIs.
Using the Newcastle-Ottawa Scale (16), quality assessments were independently performed by 2 reviewers (XYS and YX). Articles with 0 - 4 scores were considered to be of the lowest quality, and score ≥ 7 were considered to be of the highest quality. The discrepancies were resolved by discussion.
5.1. Exposure and Outcome
Income was considered as the exposure factor, which was grouped differently across studies. If the income is divided into 3 levels in the original text, then in this study, the two higher levels are combined into the "high income group", and the lowest level is the "low income group".; in original studies with 4 inequality groups, the 2 higher income levels were pooled as the reference group to compare with the 2 lower income levels.
Hepatitis B seroprevalence was considered as the outcome. All hepatitis B seromarkers reported in the literature were included in this meta-analysis. Although some literature reported multiple seromarkers without subdividing them separately, these markers were still included in our study and classified as a "mixed group" in the subgroup analysis.
5.2. Statistical Analysis
The multivariate-adjusted ORs were included if they were reported in the original literature; otherwise, the unadjusted ORs were calculated using the original data. The forest plots for the association between income and hepatitis B seroprevalence were generated for high-income level versus low-income level.
Heterogeneity was assessed using Cochrane’s Q test (17) and I2 statistic (18). Heterogeneity was present if the P-value of the Q test was < 0.1 or I2 > 50%. A fixed-effects model was performed when no statistically significant heterogeneity was observed; otherwise, a random-effects model was conducted for pooling ORs simultaneously. Meanwhile, subgroup analysis was performed to explore potential sources of heterogeneity, which was stratified by gender, region, marker, and quality score.
Egger's linear regression (19) and Begg's rank correlation (20) were used to assessing publication bias. The sensitivity analysis was also conducted using the leave-one-out approach to evaluate the influence of each study on the pooled estimate.
Statistical analyses were performed using STATA version 14.0 (STATA Corp, College Station, Texas).
6. Results
6.1. Literature Search and Study's Characteristics
The PRISMA flowchart of the literature screening is illustrated in Figure 1. The Searches of the 2 databases using the search strategy as well as hand-searching reference lists identified 1,525 potential articles. After screening the titles and abstracts, 1,499 articles were excluded as they were duplicated or irrelevant to our study aims. Full-text reports were obtained for 26 articles. Of these, 16 articles were excluded as 6 studies were against the inclusion of income type, 7 studies didn't have income factor, and 3 studies were not focused on the hepatitis B seromarkers. Thus, 10 studies (14, 15, 21-28) were included in this meta-analysis.

Flowchart of study selection.
The methodological “quality” of these 10 studies were assessed based on the Newcastle-Ottawa Scale. The scores range from 5 (the lowest) to 9 (the highest): 2 articles were 5 - 6 and 8 articles were > 7. None of them was ≤ 4.
The detailed characteristics of the included studies were shown in Table 1. A total of 10 studies assessed the association between income and HBsAg seroprevalence (N = 5), Anti-HBs (N = 3), Anti-HBc (N = 3), and mixed markers (reported 2 or more markers, N = 5). Moreover, 6 of the 10 studies were from Asian counties, with 3 studies reported from China. A number of studies were conducted in specific populations: 1 for rural women of childbearing age (14), 1 for pregnant women (25), 1 for school-age children (23). The most common measure of income was household income (N = 7), while 3 was personal income. The majority (N = 8) studies measured income in currency, and 2 studies measured income in grade.
| Id | First Author | Year | Country | Hepatitis B Seromarkers | No of Samples | No of Positive | Gender | Age | Income Type | Income Level | Covariates in Multivariate Analysis |
|---|---|---|---|---|---|---|---|---|---|---|---|
| 1 | Zhang (14) | 2013 | China | HBsAg (+) | 12393 | 1179 | F | 15-49 | Family monthly income (RMB) | < 2000; ≥ 2000 | Univariate analysis. |
| 2 | Liu (21) | 2019 | China | HBsAg (+) | 10256 | 783 | F&M | ≥18 | Monthly household income (HKD) | < 10000; 10001-20000; 20001-30000; > 30000 | Sex; Age; Place of birth; Monthly household income; Hepatitis B vaccination; HBV carriage in mother; HBV carriage in other family members; Previous blood transfusion; Illicit intravenous drug use; Skin tattoo; Hemodialysis; Chronic illness; Residential district; Household income. |
| 3 | Fathimoghaddam (26) | 2011 | Iran | HBsAg (+) | 1652 | 23 | F&M | 1-90 | Household monthly income (Rials) | < 3million; 3-5million; > 5million | Age; Marital Status; Ethnic background; Traditional cupping. |
| 4 | Mutocheluh (27) | 2014 | Ghana | HBsAg (+) | 164 | 24 | F&M | 17-57 | Average income level of subjects | 50;80;100 | Level of education (Stepwise regression method). |
| 5 | Khouri (22) | 2010 | Brazil | Anti-HBc (+) | 243 | 99 | F&M | 1-87 | Annual family Income (BRL) | ≤ 2000; > 2000 | Anti-HCV; Area; Age; Hospitalization; Sexual activity; Partners (Last year). |
| 6 | Khouri (28) | 2005 | Brazil | Anti-HBc (+) | 267 | 165 | F&M | 5-81 | Annual income (US$) | ≤ 1015.22; > 1015.22 | Gender; Age; State of birth; Time of residency in Monte Negro; Interviewee’s occupation. |
| 7 | Luksamijarulkul (23) | 1995 | Thailand | HBsAg (+) or Anti-HBs (+) or Anti-HBc (+) or 2 makers (+) of them | 165 | 41 | F&M | 6-14 | Family income per month (baht) | < 4500; ≥ 4500 | Ear piercing in female (Stepwise regression method). |
| 8 | Bertolini (25) | 2006 | Brazil | HBsAg (+) or Anti-HBs (+) or Anti-HBc (+) or 2 makers (+) of them | 3188 | 591 | F(pregnant) | 12-44 | Family income (times minimum wage) | < 2; 2 - 5; > 5 | Age; Color; Family origin; Internal migration from South region states. |
| 9 | Zhang (15) | 2011 | China | Anti-HBc (+) | 3833 | 1567 | F&M | 18-79 | Yearly income (RMB) | > 800; ≤ 800 | Age; Gender; Drinking; Smoking; Sleep quality; Family size; Occupation; Income; Personal history of vaccination; Family history of HBV. |
| HBsAg (+) | 168 | ||||||||||
| Anti-HBs (+) and Anti-HBc (-) | 471 | ||||||||||
| Anti-HBs (+) and Anti-HBc (+) | 865 | ||||||||||
| 10 | Kahraman (24) | 2018 | Turkey | Anti-HBs (+) | 350 | 263 | F&M | 2 - 21 | Annual per capita equivalent income (TL) | ≤ 3265; > 3265 | Age; Gender; Area of living; Area of living during childhood; Professional status; Perceived income level; Annual per capita equivalent income; Household density. |
| 880 | 81 | 22 - 89 | |||||||||
| HBsAg (+) or Anti-HBc (+) or both | 350 | 10 | 2 - 21 | ||||||||
| 880 | 251 | 22 - 89 |
Characteristics of Case-Contorl Studies Included in the Meta-Analysis of Income and Hepatitis B Seroprevalence
6.2. Income and Hepatitis B Seroprevalence
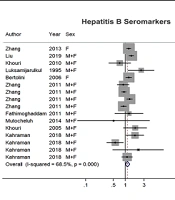
Pooled ORs (95% CIs) were calculated for hepatitis B seroprevalence among people in low income group compared with those in the high income group (Figure 2). The results revealed a borderline risk (OR: 1.14, 95%CI: 1.00-1.30) for hepatitis B seroprevalence (positive for 1 or more seromarkers) among low-income groups (Figure 2A). A significant income effect was observed for HBsAg seroprevalence (Figure 2B), with a 28% higher risk for low income versus high one (OR: 1.28, 95%CI: 1.16 - 1.41). However, no statistically significant associations were found between seroprevalence of Anti-HBs, Anti-HBc, and income (Figure 2C and D).
 and the corresponding 95% confidence intervals (CIs) of hepatitis B seroprevalence for low-income group")
Forest plots for pooled odd ratios (ORs) and the corresponding 95% confidence intervals (CIs) of hepatitis B seroprevalence for low-income group
6.3. Subgroup Analysis
With reference to Figures 2A, degrees of heterogeneity were relatively high in this meta-analysis (I2 = 68.5%, P < 0.001). To identify the source of heterogeneity, subgroup analysis was conducted based on gender, region, marker, and quality scores (Table 2). However, high degrees of heterogeneity were still found within most subgroup analyses.
| All Hepatitis B Seromarkers | ||||
|---|---|---|---|---|
| N a | OR (95%CI) | I2(%) | P Value of Heterogeneity | |
| Overall | 10 | 1.14 (1.00 - 1.30) | 68.5 | < 0.001 |
| Gender | ||||
| Female | 2 | 1.23 (1.11 - 1.38) | 0.0 | 0.985 |
| Male + Female | 8 | 1.12 (0.95 - 1.33) | 71.4 | < 0.001 |
| Region | ||||
| Asia | 6 | 1.14 (0.98 - 1.33) | 74.4 | < 0.001 |
| Others | 4 | 1.21 (1.02 - 1.44) | 29.3 | 0.236 |
| Marker b | ||||
| HBsAg | 5 | 1.28 (1.16 - 1.41) | 44.8 | 0.123 |
| Anti-HBs | 3 | 1.10 (0.63 - 1.92) | 83.5 | 0.002 |
| Anti-HBc | 3 | 0.95 (0.82 - 1.09) | 49.3 | 0.139 |
| Mixed | 5 | 1.18 (0.92 - 1.50) | 63.7 | 0.026 |
| Quality score | ||||
| ≥ 7 scores | 8 | 1.14 (0.98 - 1.33) | 71.7 | < 0.001 |
| < 7 scores | 2 | 1.23 (1.07 - 1.41) | 0.0 | 0.411 |
Pooled and Subgroup Analysis Stratified by Potential Modifying Factors
Moreover, a marginally significant association was found between low income and hepatitis B seroprevalence among females (OR: 1.23, 95%CI: 1.11 - 1.38) and those from non-Asian regions (OR: 1.21, 95%CI: 1.02 - 1.44), as well as in studies < 7 scores (OR: 1.23, 95%CI: 1.07 - 1.41).
6.4. Sensitivity and Publication Bias Analysis
In the sensitivity analysis for HBsAg (Figure 3B) and Anti-HBc (Figure 3D), the omission of any 1 study did not result in significant change in outcomes. However, based on the sensitivity analysis of all seromarkers and anti-HBs, no evident change was observed at pooled results if a certain study were omitted. Concerning the association between income and the seroprevalence of all markers, the omission of any 1 study altered the pooled ORs quantitatively. (Figure 3A). Also, if a certain study was removed, the low income was a risk factor for Anti-HBs seroprevalence (Figure 3C). The results of the Egger’s and Begg’s tests (Figure 4, both P > 0.05) revealed no publication bias.

Results of sensitivity analysis.
, Anti-HBs (3), Anti-HBc (3) and Mixed (5)).")
Funnel plot of publication bias testing results (10 included papers including 16 studies of different hepatitis B seromarkers: HBsAg (5), Anti-HBs (3), Anti-HBc (3) and Mixed (5)).
7. Conclusions
In the current meta-analysis, we intended to comprehensively review the evidence on the association between income and hepatitis B seroprevalence. Based on the findings, there was a significant association between pooled effect sizes of income and HBsAg seroprevalence. The results also revealed a borderline significant association between income and hepatitis B seroprevalence (positive for 1 or more seromarkers). However, the association between income and Anti-HBs seroprevalence was not statistically significant. The same was true about the association between income and Anti-HBc seroprevalence.
HBsAg is an antigen on the surface of HBV that indicates current hepatitis B infection. Currently, vaccination is the most effective mean to prevent HBV infection, which can decrease the HBsAg seroprevalence (29). According to the findings of the present study, income inequality is associated with an increased risk of HBsAg seroprevalence. This might because income is one of the determinants of willingness to pay for the hepatitis B vaccine, and the lower the income, the lower would be the willingness to pay (30). Moreover, compared to those from higher income groups, those with lower income usually have lower levels of awareness about hepatitis B (31) and often have worse living habits (i.e., sharing toothbrushes, razor or nail clippers) (32), which both increase the risk of HBV infection.
As mentioned above, income contributes to the willingness to pay for the HBV vaccine (33-35). Based on this guess, income inequality should be associated with Anti-HBs. However, no statistically significant association was found between income and Anti-HBs seroprevalence. However, this can be due to the inadequacy of literature and the low number of studies that were investigated in the present study.
To the best of our knowledge, this is the first meta-analysis assessing income effects on hepatitis B seroprevalence. However, there are limitations to our study, which should be noted. First, pooled estimates were affected by high heterogeneity. Although we performed a subgroup analysis separated by gender, region, marker, and quality score, we couldn’t identify the source of heterogeneity. Second, we couldn't calculate the difference between subgroups (i.e., the different distribution of seroprevalence of different markers among various income groups), because in one study the sample size of seropositive people was not clear (24). Third, all included studies were case-control studies, which are prone to recall bias. Fourth, the results of sensitivity analysis for hepatitis B seroprevalence (positive for 1 or more seromarkers) and Anti-HBs were both inconsistent. In other words, the associations between income and hepatitis B seroprevalence (positive for 1 or more seromarkers) and anti-HBs were not yet clear.
By taking these limitations into account, future research should pay more attention to the association between anti-HBS and income, so as to provide more material for meta-analysis. Additionally, future studies should aim to unpack the mechanism underlying the association between income and hepatitis B seroprevalence, in particular, to identify the potential factors that influence this association.
In conclusion, this study demonstrated a positive association between low income and risk of HBsAg seroprevalence. Hence, public health programs, particularly those related to hepatitis B prevention, should pay special attention to income inequality, in addition to emphasizing low-income populations.
