


1. Background
Childhood obesity, a serious worldwide growing health problem, is considered as one of the primary etiologies of nonalcoholic fatty liver disease (NAFLD) and other chronic diseases in childhood (1-4). According to previous studies, up to 33% of obese children suffer from NAFLD (5), which may also be associated with an increased risk of type 2 diabetes, cardiovascular diseases, liver fibrosis, hepatic cirrhosis, liver failure, and hepatocellular carcinoma (6-8). NAFLD is a multifactorial disorder in which both genome and environmental factors are involved (9). Notably, the distribution of excessive adipose tissue and total fat plays a critical role in obesity-induced NAFLD and its relevant comorbidities (10).
On the other hand, osteoporosis is considered a major fall-related death etiology mostly observed in the elderly (11). An optimal peak bone mass achievement in early adulthood is believed to be the best protective factor against future osteoporosis (12). According to the literature, the childhood era, especially the peri-pubertal stage, is a critical period for bone mass accretion (12, 13). In addition to the obesity-related lifestyle factors such as sedentary lifestyles, hepatic steatosis/NAFLD may be associated with decreased bone mineral density (BMD) (14). This is, while this field of research has been disregarded in the literature.
2. Objectives
The present study follows two primary objectives: (1) to examine the possible relationship between NAFLD and body composition, especially the distribution of body fat; (2) to investigate the probable relationship between NAFLD with BMD in overweight/obese adolescents.
3. Methods
3.1. Study Population
This cross-sectional study was carried out during March- September 2016 in Mashhad, Iran. The participants were non-randomly selected from the overweight and obese children admitted to a nutrition clinic.
3.1.1. Inclusion Criteria
Adolescents aged 11 - 18 years and BMI is > 85th percentile. The exclusion criteria of the study were suffering from chronic diseases (e.g., viral hepatitis, autoimmune/congenital liver disease, congenital metabolic diseases, and cancer) and undergoing any type of surgery during the last six months. Accordingly, 70 overweight and obese adolescents (37 boys and 33 girls) participated in this study. Written informed consent forms were provided by all the parents or the legal guardians of the participants. The study was approved by the Ethics Committee at Mashhad University of Medical Sciences (MUMS) (ethical code: IR.MUMS.fm.REC.1395.64).
3.2. Sample Size
The present study is a part of our previous study entitled "plasma levels of vascular endothelial growth factor and its soluble receptor in nonalcoholic fatty liver disease" (15) and published in 2018. Since our previous project was partly a student dissertation and partly a university project, we had to publish the findings in two papers. In the primary project, the sample size was determined using the following formula:
Where, type1 error (α) = 0.05; type 2 error (β) = 80% (power); X1= mean in group 1; X2= mean in group 2; Z1= standard deviation in group 1; Z2= standard deviation in group 2.
Accordingly, the sample size was estimated to be 70.
3.3. Data Collection
Anthropometric parameters, including weight (kg), height (cm), and waist circumference (cm), were determined based on standard protocols. Body height was measured to the nearest 0.01 cm with barefoot in a standing position, using a standard stadiometer. Bodyweight was measured by a clinical scale (SECA) to the nearest 0.1 kilograms. Waist circumference was measured in the horizontal plane midway between the lower ribs and the iliac crest. Body mass index (BMI) was defined as an individual's body weight divided by the square of his or her height (standard unit of measure is kg/m2).
The participants’ physical activity was assessed using the Baecke Habitual Physical Activity Questionnaire (BHPAQ). The questionnaire evaluates individuals’ habitual physical activity on a scale ranging from 1 to 5 (16, 17), with a score of 1 and 5 indicating the lowest and highest levels of activity (18). The reliability and validity of BHPAQ (Farsi version) are already confirmed (19).
Blood samples were obtained from the participants’ antecubital veins after 10 - 12-hour fasting to determine the levels of fasting blood glucose (FBG), fasting insulin (FI), hemoglobin A1c, 25(OH) Vitamin D, and full-fasting lipid profile, including the levels of triglyceride (TG), total cholesterol (TC), low-density lipoprotein cholesterol (LDL-c), and high-density lipoprotein cholesterol (HDL-c) using standard automated laboratory techniques. Moreover, liver function enzymes, including aspartate aminotransferase (AST), alanine aminotransferase (ALT), and gamma-glutamyl transferase (GGT), were measured as well.
3.4. Measurement of Fat Mass, Fat-Free Mass, and Bone Mineral Density Using DXA
Whole-body composition, including bone mineral density (BMD), bone mineral content (BMC), lean mass (LM), and fat mass (FM), was determined using whole-body dual-energy X‐ray absorptiometry (DXA) scans (GE Lunar Corp, Madison, WI, USA) at the radiology department of Imam Reza Hospital, Mashhad University of Medical Sciences, Mashhad, Iran. All DXA scans and subsequent in-software analyses were completed by the same certified radiological technologist blinded to the participants' characteristics. The DXA scan machine was calibrated in daily examinations based on the manufacturer’s guidelines.
All the scan results were divided into total and regional FM, LM, BMD, and BMC scans. Moreover, two android and gynoid regions were measured using DXA scan. Furthermore, adipose indices were calculated as follows: (1) A/G ratio [the ratio of android (kg) divided by gynoid (kg)], (2) fat mass index (FMI) [fat mass/height2 (kg/m2)], (3) %fat trunk/ %fat legs, and (4) trunk/limb fat mass ratio. Lean + BMC indices were also calculated as follows: (1) lean mass index (LMI) (lean + BMC/ height2), and (2) appendicular lean mass index (ALMI) (appendicular lean mass + BMC/ height2).
3.5. Measurement of Liver Steatosis Using Fibroscan
Fibroscan approach was used to assess liver steatosis and fibrosis (Echosense504), in which liver stiffness was measured using shear wave velocity (20). Controlled attenuation parameter (CAP) is a novel noninvasive tool using ultrasound attenuation for liver steatosis measurement, which has been implemented by the Fibroscan approach (21).
Fibroscan was performed on a standardized machine (Echosens, Paris, France) by a certified operator utilizing a small (S) or medium (M) probe to assess both CAP (dB/m) and liver stiffness examinations (LSM) (kPa) simultaneously. A reliable LSM was defined as the median value of 10 measurements (a success rate of > 60%, and an IQR < 30% of the median LSM value) (22). The severity of liver steatosis was assessed according to the following cutoffs for CAP: (1) < 225 db/m (no steatosis), (2) 225 - 250 db/m (mild steatosis), (3) 250 - 300 db/m (moderate steatosis), (4) > 300 db/m (severe steatosis) (23). Moreover, CAP < 225 db/m as and CAP > 225 db/m were set as no NAFLD and NAFLD, respectively.
3.6. Statistical Analysis
All the statistical analyses were conducted using SPSS software version 21. The Kolmogorov-Smirnov test was used to examine the data normality. Normally distributed quantitative data were described by mean and standard deviation, and non-parametric data were described using median and interquartile range (IQR). Furthermore, qualitative data were described as frequency and percentage. Independent-sample t-test and Mann-Whitney test were used to compare continuous variables in the two groups, and a chi-square test was conducted for categorical variables.
The relationship between liver fat content with BMD, BMD Z-score, and BMC were evaluated using multivariate linear regression analysis. Standardized β was represented as the coefficient β. The relationship between different parts of body composition and NAFLD were assessed using multivariate logistic regression analysis, and the odds ratios (OR) and 95% confidence intervals (CI) were calculated. P < 0.05 was set as the significance level in all tests.
4. Results
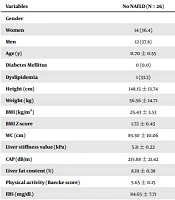
Table 1 shows the participants’ general specifications. The study participants’ mean ± SD age (n = 70) was 12.78 ± 2.91 years, and 52.8% of the participants were male. The mean ± SD of BMI and waist circumference were 28.14 ± 4.91 kg/m2 and 91.34 ± 11.52 cm, respectively. Forty-four adolescents (62.8 %) with NAFLD had significantly higher height, weight, BMI, BMI Z-score, and waist circumference, in comparison to adolescents with no NAFLD (P < 0.05). Nonetheless, no significant difference was observed between the adolescents with NAFLD or with no NAFLD in terms of age, level of physical activity (baecke score), and all the laboratory variables (P > 0.05), except for fasting insulin (P = 0.024).
| Variables | No NAFLD (N = 26) | NAFLD (N = 44) | P Value |
|---|---|---|---|
| Gender | 0.9 | ||
| Women | 14 (36.4) | 23 (63.6) | |
| Men | 12 (37.8) | 21 (62.2) | |
| Age (y) | 11.70 ± 0.55 | 13.47 ± 0.42 | 0.08 |
| Diabetes Mellitus | 0 (0.0) | 3 (100) | 0.289 |
| Dyslipidemia | 1 (33.3) | 2 (66.6) | 0.999 |
| Height (cm) | 148.15 ± 13.74 | 158.11 ± 11.30 | 0.002 |
| Weight (kg) | 56.56 ± 14.71 | 74.87 ± 19.28 | 0.000 |
| BMI (kg/m2) | 25.43 ± 3.53 | 29.60 ± 5.23 | 0.001 |
| BMI Z-score | 1.72 ± 0.45 | 1.95 ± 0.37 | 0.028 |
| WC (cm) | 85.30 ± 10.06 | 95.14 ± 12.08 | 0.001 |
| Liver stiffness value (kPa) | 5.11 ± 0.22 | 5.27 ± 0.20 | 0.715 |
| CAP (dB/m) | 215.88 ± 21.42 | 284.27 ± 28.14 | 0.000 |
| Liver fat content (%) | 8.19 ± 0.38 | 52.69 ± 3.26 | 0.000 |
| Physical activity (Baecke score) | 5.65 ± 0.15 | 5.58 ± 0.11 | 0.503 |
| FBS (mg/dL) | 84.65 ± 7.71 | 83.68 ± 9.32 | 0.655 |
| HbA1C | 5.12 ± 0.15 | 5.14 ± 0.12 | 0.661 |
| AST (IU/L) | 24.19 ± 1.28 | 24.21 ± 2.42 | 0.298 |
| ALT (IU/L) | 23.80 ± 2.32 | 30.45 ± 4.78 | 0.173 |
| GGT (mg/dL) | 20.76 ± 1.29 | 22.85 ± 1.50 | 0.443 |
| TG (mg/dL) | 97.19 ± 6.97 | 100.31 ± 5.26 | 0.679 |
| TC (mg/dL) | 150.92 ± 25.14 | 144.09 ± 23.25 | 0.253 |
| LDL-c (mg/dL) | 82.42 ± 14.99 | 78.25 ± 18.07 | 0.325 |
| HDL-c (mg/dL) | 39.27 ± 1.49 | 39.69 ± 1.14 | 0.765 |
| 25 (OH) vitamin D (ng/mL) | 29.28 ± 4.06 | 31.00 ± 2.93 | 0.894 |
| Fasting insulin (µIU/mL) | 8.84 ± 1.01 | 13.76 ± 1.41 | 0.024 |
Among fat mass indices assessed by DXA scan, total and trunk FM, android and gynoid FM, and FMI were significantly higher in adolescents with NAFLD than adolescents with no NAFLD (P < 0.05) (Table 2). Moreover, NAFLD-positive adolescents had higher mean total LM, total (LM + BMC), LMI, ALMI, and total mass than adolescents with No NAFLD (P < 0.05) (Table 2).
| Variables | No NAFLD (N = 26) | NAFLD (N = 44) | P Value |
|---|---|---|---|
| Total FM (g) | 23279.00 ± 5553.19 | 32415 ± 9112.69 | < 0.001 |
| Trunk FM (g) | 9361.00 ± 3199.53 | 13292.42 ± 3933.63 | < 0.001 |
| Android FM (g) | 1712.23 ± 572.50 | 2395.30 ± 826.53 | < 0.001 |
| Gynoid FM (g) | 3589.73 ± 191.66 | 4947.04 ± 238.17 | < 0.001 |
| Android/gynoid ratio | 1.01 ± 0.08 | 1.03 ± 0.07 | 0.184 |
| Total body fat (%) | 41.63 ± 5.69 | 43.97 ± 5.45 | 0.095 |
| Total body fat (%) Z-score | 1.38 ± 0.10 | 1.61 ± 0.07 | 0.128 |
| FMI (kg/m2) | 10.61 ± 2.42 | 13.11 ± 3.39 | 0.002 |
| Total LM (g) | 31671.92 ± 1969.39 | 39204.65 ± 1456.24 | 0.001 |
| Total (lean mass + BMC) (g) | 33220.56 ± 2072.27 | 48490.79 ± 7496.69 | 0.001 |
| LMI (kg/m2) | 14.68 ± 2.16 | 16.40 ± 2.28 | 0.003 |
| Total mass (g) | 56499.56 ± 2832.72 | 73490.20 ± 2560.49 | < 0.001 |
| ALMI (kg/m2) | 6.50 ± 1.15 | 7.37 ± 1.13 | 0.003 |
| Total BMD (g/cm2) | 0.96 ± 0.02 | 1.02 ± 0.02 | 0.198 |
| Total BMD Z-score | 1.19 ± 1.00 | 0.75 ± 1.05 | 0.093 |
| Thoracic spine BMD (g/cm2) | 0.70 ± 0.02 | 0.75 ± 0.02 | 0.097 |
| Total BMC (g) | 1584.29 ± 103.72 | 1903.68 ± 88.47 | 0.012 |
| Trunk BMC (g) | 408.59 ± 29.60 | 495.76 ± 27.51 | 0.017 |
BMC at the trunk (P = 0.017) and whole-body (P = 0.012) were significantly higher in NAFLD positive group than adolescents with no NAFLD; however, there was no significant difference between the two groups in terms of total BMD (P = 0.198), total BMD Z-score (P = 0.093), and BMD at thoracic spine (P = 0.097).
Table 3 demonstrates the relationships between fat and fat-free mass patterning indices and NAFLD in overweight/obese adolescents using multivariable regression analyses. Independent of age, higher total FM was significantly correlated with increased NAFLD BMI Z-score (model 2, OR = 1.33, P = 0.003), ALT, T-cholesterol (model 3, OR = 1.33, P = 0.007), fasting insulin, and physical activity (model 4, OR = 1.27, P = 0.036). The relationship between trunk FM and NAFLD revealed the same pattern. Moreover, higher android and gynoid FM and FMI were significantly correlated with increased NAFLD in the crude model (model 1) and model 2 (P < 0.05). In this regard, this relationship attenuated to the null value when we additionally controlled for ALT, TC, fasting insulin, and physical activity (models 3 and 4) (P > 0.05). There was no significant relationship between total LM and ALMI with NAFLD after controlling for intervening factors in the adjusted models (P > 0.05).
| Variables | Model 1 | Model 2 | Model 3 | Model 4 | ||||
|---|---|---|---|---|---|---|---|---|
| OR (95% CI) | P Value | OR (95% CI) | P Value | OR (95% CI) | P Value | OR (95% CI) | P Value | |
| Total FM | 1.24 (1.11-1.39) | < 0.001 | 1.33 (1.1-1.6) | 0.003 | 1.33 (1.08-1.63) | 0.007 | 1.27 (1.016-1.59) | 0.036 |
| Trunk FM | 1.51 (1.2-1.9) | < 0.001 | 1.54 (1.086-2.19) | 0.015 | 1.5 (1.046-2.15) | 0.03 | 1.35 (0.97-1.88) | 0.045 |
| Android FM | 6.26 (2.2-17.8) | 0.001 | 5.24 (0.89-30.6) | 0.048 | 4.12 (0.62-27.1) | 0.14 | 2.52 (0.45-14.14) | 0.29 |
| Gynoid FM | 2.82 (1.57-5.03) | < 0.001 | 2.35 (1.12-4.92) | 0.02 | 2.1 (0.94-4.7) | 0.07 | 1.8 (0.82-3.94) | 0.14 |
| FMI | 1.45 (1.15-1.84) | 0.002 | 1.36 (0.99-1.87) | 0.049 | 1.41 (0.96-2.06) | 0.075 | 1.3 (0.87-1.97) | 0.19 |
| Total LM | 1.10 (1.033-1.17) | 0.003 | 1.17 (0.82-1.66) | 0.38 | 1.02 (0.91-1.15) | 0.67 | 1.003 (0.89-1.12) | 0.96 |
| ALMI | 2.09 (1.26-3.47) | 0.004 | 1.15 (0.53-2.5) | 0.72 | 0.96 (0.41-2.25) | 0.93 | 0.69 (0.26-1.8) | 0.45 |
Multivariate linear regression analyses were conducted to investigate the relationship between liver fat content (%) with BMD and BMC (Table 4). There was no significant relationship between total BMD and liver fat content neither in the crude model nor other adjusted models (P > 0.05). Regarding total BMD Z-score, there was no significant relationship between liver fat content (%) and total BMD Z-score in the crude model (β = -0.205, P = 0.094), model 2 (β = -0.217, P = 0.105), and model 3 (β = -0.263, P = 0.07); however, when total LM and physical activity were interned additionally into the model 4, a significant relationship was noticed between liver fat content (%) and lower BMD Z-score (β = -0.285, P = 0.048). Liver fat content was not significantly associated with Total BMC after controlling for intervening factors in the adjusted models (P > 0.05).
| Variables | Model 1 | Model 2 | Model 3 | Model 4 | ||||||||
|---|---|---|---|---|---|---|---|---|---|---|---|---|
| R2 | B | P Value | R2 | β | P Value | R2 | β | P Value | R2 | β | P Value | |
| Total BMD | 0.042 | 0.238 | 0.053 | 0.557 | -0.125 | 0.186 | 0.545 | -0.116 | 0.256 | 0.667 | -0.168 | 0.058 |
| Total BMD Z-score | 0.027 | -0.205 | 0.094 | 0.096 | -0.217 | 0.105 | 0.079 | -0.263 | 0.07 | 0.111 | -0.285 | 0.048 |
| Total BMC | 0.081 | 0.307 | 0.011 | 0.656 | -0.065 | 0.425 | 0.661 | -0.035 | 0.686 | 0.863 | -0.107 | 0.058 |
5. Discussion
The findings of the present study indicate that fat mass-related indices, especially total and trunk fat mass, are independently correlated with increased NAFLD, suggesting that excess body fat may play a crucial role in the pathogenesis of fatty liver in overweight/obese children and adolescents. In line with the findings of the present study, several studies have reported the relationship between body fat mass and NAFLD in adults and children (24-27). According to Monteiro et al., trunk fat mass and intra-abdominal adipose tissue were the significant predictors of NAFLD in obese children and adolescents (25). Furthermore, in our previous study, waist circumference and BMI were positively correlated with liver steatosis and fibrosis in children and adolescents, thereby predicting NAFLD (28). Similarly, Yang et al. reported the relationship between body fat mass with insulin resistance and subsequent NAFLD in obese children (29).
The underlying pathophysiological mechanisms demonstrated the relationship between excess fat mass, obesity, and NAFLD include different points such as systemic inflammation, increased serum levels of free fatty acids, and subsequently insulin resistance (30).
Furthermore, the relationship between fatty liver content and Bone or osteoporosis-related indices was examined in the present study, and the findings revealed that liver fat accumulation was significantly correlated with lower whole-body BMD Z-score, regardless of total lean mass and physical activity. This finding suggests that liver steatosis may have a negative effect on bone health in obese children and adolescents. Consistent with our findings, some studies have confirmed the relationship between liver steatosis and BMD in children (14, 31-33). For example, Pirgon et al. documented that adolescents with obesity and NAFLD had lower lumbar spine BMD than adolescents with obesity and no NAFLD or non-obese participants (31). A recent study examining the relationship between hepatic fat content and BMD in children reported lower BMD and BMD Z-score in children with NAFLD (14). In contrast, Chang et al. evaluated vitamin D status and BMD in obese children with NAFLD and detected no difference in vitamin D levels or age-matched BMD among children with simple steatosis, NASH children, and healthy children (34). A systematic review and meta-analysis assessing the relationship between nonalcoholic fatty liver disease and bone mineral density in obese adolescents documented that obese adolescents with NAFLD had lower BMD and thus the higher risk of osteoporosis than obese children with no NAFLD (35).
The underlying pathophysiological mechanisms have not been clarified yet. However, several studies have suggested that chronic inflammation, exclusively produced by the liver, primarily increases CRP levels and elevated TNF- α levels in the systemic inflammation in this relationship (36-38). Furthermore, chronic inflammation can result in elevated osteoclast activity, inhibit osteoblast differentiation, and increase osteoblast apoptosis (39). In this regard, inflammatory cytokines, including interleukin-6, interleukin-1, and TNF- α, have also been involved in the NAFLD pathogenesis (40). To conclude, the presence of systemic inflammation may justify the inverse relationship between NAFLD and total BMD Z-score.
Insulin resistance is another precise mechanism linking these two disorders. Moreover, the increased release of fat-free acids from adipocytes may lead to insulin resistance because of the extra accumulation of adipose tissue in hepatic mass (41), which is associated with BMD and bone health (41, 42). Further studies are recommended to address these mechanisms in detail.
The present study had some strengths. First, we excluded individuals with chronic conditions (e.g., viral hepatitis, autoimmune/congenital liver disease, congenital metabolic diseases, and cancer) who could yield CAP values for the different distribution of liver steatosis assessed by TE. Another strength of this study was that many possible intervening factors were included in the regression analyses.
This study also had some limitations. First, it was a cross-sectional study, making it difficult to detect a causal relationship between NAFLD with body composition and BMD. Further, liver biopsy as a gold standard approach to diagnosing and assessing liver steatosis and fibrosis was not conducted. According to recent studies, CAP and liver stiffness measurement (LSM) are well correlated with the degree of liver fibrosis and steatosis measured by biopsy (43, 44).
5.1. Conclusion
In conclusion, the present study results confirmed that excess adipose tissue is independently associated with higher NAFLD in obese and overweight adolescents. Moreover, it was demonstrated that liver steatosis is associated with decreased whole-body BMD Z-score, regardless of physical activity and lean mass. To sum up, these findings suggest that obesity and NAFLD may be closely correlated with bone loss and osteoporosis in adolescents.
