1. Background
Nowadays, hepatitis C is considered a public health issue over the world (1). This disease is a type of infection that usually affects the liver. Hepatitis C virus (HCV) is the cause of this disease (2). Around 71 million people worldwide and 21.3 million in the East Mediterranean region are inflicted with hepatitis C, making a death toll of 350,000 to 700,000 individuals (3). Hepatitis C would impose a large economic burden on the health system in decades to come due to the risk of liver transplantation, mortality, and mortality (4). Antiviral drugs could cure more than 95% of hepatitis C patients, thus, reducing the risk of mortality, liver cancer, and cirrhosis (5). However, early access to diagnosis and treatment is a major condition. Around 5% of the world’s population are chronic carriers of HCV (6). According to the latest statistics published by a systematic review article, the prevalence of HCV infection is 0.3% in the general population of Iran.
Hepatitis C has different genotypes 1 to 7, each with a prominent role in response to treatment. Sixty percent of the patients are genotype 1 (7, 8). Given that genotype 1 is very common in Iran, it is of importance to be studied (9). Hepatitis C might lead to great social and economic costs to the patient and society. In the case of inappropriate treatment and disease progression, the costs would increase exorbitantly. In fact, the cost of the complete treatment of every HCV patient is 2,084$ for diagnostic services and 242 to 8,256$ for treatment strategies (10). Therefore, early and appropriate treatment of chronic HCV would prevent disease progression and thus disability and mortality and decrease the costs to the family and society (11).
Interferon and Ribavirin are the standard medications for HCV. Around 50-80% of the patients receiving these medications are cured. Patients that develop cirrhosis or liver cancer might require liver transplantation; however, HCV recurrence usually develops after transplantation (12). Treating the disease inhibits the progression to more severe conditions such as cirrhosis and liver cancer and enhances the quality of life and survival in patients. As a regimen, RBV + peg-IFN was previously used to treat HCV patients in Iran, which is a confirmed combination worldwide to improve and prevent disease progression (13). The sustained virologic response (SVR) in patients with genotype 1 using this therapy is estimated at 40 - 50% (13). However, this combination has certain side effects urging to shift towards novel therapies for HCV (14). Novel therapeutic methods contain different metabolites of sofosbuvir (SOF), which are prescribed for the patient according to their genotype and disease stage. The advantages of these therapeutic regimens include the decreased treatment period, higher responses, and increased quality of life (15-17). In fact, the results showed that novel medication regimens could increase the SVR rates to more than 90% in different genotypes (18).
Considering the limited number of studies on the economic assessment of different compounds of SOF drugs, the present research evaluated the cost-effectiveness of three medication regimens, i.e., VEL/SOF, LDV/SOF, and DCV/SOF in HCV patients with genotype 1 for the first time in Iran. The present study findings could be applied in designing the clinical guidelines for HCV patients to help decision-makers and policy-makers better select cost-effective interventions and increase allocation efficacy in the health system.
2. Objectives
The objective of this study was to assess the cost-effectiveness of ledipasvir/sofosbuvir (LDV/SOF) compared with velpatasvir/sofosbuvir and daclatasvir/sofosbuvir (DCV/SOF) in HCV patients with genotype 1 in Iran.
3. Methods
The present economic assessment was a cost-utility analysis study on chronic hepatitis C patients with genotype 1 to compare the effects of three medication regimens, including SOF/VEL, SOF/LDV, and SOF/DCV. The statistical population of the present study included 46 records for VEL/SOF, 400 records for DCV/SOF, and 400 records for LDV/SOF in patients with HCV in Baqiyatallah Hospital, Baqiyatallah Gastroenterology and Liver Research Center, Namazi Hospital, and Motahhari Clinic, Shiraz, in 2018. Given the limited number of records in the SOF/VEL regimen, the 46 records were assessed by the census. However, due to a large number of records for the two other strategies, i.e., DCV/SOF and LDV/SOF, 392 records were selected using the Morgan table. The Morgan table is a simple way to calculate the sample size when the population size is known. The inclusion criteria included patients having chronic hepatitis C with genotype 1 and receiving the understudy medications with available records. Moreover, the exclusion criteria were having other genotypes of hepatitis C and other types of hepatitis. The Markov model was used in this study due to the chronic and recurring nature of HCV infection (19).
The outcomes used in this study included quality-adjusted life-year (QALY) and costs for each health state and each medication strategy. The lifetime horizon was developed using Tree Age (version 2020) to predict the costs and outcomes of three medication strategies in a simulated population of 5,000 hepatitis C patients with genotype 1. Using the opinions of the experts, the study period was determined one year. Given that the time horizon of the study is more than a year, the costs and the QALYs were discounted with annual rates of 5.8% (20, 21) and 3% (22, 23), respectively.
3.1. Model Structure
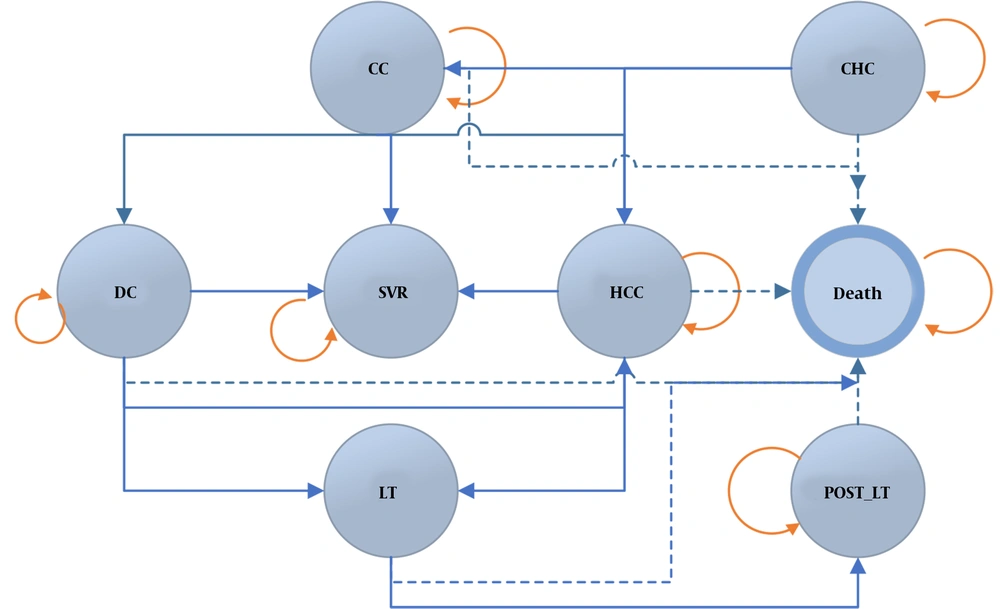
Figure 1 shows the general structure of the Markov model for a simulated population of 5,000 patients with hepatitis C. The model was extracted according to the trend of the disease apparent in other diseases, and it was finalized after consulting with hepatologists. Health states of the disease were defined as chronic hepatitis C (CHC), compensated cirrhosis (CC), decompensated cirrhosis (DC), hepatocellular carcinoma (HCC), liver transplant (LT), sustained virologic response (SVR), and death. Individuals were in the CHC state in the first place and would stay in the same state or move to a different state each year until death. Moving between different disease states and staying in the same state were determined using data from other studies and experts' opinions. Patients receiving treatment from any state could move to the HCC state and death.
It is not possible to regress to milder states from severe states of the disease in this model. Although some studies confirm the possibility of regression (24, 25), it was not clearly reported; therefore, we decided not to model these states. The designed Markov model compared the three medication strategies, and patients evaluated using this model received one of the three medication regimens. Moreover, SVR was determined as the therapeutic target and the cured state in the model. Therefore, patients not reaching SVR were at risk for the progression of hepatic disease.
3.2. Understudy Population
In this study, 846 files of hepatitis C patients with genotype 1 in Baqiyatallah Hospital, Baqiyatallah Hospital Research Center for Gastroenterology and Liver, Namazi Hospital, and Motahhari Clinic, Shiraz, entered the study. These centers are national referral centers, and patients from around the country are hospitalized there. The analysis and simulation were conducted for a hypothetical cohort group of 5,000 individuals.
3.3. Model Parameters
We used three sets of parameters in the Markov model (Tables 1-3), as follows:
(1) Transitional Probabilities: The transitional probabilities between the different study states were extracted from domestic and foreign studies on hepatitis C (26-32). All-cause mortality probabilities were obtained for age and gender data from Iran's 2018 life table (33). Finally, the probability of HCV-related mortalities was extracted from the published articles (34-37). The probabilities used in the model are reported in Table 1.
| Transition Probability Variable | α | β | Distribution | Reference |
|---|---|---|---|---|
| LDV/SOF | ||||
| Prob CHC to SVR | 0.89 | 0.061 | Beta | Ruggeri et al. (26), Igarashi et al. (32), Rezaee-Zavareh et al. (29) |
| Prob CHC to CC | 0.0905 | 0.025 | Beta | Ruggeri et al. (26), Igarashi et al. (32) |
| Prob CHC to HCC | 0.0109 | 0.001 | Beta | Ruggeri et al. (26), Igarashi et al. (32) |
| Prob CC to SVR | 0.89 | 0.02 | Beta | Ruggeri et al. (26), Igarashi et al. (32), Rezaee-Zavareh et al. (29) |
| Prob CC to DC | 0.053 | 0.013 | Beta | Ruggeri et al. (26), Igarashi et al. (32) |
| Prob CC to HCC | 0.045 | 0.03 | Beta | Ruggeri et al. (26), Igarashi et al. (32) |
| Prob DC to HCC | 0.041 | 0.027 | Beta | Ruggeri et al. (26), Igarashi et al. (32) |
| Prob DC to LT | 0.0125 | 0.009 | Beta | Ruggeri et al. (26), Igarashi et al. (32) |
| Prob DC to death | 0.13 | 0.02 | Beta | Ruggeri et al. (26), Igarashi et al. (32) |
| Prob HCC to LT | 0.04 | 0.011 | Beta | Ruggeri et al. (26), Igarashi et al. (32) |
| Prob HCC to death | 0.43 | 0.059 | Beta | Ruggeri et al. (26), Igarashi et al. (32) |
| Prob LT to death | 0.189 | 0.021 | Beta | Ruggeri et al. (26), Igarashi et al. (32) |
| Prob Post LT to death | 0.057 | 0.014 | Beta | Ruggeri et al. (26), Igarashi et al. (32) |
| LDV/DCV | ||||
| Prob CHC to SVR | 0.89 | 0.025 | Beta | Saint-Laurent et al. (28), Moshyk et al. (27) |
| Prob CHC to CC | 0.114 | 0.025 | Beta | Saint-Laurent et al. (28), Moshyk et al. (27) |
| Prob CHC to HCC | 0.0109 | 0.0014 | Beta | Saint-Laurent et al. (28), Moshyk et al. (27) |
| Prob CC to SVR | 0.9 | 0.02 | Beta | Saint-Laurent et al. (28), Moshyk et al. (27) |
| Prob CC to DC | 0.038 | 0.004 | Beta | Saint-Laurent et al. (28), Moshyk et al. (27) |
| Prob CC to HCC | 0.018 | 0.004 | Beta | Saint-Laurent et al. (28), Moshyk et al. (27) |
| Prob DC to HCC | 0.023 | 0.01 | Beta | Saint-Laurent et al. (28), Moshyk et al. (27) |
| Prob DC to LT | 0.0182 | 0.0022 | Beta | Saint-Laurent et al. (28), Moshyk et al. (27) |
| Prob DC to death | 0.13 | 0.011 | Beta | Saint-Laurent et al. (28), Moshyk et al. (27) |
| Prob Post LT to death | 0.045 | 0.012 | Beta | Saint-Laurent et al. (28), Moshyk et al. (27) |
| Prob HCC to LT | 0.03 | 0.012 | Beta | Saint-Laurent et al. (28), Moshyk et al. (27) |
| Prob HCC to death | 0.43 | 0.059 | Beta | Saint-Laurent et al. (28), Moshyk et al. (27) |
| VEL/SOF | ||||
| Prob CHC to SVR | 0.92 | 0.006 | Beta | Yun et al. (31), Buti et al. (30) |
| Prob CHC to CC | 0.068 | 0.048 | Beta | Yun et al. (31), Buti et al. (30) |
| Prob CHC to HCC | 0.007 | 0.007 | Beta | Yun et al. (31), Buti et al. (30) |
| Prob CC to SVR | 0.94 | 0.035 | Beta | Yun et al. (31), Buti et al. (30) |
| Prob CC to DC | 0.039 | 0.039 | Beta | Yun et al. (31) |
| Prob CC to HCC | 0.018 | 0.006 | Beta | Yun et al. (31), Buti et al. (30) |
| Prob DC to HCC | 0.068 | 0.028 | Beta | Yun et al. (31), Buti et al. (30) |
| Prob DC to LT | 0.001 | 0.002 | Beta | Yun et al. (31), Buti et al. (30) |
| Prob DC to death | 0.169 | 0.05 | Beta | Yun et al. (31), Buti et al. (30) |
| Prob HCC to LT | 0.005 | 0.001 | Beta | Yun et al. (31), Buti et al. (30) |
| Prob HCC to death | 0.427 | 0.023 | Beta | Yun et al. (31), Buti et al. (30) |
| Prob LT to death | 0.116 | 0.018 | Beta | Yun et al. (31), Buti et al. (30) |
| Prop Post LT to death | 0.044 | 0.012 | Beta | Yun et al. (31), Buti et al. (30) |
Abbreviations: CHC, chronic hepatitis C; CC, compensated cirrhosis; DC, decompensated cirrhosis; HCC, hepatocellular carcinoma; W, withdrawal; SVR, sustained virological response; LT, liver transplant.
(2) Cost Inputs: The cost data in the present study were estimated from the perspective of the Ministry of Health. Therefore, only the direct medical costs (DMC) were extracted according to a designed form for health states and medication regimens ascertained in patients' medical records and expert opinions in Baqiyatallah Hospital and Baqiyatallah Hospital Research Center for Gastroenterology and Liver, Namazi Hospital, and Motahhari Clinic, Shiraz. These centers were purposefully selected due to being referral centers. The bottom-up approach was used to calculate the costs. The components of DMC consisted of costs for hospitalization, diagnostic medical services, physician visits, and medications. Moreover, for international comparisons, the costs were estimated based on tariffs in 2019 per international dollar (purchasing power parity) with an exchange rate of 22,075 Rials per dollar (38). The cost of each health state is presented separately in Tables 2 and 3.
| Direct Medical Cost | SOF/VEL (12 wk) | SOF/DCV (12 wk) | SOF/LDV (12 wk) | |||
|---|---|---|---|---|---|---|
| % | PPP$ | % | PPP$ | % | PPP$ | |
| Visit | 1.56 | 75.32 | 1.66 | 75.32 | 1.77 | 75.32 |
| Main Drug | 51.79 | 2500 | 52.15 | 2362 | 51.14 | 2169 |
| Laboratory | 35.84 | 1730.37 | 35.18 | 1593.49 | 35.79 | 1517.88 |
| Radiology | 10.8 | 521.31 | 11 | 498.19 | 11.29 | 478.8 |
| Total | 100 | 4827 | 100 | 4529 | 100 | 4241 |
| Variable Cost | Mean (PPP$) | SD | Distribution | SD Reference |
|---|---|---|---|---|
| SOF/LDV (12 weeks) | ||||
| CHC | 4241 | 293 | Gamma | Calculated |
| CC | 4919 | 321 | Gamma | Calculated |
| DC | 6994 | 265 | Gamma | Calculated |
| HCC | 17498 | 289 | Gamma | Calculated |
| SOF/DCV (12 weeks) | ||||
| CHC | 4529 | 293 | Gamma | Calculated |
| CC | 5498 | 321 | Gamma | Calculated |
| DC | 7283 | 265 | Gamma | Calculated |
| HCC | 17832 | 289 | Gamma | Calculated |
| SOF/VEL (12 weeks) | ||||
| CHC | 4827 | 293 | Gamma | Calculated |
| CC | 5449 | 321 | Gamma | Calculated |
| DC | 7524 | 265 | Gamma | Calculated |
| HCC | 18074 | 289 | Gamma | Calculated |
(3) Utility Values: As final outcomes are preferred for policy-making and decision-making, only the QALYs outcome was used for the final analysis. In this study, QALYs were considered as the health outcome. The utility values used in the model are presented in Table 4. Since the drug regimens are recently introduced and used in the country, there is a lack of sufficient evidence determining the values used in the model; thus, we used the evidence found in studies published in other countries (13, 18, 39-45).
| Utility Variable | Mean | SD | Distribution | Reference |
|---|---|---|---|---|
| SOF/LDV | ||||
| Utility CHC | 0.76 | 0.023 | Beta | Buti et al. (30), Igarashi et al. (32) |
| Utility CC | 0.74 | 0.02 | Beta | Buti et al. (30), Igarashi et al. (32) |
| Utility DC | 0.68 | 0.01 | Beta | Buti et al. (30), Igarashi et al. (32) |
| Utility HCC | 0.57 | 0.041 | Beta | Buti et al. (30), Igarashi et al. (32) |
| Utility LT | 0.55 | 0.032 | Beta | Buti et al. (30), Igarashi et al. (32) |
| Utility Post LT | 0.65 | 0.05 | Beta | Buti et al. (30), Igarashi et al. (32) |
| Utility SVR | 0.86 | 0.04 | Beta | Buti et al. (30), Igarashi et al. (32) |
| SOF/DCV | ||||
| Utility CHC | 0.74 | 0.03 | Beta | Saint-Laurent et al. (28), Moshyk et al. (27) |
| Utility CC | 0.73 | 0.043 | Beta | Saint-Laurent et al. (28), Moshyk et al. (27) |
| Utility DC | 0.64 | 0.21 | Beta | Saint-Laurent et al. (28), Moshyk et al. (27) |
| Utility HCC | 0.52 | 0.023 | Beta | Saint-Laurent et al. (28), Moshyk et al. (27) |
| Utility SVR | 0.87 | 0.071 | Beta | Saint-Laurent et al. (28), Moshyk et al. (27) |
| Utility Post LT | 0.72 | 0.054 | Beta | Saint-Laurent et al. (28), Moshyk et al. (27) |
| Utility LT | 0.52 | 0.06 | Beta | Saint-Laurent et al. (28), Moshyk et al. (27) |
| SOF/VEL | ||||
| Utility CHC | 0.81 | 0.03 | Beta | Yun et al. (31), Ruggeri et al. (26) |
| Utility CC | 0.74 | 0.05 | Beta | Yun et al. (31), Ruggeri et al. (26) |
| Utility DC | 0.69 | 0.04 | Beta | Yun et al. (31), Ruggeri et al. (26) |
| Utility HCC | 0.58 | 0.04 | Beta | Yun et al. (31), Ruggeri et al. (26) |
| Utility LT | 0.56 | 0.032 | Beta | Yun et al. (31), Ruggeri et al. (26) |
| Utility Post LT | 0.71 | 0.02 | Beta | Yun et al. (31), Ruggeri et al. (26) |
| Utility SVR | 0.87 | 0.087 | Beta | Yun et al. (31), Ruggeri et al. (26) |
3.4. Cost-effectiveness Analysis
According to the results of the previous step, the Markov model was developed using Tree Age software, and the extracted data were imported into the model. The cost, effectiveness, and cost-effectiveness were calculated for all interventions by monetary units, QALYs, and cost per QALYs, respectively, according to the time horizon of the study. Furthermore, ICER was calculated using the ratio of the cost difference to QALYs difference between the compared options. Moreover, the ICER results were compared using a threshold to determine the cost-effectiveness of interventions in the country. The GDP was equal to 12,547 dollars in Iran, 2019, with which, the willingness-to-pay (WTP) threshold would be 12,547 (GDP*1) and 37,641 (GDP*3) in Iran (46).
3.5. Sensitivity Analysis
A one-way and probabilistic sensitivity analysis (PSA) was conducted on the results of the model in the present study to determine the certainty of the evidence of the results. It was attempted in one-way sensitivity analysis to change the key parameters of the model and provide it in the form of a tornado diagram; for this purpose, cost data were changed by 20%, and the effective values were changed for the dispersion obtained from other studies. Moreover, according to the probability distribution defined for the parameters imported to the model, a second-order Monte Carlo simulation was developed using 5,000 trials for sensitivity analysis, and the PSA results were displayed using cost-effectiveness acceptability curves and incremental cost-effectiveness scatter plots.
4. Results
4.1. Base-case Analysis
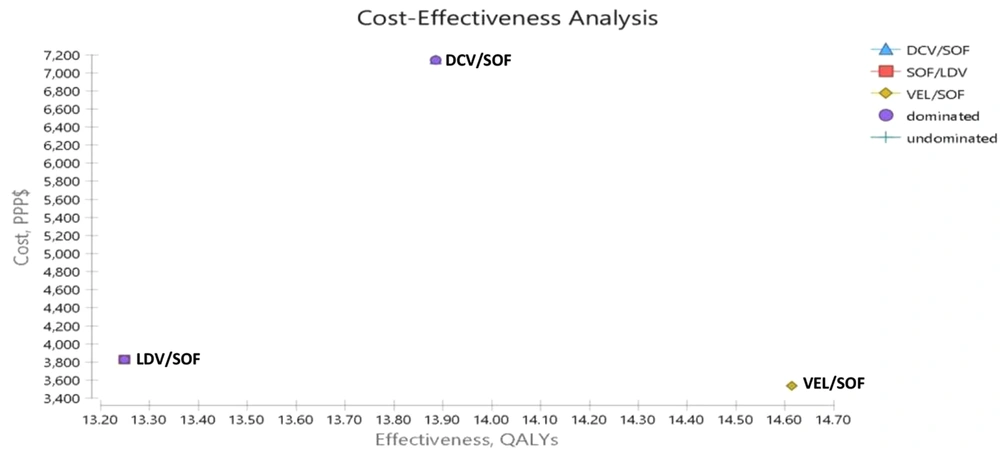
The results of cost-effectiveness obtained from the Markov Model estimation are provided in Figure 2 and Table 5 in the form of expected ICER, incremental QALYs, incremental cost, expected QALYs, and cost, in addition to the dominance of the three medication strategies in relation to each other in CHC patients. The results showed that the QALYs for LDV/SOF, DCV/SOF, and VEL/SOF were 13.25, 13.94, and 14.61, and the costs were 4807, 7716, and 4546 PPP$, respectively. Thus, the results of cost-effectiveness showed that LDV/SOF and DCV/SOF regimens had higher costs and lower QALYs than the VEL/SOF regimen, making it a dominant option. In fact, the ICER of VEL/SOF in relation to LDV/SOF and DCV/SOF was -192 and -4723 PPP$, respectively. Moreover, the DCV/SOF regimen had higher costs and lower QALYs than the VEL/SOF regimen, making it a dominant regimen. However, this regimen had an ICER of 4215 PPP$ compared to the LDV/SOF regimen, which was below the threshold, making it a cost-effective regimen compared to LDV/SOF.
| Strategy | Cost (PPP$) | Utility | Incremental Cost (PPP$) | Incremental QALYs | ICER (Incremental Cost per QALY Gained) PPP$ |
|---|---|---|---|---|---|
| Cost-effectiveness analysis | |||||
| LDV/SOF | 4807 | 13.25 | 262 | -1.37 | -192 |
| DCV/SOF | 7716 | 13.94 | 3170 | -.67 | -4723 |
| VEL/SOF | 4546 | 14.61 | - | - | Dominant |
Abbreviations: LDV/SOF, ledipasvir + sofosbuvir; VEL/SOF, velpatasvir + sofosbuvir; DCV/SOF, daclatasvir + sofosbuvir; QALY, quality-adjusted life-year; ICER, incremental cost-effectiveness ratio.
4.2. One-way Sensitivity Analysis
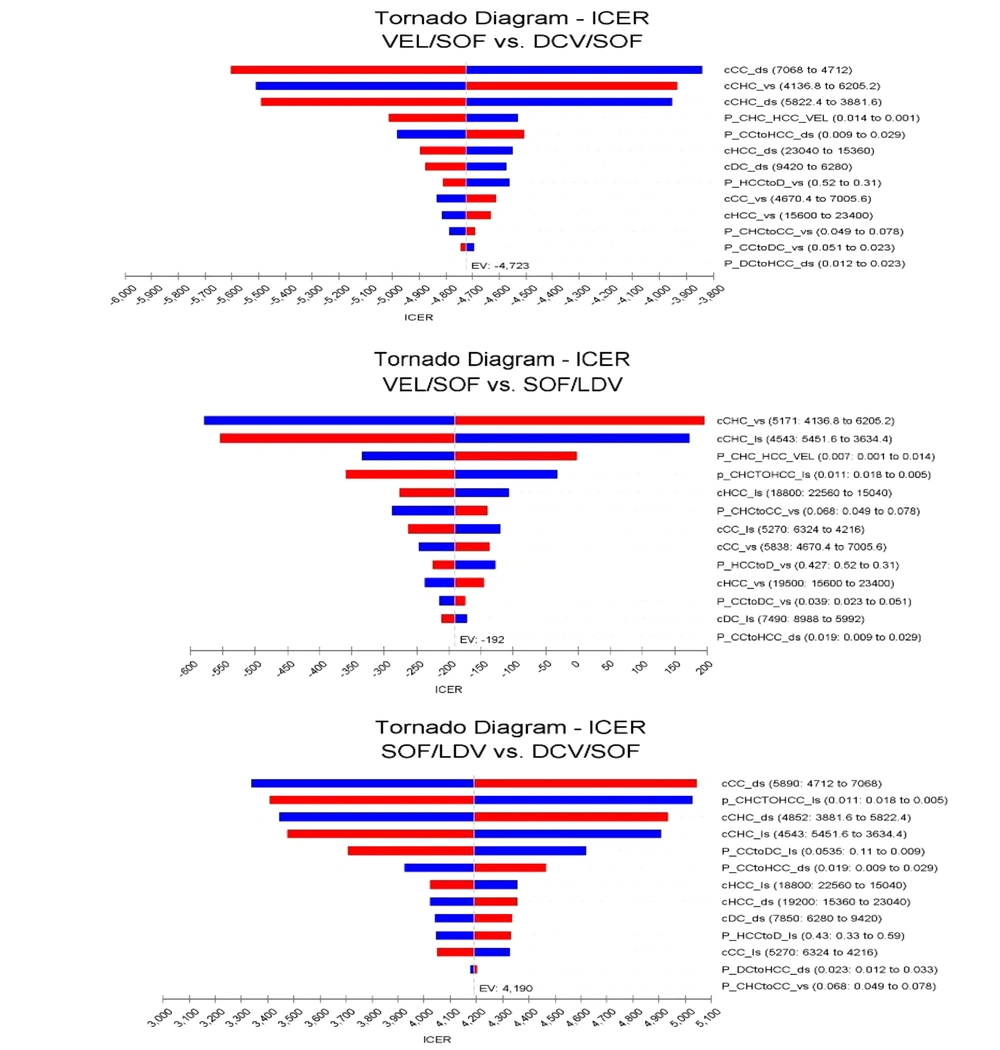
The tornado chart was used to show the sensitivity of the model to the effective variables. As shown in Figure 3, the ICERs resulted from the medication regimens LDV/SOF and LDV/SOF, DCV/SOF and VEL/SOF, and VEL/SOF and DCV/SOF were most sensitive to HCC and CC costs. Still, due to the ICER results below the threshold, these variables would not significantly impact the study results.
Tornado chart of the one-way deterministic analysis. The blue bar indicates that the high value of the parameter has been used, and the red bar indicates the low value of the parameter has been used. Abbreviations: LDV/SOF, Ledipasvir/Sofosbuvir; VEL/SOF, Velpatasvir/Sofosbuvir; DCV/SOF, daclatasvir/sofosbuvir.
4.3. Probabilistic Sensitivity Analysis (PSA)
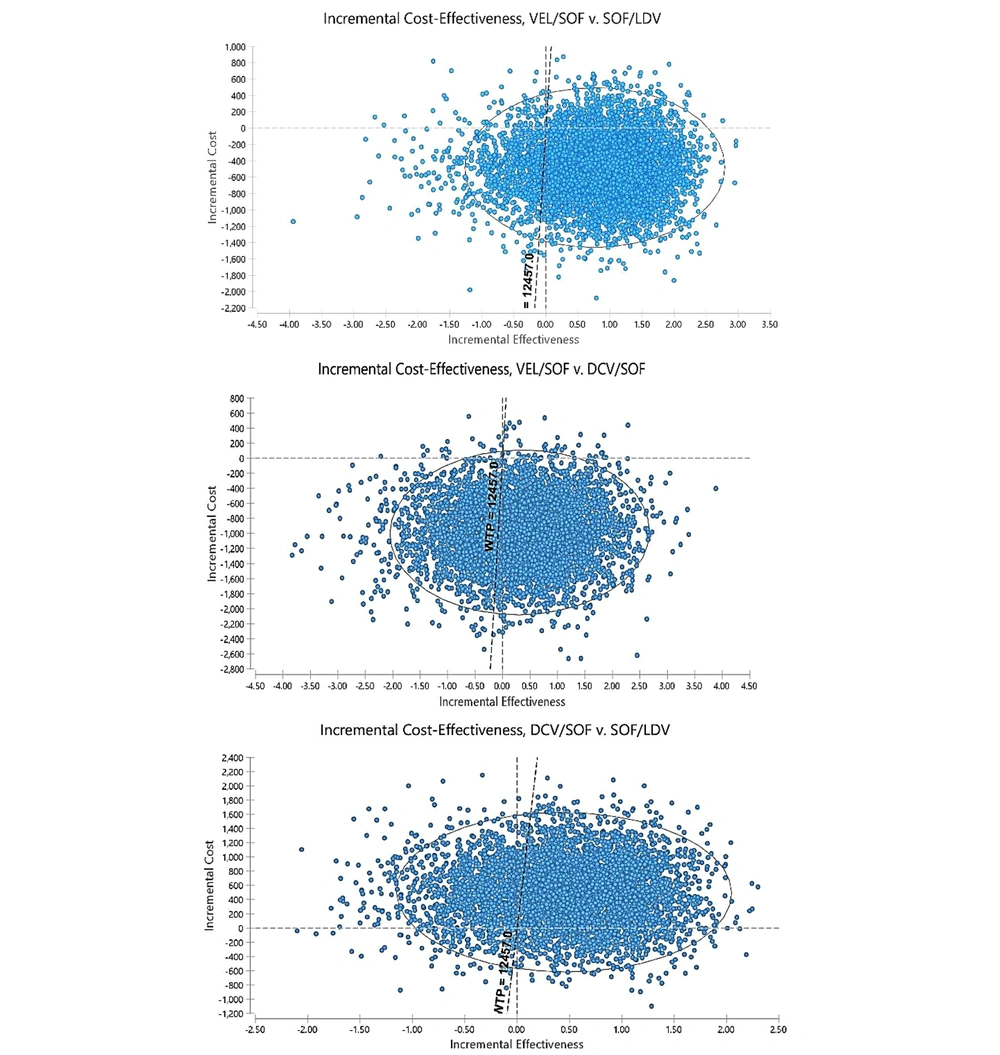
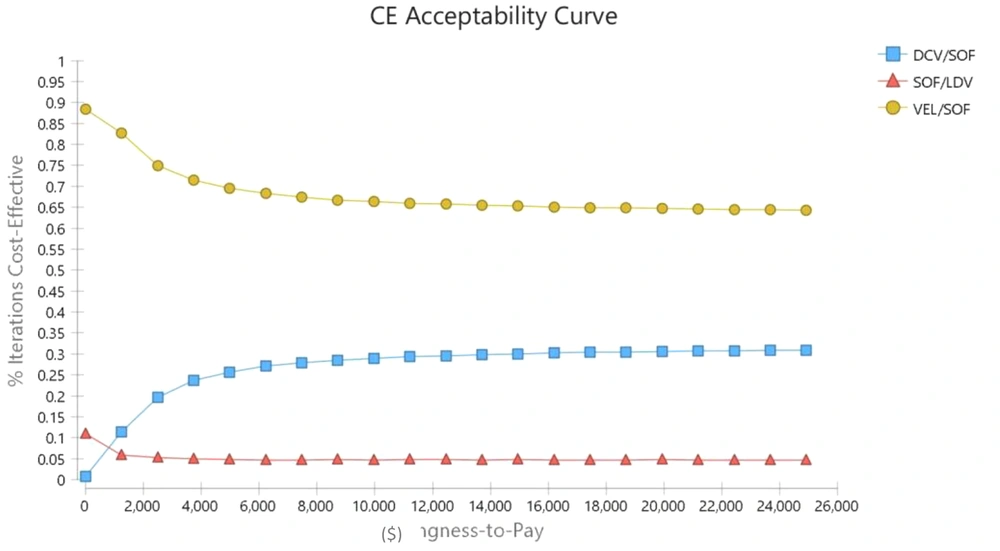
In PSA, all parameters are considered distribution instead of the single point due to the probability nature of variables. Moreover, the beta distribution was used to determine the distribution of utility values and transitional probabilities (which takes a value between 0 and 1), and the gamma distribution was used for costs. Therefore, a second-order Monte Carlo simulation was developed for PSA using 5,000 trials. The results of uncertainty are shown in the form of cost-effectiveness acceptability curves and incremental cost-effectiveness scatter plots in Figures 4 and 5.
Scatter plot of incremental cost-effectiveness obtained from Monte Carlo Simulation for new antiviral regimens in patients with chronic hepatitis C virus genotype 1 (The scatter plots show the difference in cost and QALY results of 5,000 simulations). Abbreviations: LDV/SOF, Ledipasvir/Sofosbuvir; VEL/SOF, Velpatasvir/Sofosbuvir; DCV/SOF, Clatasvir/sofosbuvir.
Moreover, the scatter plot results showed that VEL/SOF was the dominant therapeutic strategy in 73% of the simulations compared to LDV/SOF and 66% of the simulations compared to DCV/SOF; moreover, it was in the acceptable region in 92% of the simulations and below the threshold. Therefore, it dominated other regimens and was considered the most cost-effective strategy. Moreover, the results showed that DCV/SOF was in the acceptable region below the threshold in 69% of the simulations compared to LDV/SOF. Therefore, the DCV/SOF regimen was more cost-effective than LDV/SOF. Moreover, the results of the acceptability curve showed that given the threshold determined in the study, VEL/SOF, DCV/SOF, and LDV/SOF were the acceptable strategies in 65%, 25%, and 5% of the cases, respectively.
5. Discussion
Considering the minimal improvement of hepatitis C patients with genotype 1 using the available first-line medications and introducing novel medications, an economic assessment to determine the most cost-effective strategy among the available strategies seemed necessary. Therefore, the present study aimed to determine the most appropriate medication therapy protocols for hepatitis C patients while taking into account the cost-effectiveness and economic considerations, in addition to evaluating the cost-effectiveness of these medication therapies in these patients in the perspective of the Ministry of Health. Considering the conditions of the disease, the analysis was conducted using the Markov Model and a 5,000-individual simulation. The results showed that the VEL/SOF regimen was more cost-effective than the two other medication regimens. The study of Yashika Chugh (2019) evaluated the effectiveness of VEL/SOF in comparison with LDV/SOF and DCV/SOF in different scenarios. The results showed that VEL/SOF was more cost-effective than other therapeutic strategies, leading to cost-saving in treatments. The results of this study are in line with our study. It should be noted that the research was conducted on CHC patients with genotype 1, while our study population consisted of CHC patients with genotype 1. Moreover, utility scores in the present study were calculated locally, while in other studies, it was obtained by reviewing the evidence (47). Moreover, in another study by Corman et al. (2017) in the USA, comparing different antiviral medications in CHC patients, the results showed that VEL/SOF was more cost-effective than the two other strategies. This finding is in line with our study (48).
In this study, the QALYs and costs of the DCV/SOF regimen were more than those of LDV/SOF; however, by comparing the ICER obtained with the threshold, DCV/SOF was more cost-effective than LDV/SOF. Confirming these results, Ruggeri et al. (2019) conducted a study to assess the cost-effectiveness of two regimens DCV/SOF and LDV/SOF, in which the DCV/SOF regimen had higher costs and QALY than LDV/SOF and was considered more cost-effective compared to the threshold (26). Moreover, the results of our study are in line with those of Feld et al., Ahmed et al., and Mir et al. (45, 49, 50). The highest cost, which belonged to the DCV/SOF regimen, was 7,762 PPP$. In the study by Ferreira et al. (2019) on the desirability of five medication strategies VEL/FOF, ELB/GRA, DCV/SOF, LDV/SOF, and GLB/PIB, the QALYs of VEL/FOF, LDV/SOF, and DCV/SOF were the same, and the lowest costs belonged to VEL/SOF, LDV/SOF, and DCV/SOF. The cost results of the three medication strategies in this study are in line with the present research results (51). Moreover, the results of the one-way sensitivity analysis showed that the VEL/SOF regimen was more cost-effective than the two other medical strategies, which were placed in the acceptable range below the threshold and obtained the best results considering the costs. Therefore, the results showed that conducted sensitivity analysis did not change the VEL/SOF as the most effective medication regimen and DCV/SOF as the second treatment strategy compared to the LDV/SOF regimen, showing the robustness of the study results. Then, VEL/SOF with lower costs, higher effectiveness, and higher SVR was selected as the dominant therapeutic method. Therefore, to increase SVR, decrease the treatment period, increase patient's quality of life, increase efficiency during the treatment and afterward, and decrease disease complications and costs, it is suggested that this medication regimen be used (15, 37, 52, 53).
5.1. Study Limitations
The limitation of our study mainly concerned uncertainty in the dissemination of utility data that were obtained from foreign studies. Also, there were insufficient data on the mortality of CHC diseases for different health conditions in Iran. Moreover, given that our study was from the perspective of the health system, the patients' costs and their diminished efficacy were not considered. Also, in the model, according to the lack of sufficient information resources, we did not consider the side effects of medications.
5.2. Generalizability
As new antiviral medicine regimens can be used in referral centers in Iran, the results of this study can be generalized to the Iranian setting. As to other countries, other factors such as the threshold, payments system, and incidence and prevalence of HCV need to be considered.
5.3. Conclusions
In conclusion, according to the study results, it can be said that using the VEL/SOF regimen as the most effective treatment strategy and DCV/SOF as the second most effective treatment strategy in patients with hepatitis C, particularly those with genotype 1, could decrease the relevant complications, including DC, HCC, and mortality, and also decrease the disease costs and time, particularly if the patients are visited in early stages without cirrhosis and previous treatments. These medications could also be used as the first line in patients with previous treatment.

