


1. Background
Hepatitis B virus (HBV) is a serious global health problem that causes chronic hepatitis B (CHB) in roughly 257 million people worldwide, with 1 million deaths annually. Despite the development of HBV vaccines since 1982, over 2 billion of the world’s population has been infected with HBV. The most serious consequences attributed to CHB infection include liver cirrhosis and hepatocellular carcinoma (HCC) (1, 2).
Extrahepatic tissue tropism of HBV has been identified in peripheral blood mononuclear cells (PBMCs), and HBV has been detected in various tissues, such as bone marrow cells, spleen, and lymphoblastoid cell lines (3-5). Previous reports have indicated that HBV DNA is present in the serum of patients who have recovered from HBV infection (6, 7). Furthermore, HBV DNA is frequently detected in PBMCs of acute hepatitis B patients after clearance of serum hepatitis B surface antigen (HBsAg) (8). Productive HBV replication is documented by the detection of several HBV antigens (such as HBsAg and hepatitis B e antigen [HBeAg]), covalently closed circular DNA (cccDNA), messenger RNA (mRNA), and integrated forms of the virus genome in PBMC and other extrahepatic tissues (4, 9, 10). A previous study demonstrated that HBV DNA integration was observed in 57% of PBMC samples from HBV-related CHB patients (11). Moreover, activation of HBV replication in PBMC occurs following mitogen stimulation, leading to proliferative PBMCs and ultimately the reactivation of HBV infection (12). HBV DNA levels are a major determinant of disease progression and treatment monitoring. Also, cccDNA monitoring plays an important role in HBV infection and virus reactivation after antiviral drug withdrawal (13).
2. Objectives
In the present study, we carried out a sensitive TaqMan real-time polymerase chain reaction (PCR) assay for the detection of HBV DNA and cccDNA in serum and PBMC of different stages of HBV disease. We also explored the association between serum and PBMC viral loads.
3. Methods
3.1. Patients
The study was approved by the Ethics Committee of the Iranian Research Center for Clinical Virology of Tehran University of Medical Sciences (code: IR.NIMAD.REC.1396.396), and written informed consent was obtained from all participants. Treatment-naive patients with CHB (n = 30), patients with cirrhosis (n = 30), patients with HCC (n = 30), and 30 control subjects from December 2019 to February 2020 were enrolled in this cross-sectional study. CHB patients were enrolled based on the European Association for the Study of the Liver (EASL) criteria (14) as follows: HBsAg positive more than 6 months, serum HBV viral load more than 105 copies/mL, and persistent or intermittent elevations in alanine aminotransferase (ALT) and aspartate aminotransferase (AST) levels indicative of CHB. HBV infection was confirmed in all patients with positive HBsAg and without human immunodeficiency virus (HIV), hepatitis C virus (HCV), or hepatitis D virus (HDV). Samples from healthy participants with no history of liver disease were used as controls.
3.2. Serology and Liver Function Test
The samples were examined for serological markers of HBV infection (ie, HBsAg, anti-hepatitis B core [HBc], HBeAg, and anti-HBe) according to the commercially available enzyme-linked immunosorbent assay (ELISA) kit protocol (Acon, San Diego, CA, USA). Viral serology markers were retested using another ELISA kit (Dia.Pro, Italy). Serum biochemical parameters were measured with chemiluminescence assays.
3.3. HBV Genome Extraction and Quantification
Total HBV DNA was extracted from 200 μL of serum by the High Pure Viral Nucleic Acid Kit (Roche, Germany) according to the manufacturer’s recommendation, then stored at -20°C. HBV viral load was examined by the TaqMan quantitative real-time PCR reagent (Fast-Track Diagnostics, Luxembourg) with a dynamic range between 102 - 109 IU/mL and a lower detection limit of 85 IU/mL.
3.4. PBMC Isolation and HBV-DNA Detection and Quantification
PBMCs were isolated from 10 mL fresh whole blood samples by Ficoll density gradient centrifugation (Ambion, USA) at 1000g for 20 minutes at 20˚C. The cells were washed twice with phosphate-buffered saline (PBS) and centrifuged. Subsequently, the cell pellet was resuspended in 1 mL of PBS prior to DNA extraction. The isolated PBMCs were adjusted to 107 cells/mL and finally treated with deoxyribonuclease (DNase) I/trypsin to digest any extracellular HBV particles. PBMCs were stored at -70°C until analysis. The total HBV genome was extracted using the High Pure Viral Nucleic Acid Kit and quantified by sensitive, quantitative real-time PCR. HBV viral load was expressed in copies/mL as described previously (15). The HBV cccDNA was examined in PBMC by sensitive qualitative TaqMan real-time PCR assay as described previously (16). To avoid cross-contamination, all reactions included negative controls.
3.5. Nested PCR, HBsAg Sequencing, and Phylogenetic Analysis
The full sequence of the HBsAg gene for all positive samples was amplified using specific primers. Two rounds of nested PCR were applied for amplification of the HBsAg region of HBV DNA as described previously (17). The full HBsAg region of HBV DNA obtained from the second round of nested PCR was sequenced bilaterally using an Applied Biosystems 3130 Genetic Analyzer (Genetic Analyzer ABI-3130 DNA Sequencer, Foster City, CA, USA). Genotyping was performed by phylogenetic analysis with reference sequences of HBV genotypes (A to H). A maximum likelihood (ML) tree was created using the alignment of the HBsAg gene of subjects by rooting with a woodchuck hepatitis virus (WHV). The phylogenetic tree was generated utilizing MEGA X software, and genetic differences were estimated using the Kimura 2-parameter model (18). Bootstrap resampling and reconstruction were performed 1000 times to evaluate the credibility of the phylogenetic tree (19).
3.6. Statistical Analysis
Data were expressed as mean ± SD. The categorical variables were compared using the χ2 test, as appropriate. The normality of continuous variables was evaluated using the Kolmogorov-Smirnov test. The Mann-Whitney U test was used for non-normally continuous variables. Pearson correlation was performed for variables. SPSS version 24 (SPSS Inc, Chicago, Illinois, USA) was used for the statistical analysis, and P values less than 0.05 were considered significant for all tests. All the correlations were significant at the < 0.01 level (2-tailed).
4. Results
4.1. General Characteristics of Study Patients
A total of 120 participants (including 30 healthy controls, 30 CHB patients, 30 cirrhosis patients, and 30 HCC patients) were enrolled in this study. The demographic and clinical features of the patients are shown in Table 1. In total, 69 (57.5%) were males, and 51 (42.5%) were females with a mean ± SD age of 50.34 ± 10.16. The mean levels for liver injury tests (including ALT and AST) were significantly different between groups.
| Variables | All Subjects (N = 120) | Normal (N = 30) | CHB (N = 30) | Cirrhosis (N = 30) | HCC (N = 30) | P-Value |
|---|---|---|---|---|---|---|
| Sex, No. (%) | 0.585 | |||||
| Male | 69 (57.5) | 15 (50) | 16 (53.3) | 18 (60) | 20 (66.7) | |
| Female | 51 (42.5) | 15 (50) | 14 (46.7) | 12 (40) | 10 (33.3) | |
| Age | 50.34 ± 10.16 | 45.50 ± 7.16 | 46.57 ± 11.53 | 55.18 ± 8.49 | 54.77 ± 9.36 | 0.017 |
| ALT | 48.57 ± 27.71 | 26.91 ± 3.88 | 30.93 ± 13.44 | 78.91 ± 23.62 | 60.23 ± 24.81 | < 0.001 |
| AST | 45.49 ± 21.37 | 24.91 ± 5.22 | 35.92 ± 11.00 | 69.03 ± 21.66 | 53.31 ± 14.67 | < 0.001 |
| HBV-DNA (PBMC) | 0.07 | |||||
| Positive | 58 (48.3) | 0 (0) | 13 (43.3) | 20 (66.7) | 25 (83.3) | |
| Negative | 62 (51.7) | 30 (0) | 17 (56.7) | 10 (33.3) | 5 (16.7) | |
| HBeAg, No. (%) | < 0.001 | |||||
| Positive | 37 (30.8) | 0 (0) | 2 (6.7) | 16 (53.3) | 19 (63.3) | |
| Negative | 83 (69.2) | 30 (0) | 28 (93.3) | 14 (46.7) | 11 (36.7) | |
| HBV viral load (Serum), copies/mL | (Median: 11,524; Range: 1594 - 45,560,074) | - | (Median: 6432; Range: 1594 - 41,014) | (Median: 57,452; Range: 3336 - 5,563,240) | (Median: 750,847; Range: 3756,-,45,560,074) | 0.009 |
| HBV viral load (PBMC), copies/mL | (Median: 5655; Range: 542 - 98,741) | - | (Median: 997; Range: 542 - 7106) | (Median: 5564; Range: 970 - 55,987) | (Median: 32,609; Range: 667 - 98,741) | 0.003 |
| HBV cccDNA | - | 0.025 | ||||
| Positive | 35 (29.9) | 6 (20) | 13 (43.3) | 16 (53.3) | ||
| Negative | 85 (70.8) | 24 (80) | 17 (56.7) | 14 (46.7) |
Demographic and Clinical Characteristics of HBV Patients
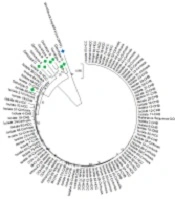
Of the 90 HBsAg-positive patients, 37 (41.1%) were positive for HBeAg, and 2 (6.7%), 16 (53.3%), and 19 (63.3%) were tested positive for HBeAg in CHB, cirrhosis, and HCC groups, respectively. The results of the statistical analysis indicated a statistical association between the groups in terms of HBeAg status (P < 0.001). The patients were Iranian and HBV genotype D/subtype ayw2 positive (Figure 1). Several mutations were found in the “a” determinant region of surface antigen (amino acid residues from 124 to 147). Overall, 8 (8.9%) patients harbored amino acid missense mutation in the “a” determinant of HBeAg (CHB = 2, cirrhosis = 2, and HCC = 4).
![Maximum likelihood phylogenetic tree construction based on ClustalW alignment of HBsAg sequences (681 base pairs [bp]) of 90 HBV isolates from patients](https://services.brieflands.com/cdn/serve/3170b/e32152f3772097ce9d71736fc518117721308b48/hepatmon-120982-i001-F1-preview.webp "Maximum likelihood phylogenetic tree construction based on ClustalW alignment of HBsAg sequences (681 base pairs [bp]) of 90 HBV isolates from patients")
Maximum likelihood phylogenetic tree construction based on ClustalW alignment of HBsAg sequences (681 base pairs [bp]) of 90 HBV isolates from patients
4.2. Prevalence of HBV DNA cccDNA Presence in PBMC
Of the 90 HBV patients, 58 (64.4%) were positive for the HBV genome in PBMC. The HBV genome was detected in PBMCs isolated from 13/30 CHB, 20/30 cirrhosis, and 25/30 HCC patients. The results of the chi-square test indicated statistical associations between groups in terms of HBV genome positivity in PBMCs (P = 0.07). Among the selected individuals, 35 (38.9%) of patients (n = 90) were positive for HBV cccDNA. Six (20%) of CHB, 13 (43.3%) of cirrhosis, and 16 (15.3%) of HCC patients were cccDNA positive by using real-time PCR. Further, cccDNA distribution was higher in cirrhosis and HCC patients than in CHB patients with statistical associations (P = 0.025).
4.3. Finding of HBV Viral Load in Serum and PBMC
The evaluation of HBV DNA levels of serum and blood cells in HBV patients is presented in Figure 2. In CHB patients, the HBV genome was detected and quantified in all serum specimens and 13 (43.3%) PBMC specimens; median viral loads in serums and PBMCs were 6432 copies/mL (range, 1594 to 41,014 copies/mL) and 997 copies/mL (range, 542 to 7106 copies/mL), respectively. In patients with cirrhosis, the virus genome was quantified in serum specimens and 20 PBMC isolates (66.7%); median viral loads in serums and PBMCs were 57,452 copies/mL (range, 3336 to 5,563,240 copies/mL) and 5564 copies/mL (range, 970 to 55,987 copies/mL). In HCC patients, the HBV genome was quantified in serum specimens and 25 PBMC isolates (83.3%); median hepatitis B viral loads in serums and PBMCs were 750,847 copies/mL (range, 3756 to 45,560,074 copies/mL) and 32,609 copies/mL (range, 667 to 98,741 copies/mL). Comparing viral quantities in serums and PBMCs demonstrated significant associations between different patient groups (P < 0.001).

Comparison of HBV DNA levels in serums and PBMCs of different HBV-associated diseases
HBeAg-positive patients had a median serum HBV viral load of 744,364 copies/mL (range, 11,029 to 45,560,074 copies/mL), whereas HBeAg-negative patients had a median serum viral load of 7524 copies/mL (range, 1594 to 756,017 copies/mL). HBeAg-positive patients had statistically higher serum HBV viral loads compared with HBeAg-negative ones (P < 0.001). HBeAg-positive patients had a median serum viral load of 74,4364 copies/mL (range, 11,029 to 45,560,074 copies/mL), whereas HBeAg-negative patients had a median serum HBV viral load of 7524 copies/mL (range, 1594 to 756,017 copies/mL). The median viral load in PBMC of HBeAg-positive patients was 17,824 copies/mL (range, 3784 to 98,741 copies/mL), which was substantially more than that of patients without an HBeAg marker (median 1072 copies/mL; range, 542 to 91,536 copies/mL; P < 0.001).
Among the selected participants, in the cccDNA positive patients, 24 (68.6%) patients were from HBeAg-positive samples and 11 (31.4%) patients from HBeAg-negative samples, and the association was statistically significant (P < 0.001).
4.4. Correlation Between Serum and PBMC Viral Loads
The result of the Pearson correlation test showed a positive correlation between viral DNA levels in serums and peripheral blood nuclear cells of patients (r = 0.855; P < 0.001). In HBeAg-positive patients, the viral DNA levels in blood cells significantly correlated with the HBV DNA levels in serums (r = 0.532; P = 0.002). Also, there was a significant correlation between PBMC HBV viral loads and serums in HBeAg-negative patients (r = 0.731; P < 0.001).
5. Discussion
Few studies have clarified the relationship between the HBV DNA loads in PBMCs and serums, and our knowledge is limited regarding the presence of HBV cccDNA in patients suffering from cirrhosis and HCC. The clinical importance of HBV lymphotropism is poorly understood, but epidemiological investigations suggest an increased risk of lymphoid neoplasms, including non-Hodgkin lymphoma (NHL) and chronic lymphocytic leukemia (CLL) (19-22). In the present study, we hypothesized that the presence of HBV genomes in PBMC and the viral copy numbers are associated with hepatitis B-related diseases and may be correlated with the development of HCC.
In the current study, the HBV genome was detected in whole PBMC of 58/90 (64.4%) patients. We found that the HBV viral load in serums and PBMCs of HCC patients were statistically more than CHB and cirrhosis patients (P < 0.001). Previous studies have indicated that the HBV genome from CHB patients exists in PBMCs, and HBV DNA levels in peripheral blood nuclear cells statistically correlated with serum viral load (15, 20), which is consistent with our findings. However, no comprehensive study has been investigated the HBV DNA presence and HBV viral loads in PBMC of cirrhosis and HCC cases. The interplay between HBV and PBMCs appears to be an important approach during the progression of HBV infection (21). Several immune cells strongly decrease in hepatitis B patients, and some genes regulating the immune system are mutated by the virus (22, 23). Following clinically resolved infections, cccDNA appears not only in liver cells but also emerges in leukocytes, revealing that HBV may lead to blood cell impairment in PBMCs (24, 25). Also, dendritic cells infected with HBV have been reported to display functional disruption (26).
In several clinical studies, patients with high serum viral loads had a strongly higher risk of HCC than those with low HBV DNA levels (27). Hepatitis B antiviral therapy may help to improve the clinical consequences of individuals with HCC. However, the effects of antiviral therapy and reduction of PBMC viral load in HBV-related HCC have not been investigated. Ke et al indicated that HBV antiviral therapy (lamivudine) had considerable suppressive effects on virus amplification in serum and blood cells. However, the reduction rate on HBV viral load in PBMC samples is weaker than that in serum samples (28). However, a longitudinal study performed by Lu et al indicated that lamivudine therapy had few effects on HBV quantification in PBMCs compared to HBV viral loads in serums, which was reduced strongly during HBV treatment (20). There is a possibility that the emergence and persistence of HBV DNA in PBMCs and high viral loads are considered potential risk factors in HCC.
Moreover, 35 out of 90 patients (38.9%) were positive HBV cccDNA. Significant associations were found between the HBV study groups regarding cccDNA presence in PBMCs. Earlier studies reported that cccDNA could not be detected in blood cells (29); however, the detection of cccDNA in PBMC from CHB patients with high HBV viral load was then demonstrated by researchers (9). Another study indicated that 16% (8 out of 50) and 74% of PBMCs in CHB patients were positive for cccDNA and pregenomic RNA (pgRNA), respectively (20). In our study, we did not evaluate HBV pgRNA in PBMCs of patients. However, we know that cccDNA is a substantial replicative template during the HBV replication process, and cccDNA is an intermediate for pgRNA synthesis. Thus, 1 or few HBV cccDNA molecules may synthesize more pgRNA transcripts.
The current study demonstrated that the presence of the HBV genome in PBMC was related to HBeAg status. The identification rate of the HBV genome in PBMCs of patients without HBeAg was statistically lower than that in positive-HBeAg patients (P < 0.001). In parallel, positive-HBeAg patients had significantly higher viral loads in PBMC than negative-HBeAg patients. The latest results indicate that HBeAg status may not only be an indicator of robust HBV replication in liver cells and high viral infectivity (30) but also a signature of HBV DNA levels in PBMCs in several stages of hepatitis B infection and progression of the disease. The correlation between the HBV DNA loads in PBMCs and serums is probably justified by the Untergasser et al study (26). Uptake of HBV particles from serum may lead to the virus entry into blood leucocytes.
The direct sequencing output from 90 HBsAg sequences indicated that all belonged to HBV genotype D. Recent investigations from several regions of Iran have indicated that genotype D is the only circulated HBV genotype (31). HBV viral load evaluations and genotyping have become important for predicting HBV disease severity, performed for treatment guidelines detecting the emergence of antiviral drug resistance (32, 33). A report revealed that the HBV DNA level is an important indicator of the risk of liver cirrhosis, HCC, and death in CHB patients (33). HBV genotype D has a global prevalence; however, it appears to be more distributed in the Mediterranean region, Africa, Europe, and India (34).
5.1. Conclusions
To the best of our knowledge, this is the first investigation to explore the frequency of HBV DNA and cccDNA in different stages of hepatitis B disease. Probably, high HBV viral load in serum of HBV patients can efficiently increase HBV DNA levels in PBMCs. HBV quantifications in serum correlated with PBMC viral load, and HBV genomes in PBMC may be a risk factor for monitoring HBV disease progression.
