1. Background
Hepatitis B virus (HBV) possesses hepatic tropism and annular double-stranded DNA. This virus causes acute and chronic hepatitis B (CHB) in humans. Chronic hepatitis B (CHB) is the ultimate central stimulus for worldwide cirrhosis, hepatocellular carcinoma (HCC), and hepatic failure (1). Although effective antiviral drugs and vaccines are available, HBV disease remains a well-being trouble. Furthermore, the virus still infects approximately 350 million people and contributes to the morbidity and mortality associated with viral hepatitis (2). Therefore, discovering new methods is necessary to develop effective early diagnostic and treatment strategies. A minimally invasive procedure, such as obtaining blood, can be an attractive alternative to liver biopsy (3).
Peripheral blood mononuclear cells (PBMCs) are an essential immune system element. Interestingly, examining critical genes in PBMCs has shown the relationship between altered gene expression and diseases. In different diseases, PBMCs are used for monitoring gene expression. It has been proposed that changed gene expression in PBMCs might be employed as a potential clinical tool for collecting data since it can give insight into the diagnosis or prognosis of the disease (4). The identification of new biomarkers may assist in disease management and interventions to decrease mortality rates. For example, examining the transcriptional profile modifications in HCC and CHB patients’ PBMCs might help predict and determine HCC (5).
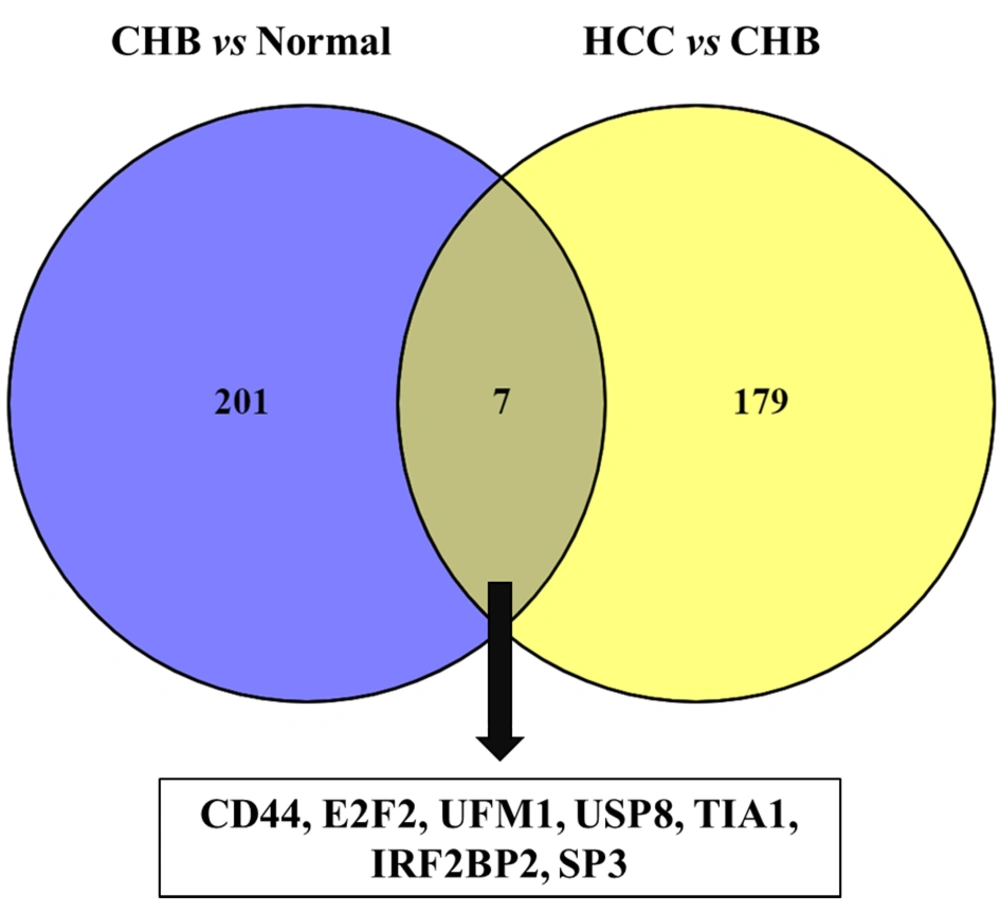
Our previous study acquired comprehensive transcription analyses from the Gene Expression Omnibus (GEO) database with code GSE58208 (6). This databank includes PBMCs to evaluate the transcript in three subjects: CHB, HCC, and healthy controls. We showed that most differentially expressed genes (DEGs) in CHB carriers and HCC patients are related to the immune response. Also, 208 genes were differentially expressed among normal and CHB patients (normal-CHB). Moreover, 186 genes were differentially expressed among CHB and HCC patients (normal-CHB). Our analysis found that the normal-CHB and CHB-HCC networks only comprised 201 and 179 DEGs. Seven common genes were found in both groups, including CD44, SP3, USP8, E2F2, UFM1, IFN regulative factor binding protein 2 (IRF2BP2), and T-cell intracellular antigen 1 (TIA1) (Figure 1). Of interest, six of these seven DEGs were upregulated in CHB-HCC compared with normal-CHB. However, an independent experimental method should evaluate gene expression data to ensure the obtained results. Accordingly, our study examined the expression of genes mentioned above using qRT-PCR in PBMC specimens from CHB and HCC.
2. Objectives
This investigation analyzed the gene expression pattern of CD44, SP3, USP8, E2F2, UFM1, IRF2BP2, and TIA1 obtained from transcriptome analysis.
3. Methods
3.1. Patients
This study was conducted between August 2020 and February 2022. Eighty-five whole blood samples were collected from healthy subjects (n = 30), treatment-naïve CHB patients (n = 30), and primary HCC patients (n = 25). Demographic information, such as gender and age, and laboratory information, like serological and biochemical tests, were obtained from all patients. Patients with immunosuppression, hepatitis C virus (HCV), and hepatitis D virus were excluded. Healthy controls without HBV, HCV, or human immunodeficiency virus, were selected; they also had normal liver function tests and no history of liver disease. In addition, HBsAg positivity, levels of serum alanine transaminase (ALT) and aspartate transaminase (AST) for at least six months, HBsAg/Anti-HBe status, HBV viral load, and histopathological evidence were considered criteria for inactive CHB carriers. All participants gave informed consent, and the Tabriz University of Medical Sciences Ethics Committee authorized the study.
3.2. Laboratory Tests, Hepatitis B Virus DNA Extraction, and Quantitative Real-time PCR
The ALT and AST levels were determined in all 85 blood samples. Furthermore, HBV serological markers such as HBsAg, HBeAg, and anti-HBe were assessed using commercialized enzyme-linked immunosorbent assay (ELISA) kits (Acon, USA) as maintained in the factory’s protocol. Hepatitis B virus DNA was sequestered from a 200 μL aliquot of serum utilizing a High Pure Viral Nucleic Acid Kit (Roche, Germany) as reported in the manufacturer’s protocol. Next, to elute the DNA, 50 μL of elution buffer was utilized, which was subsequently stored at -70°C. Regardless of serological results, HBV viral load was determined in all specimens using a qRT-PCR kit (Fast-Track Diagnostics, Luxembourg) as reported in the manufacturer’s protocol. The kit protocol specifies a lower limit of detection (LOD) of 500 copies/mL.
3.3. Nested PCR, Sequencing, and Phylogenetic Analysis of HBsAg
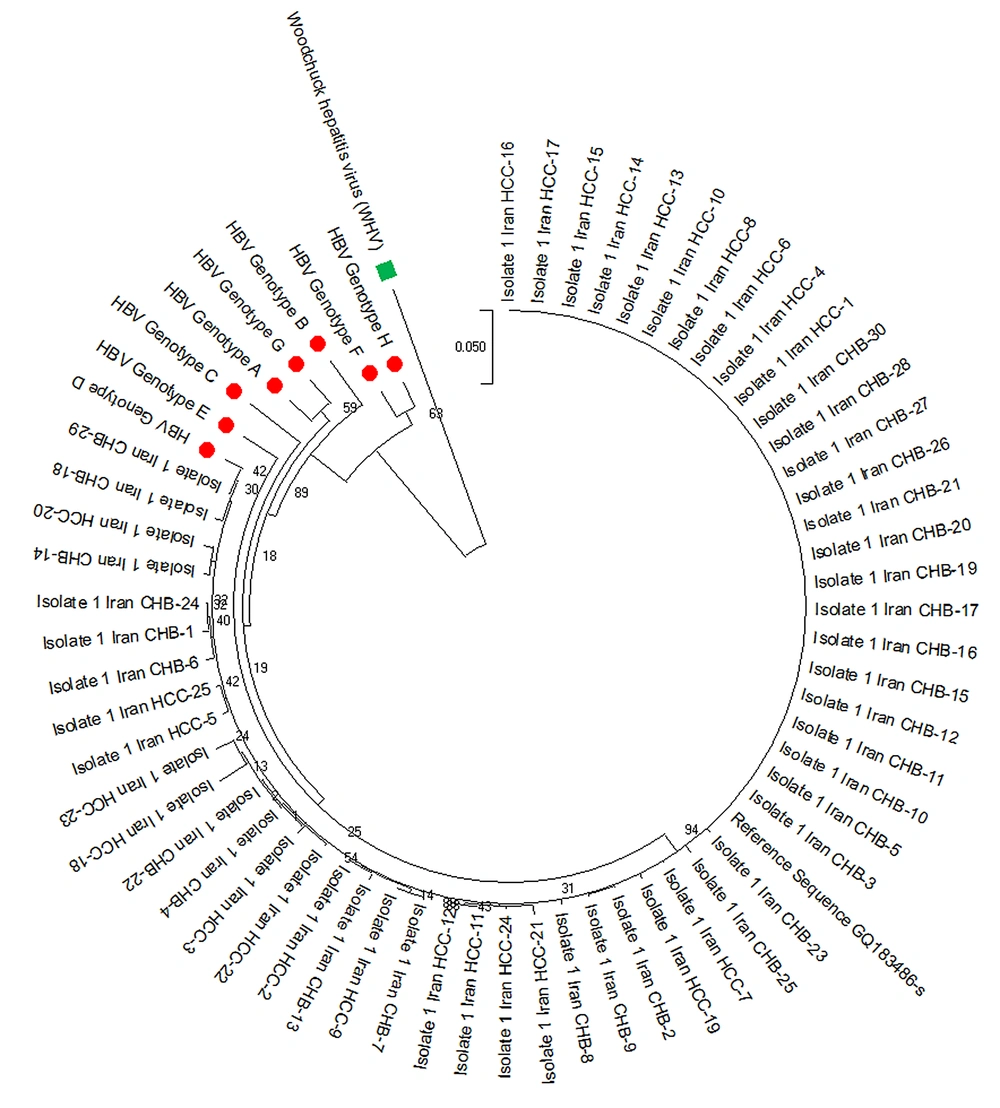
The complete sequences of the HBsAg gene were amplified for all positive samples using specific primers. As depicted, two rounds of nested PCR (N-PCR) were used to expand the HBsAg area within the virus genome (7). The whole HBsAg segment of the HBV genome was sequenced by ABI 3130 Hereditary Analyzer (Hereditary Analyzer ABI-3130 DNA Sequencer, Cultivate City, CA, USA). Phylogenetic analysis was used for genotyping HBV genotypes A through H utilizing reference sequences. A maximum likelihood (ML) phylogenetic tree was constructed using the alignment of HBsAg region of patients by rooting with a woodchuck hepatitis virus (WHV) sequence. The MEGA X program was used to generate the phylogenetic tree, and the Kimura two-parameter matrix was used to measure genetic distance (8). Bootstrap resampling and rebuilding were performed 1000 times to validate the phylogenetic tree’s reliability (9).
3.4. Peripheral Blood Mononuclear Cell Isolation, RNA Extraction, and Complementary DNA Synthesis
Ficoll density gradient centrifugation (Ambion, USA) extracted PBMCs from 5 mL of fresh whole EDTA-treated blood for 20 minutes at 20°C at 1,000x g. PBMCs were pelleted in phosphate-buffered saline (PBS). Washed and pellet cells were put in 1 mL of RPMI before being taken to the RNA extraction step. The whole RNA was isolated from PBMCs utilizing TRIzol reagent (Ambion, USA), following the manufacturer’s instructions. RNase-free DNase I (Qiagen, Germany) was used to annihilate genomic DNA impurity from RNA samples. The concentration of total RNA extracted was measured using a nanodrop spectrophotometer (Boeco, Germany). Before being stored at -70°C, the isolated RNA was adjusted to a final concentration of 1 mg/ml. Finally, complementary DNA (cDNA) synthesis was carried out utilizing the cDNA synthesis kit (Qiagen, Hilden, Germany) based on the manufacturer’s protocols.
3.5. Relative Quantitative Real-time PCR
The whole RNA was extracted from PBMCs utilizing TRIzol reagent (Ambion, USA) in conformity with the producer’s recommendations. The relative expression of mRNAs (CD44, SP3, USP8, E2F2, UFM1, IRF2BP2, and TIA1) turned into measured using Real Q Plus 2x Master Mix Green (Ampliqon, Denmark). PCR protocols were as follows: initial denaturation at 95°C for 10 min, followed by 40 cycles of PCR at 95°C for 15 s and 57°C for 30 s. Glyceraldehyde-3-phosphate dehydrogenase (GAPDH) was used as a reference gene to evaluate the linearity and accuracy of RT-PCR. Table 1 lists the primers used in this assay. Based on the 2-ΔΔCT method, mRNA expression templates were investigated (10). Relative values of each gene were expressed as fold change to compare mRNA levels between patients.
| Genes and Direction | Primer Sequence (5’ to 3’) |
|---|---|
| CD44 | |
| Forward | CTGCAGGTATGGGTTCATAG |
| Reverse | ATATGTGTCATACTGGGAGGTG |
| UFM1 | |
| Forward | CCGTTCACAGCAGTGCTAAA |
| Reverse | CCGTGCTTCAGGAAAACA |
| E2F2 | |
| Forward | CCTTGGAGGCTACTGACAGC |
| Reverse | CCACAGGTAGTCGTCCTGGT |
| TIA1 | |
| Forward | GTGTCCTGAGAGAGCAAGCA |
| Reverse | CCACTCGGGCATCTCTCAAA |
| SP3 | |
| Forward | CCAGGATGTGGTAAAGTCTA |
| Reverse | CTCCATTGTCTCATTTCCAG |
| IRF2BP2 | |
| Forward | AGTTCTGCTTCCCTTGCTCC |
| Reverse | AGGATGGTTGCAATTTCCCC |
| USP8 | |
| Forward | GACGCCACCTGCATCTATAGAAG |
| Reverse | GGAAAGTAAAACTGTCCTGCGCAA |
| GAPDH | |
| Forward | CCCTGAACGCTATCACTGCA |
| Reverse | CCATCACGCCACAGTTTC |
3.6. Statistical Analysis
The data were expressed as percentage and mean ± standard deviation. The differences of categorical variables were investigated using chi-square test. The normal distribution was estimated using the Kolmogorov-Smirnov (K-S) test. The Mann-Whitney U test was used for non-normal continuous variables. IBM SPSS Statistics 24 (SPSS Inc., Chicago, Illinois, USA) was used for statistical analysis. P-values lower than 0.05 were supposed to be significant for all tests.
4. Results
4.1. General Characteristics of Patients
Demographic and clinical specifications of all 85 subjects, including healthy controls (n = 30), CHB patients (n = 30), and HCC patients (n = 25), are summarized in Table 2. Of the 85 participants, 44 (51.8%) and 41 (48.2%) were male and female. There was no significant difference between the studied groups in gender (P-value = 0.213). The average age of CHB and HCC patients was 45.86 ± 11.02 and 58.60 ± 6.92, respectively. Statistically, there was a significant difference between CHB and HCC patients in age (P-value < 0.001). In terms of liver injury enzymes (ALT and AST), we found statistical differences between HCC and CHB patients (P value < 0.001). Also, the HBV viral load was higher in HCC patients compared to the CHB patients (P-value < 0.0001).
| Factors | All Subjects (n = 85) | Healthy Controls (n = 30) | Chronic Hepatitis B Virus (n = 30) | Hepatocellular Carcinoma (n = 25) | P-Value |
|---|---|---|---|---|---|
| Sex | 0.213 | ||||
| Male | 44 (51.8) | 16 (53.3) | 12 (40) | 16 (51.8) | |
| Female | 41 (48.2) | 14 (46.7) | 18 (60) | 9 (48.2) | |
| Age (y) | 50.22 ± 10.60 | 47.07 ± 8.19 | 45.86 ± 11.02 | 58.60 ± 6.92 | < 0.001 |
| ALT (IU/L) | 42.70 ± 22.38 | 26.80 ± 4.02 | 34.57 ± 13.50 | 66.20 ± 20.61 | < 0.001 |
| AST (IU/L) | 42.39 ± 23.37 | 24.93 ± 5.47 | 36.57 ± 9.46 | 65.27 ± 25.37 | < 0.001 |
| Viral load (Log2 copies/mL) | 15.12 ± 3.37 | - | 12.42 ± 1.10 | 17.83 ± 2.57 | < 0.001 |
| HBeAg | < 0.001 | ||||
| Positive | 20 (23.5) | 0 (0) | 0 (0) | 15 (60) | |
| Negative | 65 (76.5) | 30 (100) | 30 (100) | 10 (10) |
a Values are expressed as No. (%) or mean ± SD.
In HCC patients, 60% (n = 15) were positive for HBeAg. All CHB patients were negative for HBeAg, but all were positive for anti-HBe. A comparison was made between HCC and CHB subjects. Statistical analysis revealed a significant difference between HCC and CHB patients in HBeAg status (P-value < 0.001). HBV DNA was quantified in serum samples. The HBV load was significantly higher in HCC patients than in CHB subjects (P-value < 0.001).
4.2. Phylogenetic and Mutational Analysis
The sufferers were of the Iranian race and genotype D for HBV (Figure 2). Several mutations were observed in the “a” determinant location of HBsAg (amino acid residues 124 to 147). Six (3.6%) affected individuals had an amino acid spurt in the “a” designation. According to the number of mutations/sites, the average nucleotide mutation frequency (dN/dS) across all sequences was less than one. A dN/dS ratio of less than one indicated negative selection pressure or sequence stability for the HBsAg gene.
4.3. Distinct mRNA Signature in Hepatocellular Carcinoma Patients
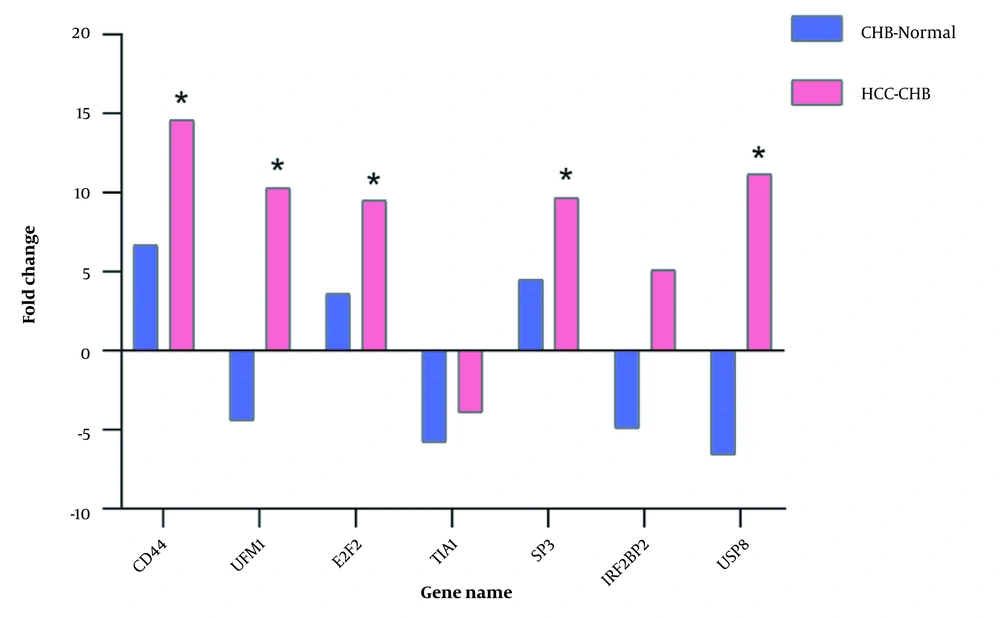
We evaluated the relative expression of a panel of genes (CD44, SP3, USP8, E2F2, UFM1, IRF2BP2, and TIA1) and detected a specific mRNA signature in HCC sufferers compared to CHB sufferers and healthy subjects (Figure 3). PCR results showed that five out of seven genes (CD44, SP3, USP8, E2F2, and UFM1) were significantly upregulated in the PBMCs of HCC patients, which was almost similar to the results of the initial microarray data analysis. Patients with HCC were comparable to normal subjects, and the levels were identical to the previous results (data not shown). These findings indicate that the abovementioned genes might be associated with HCC progression. Our last microarray surveys showed that the mRNA level of IRF2BP2 was considerably upregulated in HCC patients. Also, the mRNA level of TIA1 was downregulated in CHB sufferers. However, qRT-PCR data showed that the dysregulation of IRF2BP2 and TIA1 genes in the patient group was mild and statistically insignificant.
5. Discussion
Hepatocellular carcinoma is a leading cause of death in individuals with cirrhosis and is one of the significant cancers worldwide (11). In parts of Asia, the higher rate of HCC resulted from a high prevalence of hepatitis B and C virus infections (12). Hepatocellular carcinoma incidence has been on the rise for the past 40 years, and the diagnosis of HCC can often be challenging (13). Despite significant advances in the diagnosis and treatment of HCC over a long period, the prognosis of HCC remains poor (14). To improve the prognosis of HCC, diagnosing the tumor in the early stages is crucial when patients are asymptomatic and their liver function is preserved. This situation enables effective therapies with significant survival benefits to be applied (15). As a result, investigating the biomarkers for the early detection, treatment, and prognosis of HCC is important and fundamental.
For a long time, inventive bioinformatics and computational procedures have been successfully connected to a wide assortment of oncology inquiries (16). Microarray and high-throughput innovations have given an effective method to filter thousands of genes that might be implicated in the occurrence and advancement of HCC. Hence, these genes can serve as potential targets for diagnosing and treating HCC (17). Furthermore, the microarray technique provides an effective tool to explore gene regulation patterns and molecular mechanisms associated with the oncogenesis and progression of HCC. Numerous studies from other researchers and a couple of our previous investigations have merely been perpetrated based on a pure system biology approach and a bioinformatics attitude for gene expression analysis. Our previous study was a computational analysis and network-based investigation (6) but not an experimental examination. However, further validation tests may lead to an improvement in our credibility. Also, others have used PBMC transcriptome analysis to elucidate pathogenesis and detect specific biomarkers, for instance, in individuals suffering from hepatitis B-related acute-on-chronic hepatic failure (18).
In our prior investigation, we conducted a network-based study for the transcriptome of PBMCs in three subjects, including healthy controls and CHB and HCC patients. CD44, SP3, USP8, E2F2, UFM1, IRF2BP2, and TIA1 were normal in patients with CHB-CHB and CHB-HCC systems. Except for TIA1, the expression of other genes was upregulated in CHB-HCC and downregulated in normal-CHB subject (6). In this investigation, we evaluated the gene expression data of these seven DEGs by an experimental method to validate the results already obtained. To our knowledge, no study has detailed the expression levels or prognostic value of the previously mentioned genes in the PBMCs of HCC patients.
Our investigation indicated that five mRNAs, including CD44, SP3, USP8, E2F2, and UFM1, could remarkably discriminate between patients with HCC and CHB, which is consistent with our previous computational study. CD44 involves several physiological processes, including organ development, immune function, and hematopoiesis. This gene controls various pathways that alter cancer development, invasion, metastasis, and resistance to treatment (19). Several studies have reported tissue expression of CD44 as a favorable predictor in HCC patients (20). Furthermore, in our study, CD44 was upregulated entirely in the PBMCs of HCC patients. E2Fs are a family of essential translation factors that interact in numerous tissues and organs. Cell proliferation, sequestration, DNA repair, cell cycle direction, and apoptosis are all molecular capacities of E2Fs (21). Reports have detailed the expression or function of E2Fs in several human malignancies. According to studies, E2Fs may be a biomarker for tumor prediction (22, 23). In our research, E2F2 was generally upregulated in the PBMCs of HCC patients. Huang et al., using a network-based analysis, demonstrated that tissue expression of E2Fs had a predictive value in various stages and pathological grades of HCC (24). Evaluating the E2F expression in the PBMCs of HCC patients and its predictive value has not been investigated. However, other studies have demonstrated that the blood E2F expression in patients with lung and prostate cancer can be examined by qRT-PCR (25, 26). SP3, in the particular protein/Krüppel-like factor transcription factor family (27), is significantly upregulated in the PBMCs of HCC patients. Microarray data analysis from the GSE58208 dataset revealed that CD44, SP3, and E2F2 genes were upregulated in patients with HCC (6). In our investigation, we observed that these genes were considerably overexpressed in HCC patients compared to CHB patients. In any case, no striking contrast between the two mRNAs was found in CHB patients. Ubiquitin-fold modifier 1 (UFM1) is a small molecule ubiquitin protein with a similar function to ubiquitin. In several pathophysiological forms, UFM1 and its modification framework are embroiled (28).
USP8 has been recognized as an independent prognostic marker for cervical squamous cell carcinoma (CSCC) in various studies. Therefore, it may act as a diagnostic and therapeutic target in CSCC patients (29, 30). Notably, UFM1 and USP8 were generally upregulated in the PBMCs of HCC patients. T-cell intracellular antigen 1 is involved in several biological processes, including RNA metabolism, both within the cytoplasm and in the nucleus (31). IFN regulative factor binding protein 2 is an IRF-2-dependent transcriptional repressor involved in cell apoptosis, survival, and differentiation (32). However, qRT-PCR results revealed slight and statistically insignificant dysregulation of the TIA1 and IRF2BP2 genes in HCC and CHB patients. Our findings are the first to demonstrate that HCC PBMCs have considerably different transcriptional signatures than CHB PBMCs and that higher gene expression is associated with HCC progression. In this research, our gene expression results were obtained from Singaporean patients (33), but we investigated nominee genes in Iranian individuals with CHB and HCC. Ethnicity emerges not because of contrasts in genetic makeup but because of differences in the expression of shared genes between ethnic groups (34). As a result, various hosts and viral variables, including as high viral load, gender, and HBsAg levels, are significant in the evolution of HCC. No serological tests for HBeAg, anti-HBe, and HBV genotypes are performed in the GSE58208 dataset (33). In our research, the direct sequencing of 55 HBsAg sequences showed that all of them were for HBV genotype D. Subsequent studies in different Iranian districts revealed that genotype D is the same genotype of HBV that has spread throughout the country (35). The HBV viral load and genotyping are now essential indicators of the development of antiviral drug resistance and the severity of HBV disease (36, 37).
5.1. Conclusions
Our study showed that different HBV disease states are associated with differentially expressed of several mRNAs signatures. The present transcriptional signature may be employed for the early detection of HBV-related HCC and might play an essential role in the pathogenesis of HBV-induced HCC.


