


1. Context
Non-alcoholic fatty liver disease (NAFLD) is deemed to be the most common cause of chronic liver disease worldwide (1, 2). The NAFLD will become the leading cause of liver transplantation by 2030 (3). The NAFLD is defined as the accumulation of fat deposition in liver hepatocytes of more than 5% of cells volume without the presence of other conditions, such as excess alcohol usage (> 20 g/day in women, > 30 g/day in men), viral and autoimmune hepatitis, hepatotoxic drugs consumption, and endocrine conditions (4-6).
The NAFLD includes a wide range of conditions, from simple steatosis to non-alcoholic steatohepatitis (NASH) (2). Today NAFLD is thought to be a disease not only specified in the liver but other organs of the human body can be affected (7). The global prevalence of NAFLD is estimated to be 29.8%. South and North America are the regions with the highest prevalence of NAFLD, respectively (8). In a meta-analysis study by Moghaddasifar et al., NAFLD prevalence among Iranian people was estimated at 33.9%. They reported that men, obese individuals, hypertension (HTN), hypertriglyceridemia, and metabolic syndrome (MS) were associated with NAFLD in Iranian patients (9).
Various factors are involved in the development of NAFLD, including genetic features (10), diet (11), physical activity (PA) (12), smoking (13), aging (14), obesity (15), dyslipidemia (16), and HTN (17). It has been shown that there is a relationship between some biochemical blood markers and NAFLD, including alanine transaminase, aspartate transaminase (18), gamma-glutamyl transferase (19), triglyceride (TG) (20), high-density lipoprotein (HDL) (21), low-density lipoprotein (LDL) (22), total cholesterol (TC) (23), uric acid (24), and hemoglobin A1c (25). Anthropometric indices can also be an essential representative of NAFLD progression. There is a direct correlation between NAFLD and body mass index (BMI), waist circumference (WC), and waist-to-hip ratio (WHR) (26).
Several studies have been published on the Iranian population regarding NAFLD risk factors; however, the results were controversial. A comprehensive study was needed to summarize the final effects.
2. Objectives
This study aimed to estimate the risk factors of NAFLD in the Iranian adult population using a meta-analytic systematic review methodology.
3. Methods
3.1. Setting
The current study is a systematic review and meta-analysis of related risk factors of NAFLD in the Iranian adult population. The study was designed and conducted within 2021 - 2022. The Preferred Reporting Items for Systematic Reviews and Meta-analyses (PRISMA) guideline was admired for the study protocol (27).
4. Study Selection
In November 2022, two independent researchers studied seven databases, including PubMed, ISI/WoS, ProQuest, Scopus, SID, Mgiran, and Google Scholar. Two researchers also searched the references of included studies to find any possible missing studies. Table 1 shows the search strategy and keywords. Appendix 40 shows the search formula for each database.
| Search Query | Keywords [Searched Through Titles, Abstracts, Medical Subject Headings (MeSH), and General Keywords] |
|---|---|
| Query 1 | “Non-alcoholic fatty liver disease” or “nonalcoholic fatty liver disease” or “nonalcoholic fatty liver” or “nonalcoholic steatohepatitis” or “NAFLD” |
| Query 2 | “Epidemiology” or “prevalence” or “incidence” or “risk factor” or “related factor” or “odds ratio” |
| Query 3 | “Iran” or “Iranian people” or “Iranian population” |
| Final search query | Queries 1 and 2 and 3 |
Search Strategy and Keywords to Identify Related Studies in Different Databases
4.1. Inclusion and Exclusion Criteria
This systematic review and meta-analysis enrolled the original studies that surveyed NAFLD patients’ risk factors in the Iranian population. Studies surveyed the adult population, defined as patients older than 18 years. Systematic reviews, meta-analyses, narrative reviews, randomized clinical trials, editorials, and commentaries were excluded. Studies that surveyed NAFLD in underlying conditions, such as Wilson’s disease, hepatitis, and liver cancer, were excluded.
4.2. Quality Assessment
Two researchers evaluated the quality of the included studies separately based on the Joanna Briggs Institute (JBI) Critical Appraisal Checklist for cross-sectional, case-control, and cohort studies (28-30). This checklist has 8 and 10 items for cross-sectional and case-control studies, respectively. The items can be answered as yes, no, unclear, and not applicable. Table 2 shows the total score of quality assessment for the included studies, and Appendix 41 shows detailed information.
| Number of Studies | Author, Year | Region | Design of Study | Sample Size | Quality Score |
|---|---|---|---|---|---|
| Study 1 | Abbasalizad Farhangi et al., 2016 (31) | Tehran | Case-control | 306 | 9/10 |
| Study 2 | Adibi et al., 2017 (32) | Isfahan | Cross-sectional | 483 | 6/8 |
| Study 3 | Alavian et al., 2008 (33) | Tehran | Cross-sectional | 1,120 | 5/8 |
| Study 4 | Amirkalali et al., 2014 (34) | Amol | Cross-sectional | 5,023 | 8/8 |
| Study 5 | Bagheri Lankarani et al., 2013 (35) | Shiraz | Case-control | 580 | 8/10 |
| Study 6 | Bagheri Lankarani et al., 2013 (36) | Shiraz | Cross-sectional | 819 | 6/8 |
| Study 7 | Bahrami et al., 2019 (37) | Tehran | Case-control | 999 | 9/10 |
| Study 8 | Birjandi et al., 2016 (38) | Kavar | Cross-sectional | 1,600 | 6/8 |
| Study 9 | Damavandi and Zeinali, 2021 (39) | Tehran | Case-control | 242 | 5/10 |
| Study 10 | Darand et al., 2019 (40) | Tehran | Case-control | 959 | 8/10 |
| Study 11 | Dehghan et al., 2015 (41) | Tehran | Cross-sectional | 170 | 5/8 |
| Study 12 | Dehghanseresht et al., 2020 (42) | Ahvaz | Case-control | 243 | 9/10 |
| Study 13 | Doustmohammadian et al., 2022 (43) | Amol | Cross-sectional | 3,220 | 8/8 |
| Study 14 | Ebrahimi Mousavi et al., 2022 (44) | Ahvaz | Case-control | 243 | 9/10 |
| Study 15 | Emamat et al., 2021 (45) | Tehran | Case-control | 999 | 8/10 |
| Study 16 | Entezari et al., 2021 (46) | Yazd | Case-control | 247 | 9/10 |
| Study 17 | Eshraghian et al., 2013 (47) | Kavar | Cross-sectional | 832 | 8/8 |
| Study 18 | Fadaei et al., 2018 (48) | Tehran | Case-control | 85 | 8/10 |
| Study 19 | Fattahi et al., 2018 (49) | Sanandaj | Cross-sectional | 410 | 6/8 |
| Study 20 | Ghaemi et al., 2018 (50) | Tehran | Cross-sectional | 1,500 | 5/8 |
| Study 21 | Hashemian et al., 2021 (51) | Gonbad | Cross-sectional | 1,464 | 8/8 |
| Study 22 | Hekmatdoost et al., 2016 (52) | Tehran | Case-control | 306 | 9/10 |
| Study 23 | Honarvar et al., 2019 (53) | Shiraz | Cross-sectional | 478 | 8/8 |
| Study 24 | Khoshbaten et al., 2009 (54) | Tabriz | Case-control | 204 | 9/10 |
| Study 25 | Kolahi et al., 2015 (55) | Tehran | Case-control | 170 | 7/10 |
| Study 26 | Lotfi et al., 2019 (56) | Isfahan | Case-control | 600 | 9/10 |
| Study 27 | Mansour Ghanaei et al., 2018 (57) | Soomehesara | Cross-sectional | 960 | 8/8 |
| Study 28 | Mohammadi et al., 2011 (58) | Urmia | Case-control | 149 | 7/10 |
| Study 29 | Mohammadifard et al., 2019 (59) | Birjand | Cross-sectional | 130 | 5/8 |
| Study 30 | Mohseni et al., 2016 (60) | Tabriz | Case-control | 149 | 9/10 |
| Study 31 | Mokhtari et al., 2017 (61) | Tehran | Case-control | 951 | 5/10 |
| Study 32 | Moradzad et al., 2022 (62) | Sanandaj | Case-control | 115 | 7/10 |
| Study 33 | Mosallaei et al., 2015 (63) | Mashhad | Case-control | 280 | 7/10 |
| Study 34 | Motamed et al., 2016 (64) | Amol | Cross-sectional | 5,052 | 7/8 |
| Study 35 | Motamed et al., 2020 (65) | Amol | Case-control | 5,797 | 9/10 |
| Study 36 | Najafi et al., 2022 (66) | Tehran | Case-control | 300 | 5/10 |
| Study 37 | Ostovaneh et al., 2015 (67) | Amol | Cross-sectional | 5,645 | 8/8 |
| Study 38 | Ostovaneh et al., 2015 (67) | Zahedan | Cross-sectional | 2,078 | 8/8 |
| Study 39 | Pasdar et al., 2016 (68) | Kermanshah | Case-control | 216 | 9/10 |
| Study 40 | Pasdar et al., 2017 (69) | Kermanshah | Case-control | 250 | 8/10 |
| Study 41 | Pasdar et al., 2019 (70) | Kermanshah | Case-control | 210 | 8/10 |
| Study 42 | Radmard et al., 2016 (71) | Gonbad | Cross-sectional | 201 | 8/8 |
| Study 43 | Rezapour et al., 2021 (72) | Tabriz | Case-control | 143 | 9/10 |
| Study 44 | Salehi-Sahlabadi et al., 2021 (73) | Isfahan | Case-control | 675 | 9/10 |
| Study 45 | Savadkoohi et al., 2002 (74) | Zahedan | Cross-sectional | 247 | 5/8 |
| Study 46 | Shanaki et al., 2016 (75) | Tehran | Case-control | 42 | 8/10 |
| Study 47 | Sohouli et al., 2020 (76) | Tehran | Case-control | 515 | 9/10 |
| Study 48 | Sohouli et al., 2021 (77) | Tabriz | Case-control | 366 | 9/10 |
| Study 49 | Taheri et al., 2022 (78) | Sabzevar | Case-control | 1,932 | 9/10 |
| Study 50 | Tutunchi et al., 2021 (79) | Tabriz | Case-control | 210 | 9/10 |
| Study 51 | Tutunchi et al., 2021 (80) | Tabriz | Case-control | 210 | 9/10 |
| Study 52 | Tutunchi et al., 2021 (81) | Tabriz | Case-control | 100 | 9/10 |
| Study 53 | Vahid et al., 2019 (82) | Tehran | Case-control | 999 | 8/10 |
| Study 54 | Zarean et al., 2019 (83) | Shahrekord | Case-control | 2,306 | 8/10 |
| Study 55 | Zolfaghari et al., 2016 (84) | Isfahan | Case-control | 317 | 7/10 |
Characteristics of Included Studies
5. Data Extraction
Two independent researchers surveyed the eligible articles and extracted the data based on the current systematic review and meta-analysis objectives. The name of the first author, year of publication, the place of study, the type of study (i.e., cross-sectional, case-control, or cohort), and the sample size were identified (Table 2). The data of several risk factors of NAFLD, including age, gender, BMI, WC, WHR, TC, HDL, LDL, TG, alanine aminotransferase (ALT), aspartate aminotransferase (AST), HTN, systolic blood pressure (SBP), diastolic blood pressure (DBP), fasting blood sugar (FBS), homeostatic model assessment for insulin resistance (HOMA-IR), diabetes mellitus (DM), MS, PA, and smoking, were extracted from selected studies.
5.1. Statistical Analysis
The study’s heterogeneity was investigated by Cochran’s test (a significance level of less than 0.1) and I2 statistics (a significance level of more than 50%). A random-effects model was used for studies with heterogeneity, and a fixed-effects model was used for non-heterogenic studies. The odds ratio (OR) was obtained to combine the results of included studies. This index allowed the researchers to combine the results of included studies reported differently. A subgroup analysis was conducted based on the design of the study. Egger’s regression test was used to evaluate the asymmetry of funnel plots for any possible publication bias. Trim-and-Fill analysis was also utilized to determine the robustness of the results. Comprehensive Meta-analysis Statistical Software (version 3) was used for all the analyses of this study.
6. Results
6.1. Literature Search
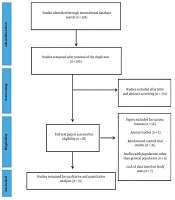
After searching all international databases, 328 articles were identified, and after removing 43 duplicates, a total of 285 studies remained. Two independent researchers studied the titles and the abstracts of the remaining studies carefully, and 174 studies were excluded. The remaining studies went for full text reviewing for eligibility criteria, and 56 articles were excluded at this stage. Finally, a total number of 55 articles with a total sample size of 53,847 individuals were selected for analysis (Figure 1). Table 2 shows the information on the selected papers.

Flowchart of included eligible studies in this systematic review
6.2. Characteristics of Included Studies
Table 2 shows the features and quality scores of the selected studies based on the JBI checklist. Of 55 studies, 19 and 36 studies were cross-sectional case-control, respectively. Of included studies, 43 had high quality (scores higher than 6 and 8 for cross-sectional and case-control studies, respectively). Appendix 41 shows detailed information regarding the quality assessment of the included studies. Ostovaneh et al. surveyed NAFLD epidemiology in two regions that were considered two different studies in the current meta-analysis (67).
6.3. Results of Meta-analysis
This systematic review and meta-analysis study calculated the OR for the risk factors in adults, including age, gender, BMI, WC, WHR, TC, HDL, LDL, TG, ALT, AST, HTN, SBP, DBP, FBS, HOMA-IR, DM, MS, PA, and smoking. Additionally, subgroup analysis was conducted based on the design of the studies.
In total analysis, several factors were significantly associated with NAFLD, including age, BMI, WC, WHR, TC, HDL, LDL, TG, ALT, AST, HTN, SBP, DBP, FBS, HOMA-IR, DM, MS, and PA (Appendices 1 - 18, Table 3). The relationship between gender and smoking with NAFLD was insignificant (Appendices 19 and 20, Table 3). In case-control studies, some factors were significantly associated with NAFLD, including BMI, WC, WHR, TC, HDL, LDL, TG, ALT, AST, HTN, SBP, DBP, FBS, HOMA-IR, DM, MS, PA, and smoking (Appendices 2 - 19, Table 3). In cross-sectional studies, several factors were significantly associated with NAFLD, including age, BMI, WC, WHR, TC, HDL, LDL, TG, ALT, AST, HTN, SBP, DBP, FBS, HOMA-IR, DM, and MS (Appendices 1 - 17, Table 3).
| Variables and Design of Studies | No. of Sample Size | No. of Studies | OR | 95% CI | P-Value | Q-Value | I2; No. (%) | P-Value of Heterogeneity | Model of Analysis |
|---|---|---|---|---|---|---|---|---|---|
| Age (32, 36, 38, 43, 47, 50, 51, 53, 57, 59, 64, 67, 71, 74) | |||||||||
| Cross-sectional | 24,736 | 15 | 2.12 | 1.79 - 2.51 | < 0.001 | 119.80 | 99.34 | < 0.001 | Random |
| BMI (32, 36, 37, 39-48, 50-58, 60-63, 65, 67, 69-73, 75-84) | |||||||||
| Case-control | 18,661 | 33 | 5.07 | 3.13 - 8.22 | < 0.001 | 3358.24 | 99.04 | < 0.001 | Random |
| Cross-sectional | 17,850 | 12 | 4.85 | 2.33 - 10.09 | < 0.001 | 2420.64 | 99.54 | < 0.001 | Random |
| Total | 36,511 | 45 | 5.00 | 3.34 - 7.49 | < 0.001 | 6399.11 | 99.32 | < 0.001 | Random |
| WC (34, 36, 42-44, 46, 47, 50, 51, 54, 56, 57, 60, 64, 78, 81, 85) | |||||||||
| Case-control | 5,393 | 12 | 6.81 | 2.43 - 19.03 | < 0.001 | 834.75 | 98.68 | < 0.001 | Random |
| Cross-sectional | 18,051 | 8 | 6.07 | 2.50 - 14.74 | < 0.001 | 1171.82 | 99.40 | < 0.001 | Random |
| Total | 23,444 | 20 | 6.37 | 3.25 - 12.48 | < 0.001 | 2212.97 | 99.14 | < 0.001 | Random |
| WHR (36, 38, 42, 44, 47, 56, 57, 60, 67, 68, 70, 71, 78, 79, 81, 85) | |||||||||
| Case-control | 11,316 | 11 | 3.13 | 1.45 - 6.77 | 0.004 | 443.69 | 97.74 | < 0.001 | Random |
| Cross-sectional | 5,158 | 6 | 4.83 | 4.01 - 5.82 | < 0.001 | 17.38 | 71.24 | < 0.001 | Random |
| Total | 16,474 | 17 | 4.72 | 3.93 - 5.66 | < 0.001 | 462.73 | 96.54 | < 0.001 | Random |
| TC (32-34, 36-40, 43, 45-50, 54, 58-63, 66-68, 70-72, 74-81, 83) | |||||||||
| Case-control | 12,504 | 25 | 1.65 | 1.34 - 2.03 | < 0.001 | 185.49 | 87.06 | < 0.001 | Random |
| Cross-sectional | 23,308 | 14 | 2.13 | 1.60 - 2.84 | < 0.001 | 311.36 | 95.82 | < 0.001 | Random |
| Total | 35,812 | 39 | 1.80 | 1.52 - 2.13 | < 0.001 | 581.28 | 93.46 | < 0.001 | Random |
| HDL (32, 34, 36-40, 43, 45-50, 54, 58-65, 67, 69-71, 75-81, 83) | |||||||||
| Case-control | 18,102 | 24 | 0.51 | 0.41 - 0.65 | < 0.001 | 400.96 | 94.26 | < 0.001 | Random |
| Cross-sectional | 26,993 | 13 | 0.60 | 0.41 - 0.87 | 0.007 | 593.93 | 97.98 | < 0.001 | Random |
| Total | 45,095 | 37 | 0.53 | 0.44 - 0.65 | < 0.001 | 1590.06 | 97.73 | < 0.001 | Random |
| LDL (31, 32, 36, 37, 39, 40, 43, 45, 48-50, 54, 59, 61-63, 65, 67, 70-72, 75-82) | |||||||||
| Case-control | 15,494 | 22 | 1.66 | 1.34 - 2.06 | < 0.001 | 303.60 | 93.83 | < 0.001 | Random |
| Cross-sectional | 14,486 | 9 | 1.80 | 1.06 - 3.05 | 0.028 | 410.88 | 95.05 | < 0.001 | Random |
| Total | 29,980 | 31 | 1.68 | 1.38 - 2.05 | < 0.001 | 1131.75 | 97.35 | < 0.001 | Random |
| TG (32-34, 36-40, 43, 45-48, 50, 54, 58, 59, 61, 62, 65, 67, 68, 70, 71, 74, 75, 79, 80, 82) | |||||||||
| Case-control | 14,647 | 17 | 2.44 | 1.63 - 3.66 | < 0.001 | 739.71 | 97.83 | < 0.001 | Random |
| Cross-sectional | 17,875 | 14 | 3.46 | 2.81 - 4.25 | < 0.001 | 194.04 | 93.30 | < 0.001 | Random |
| Total | 32,522 | 31 | 3.21 | 2.67 - 3.87 | < 0.001 | 3475.23 | 99.13 | < 0.001 | Random |
| ALT (32-34, 36-39, 43, 46, 47, 49, 50, 54, 58-60, 62, 67, 71, 76-78, 80, 82, 83) | |||||||||
| Case-control | 9,008 | 14 | 6.67 | 3.79 - 11.74 | < 0.001 | 476.35 | 97.27 | < 0.001 | Random |
| Cross-sectional | 22,197 | 12 | 3.18 | 2.14 - 4.73 | < 0.001 | 433.71 | 97.46 | < 0.001 | Random |
| Total | 31,205 | 26 | 4.06 | 2.94 - 5.62 | < 0.001 | 985.35 | 97.46 | < 0.001 | Random |
| AST (32-34, 36-39, 43, 45-47, 49, 50, 54, 58-60, 62, 67, 71, 76-78, 80, 82, 83) | |||||||||
| Case-control | 10,055 | 15 | 2.20 | 1.15 - 4.19 | 0.016 | 719.35 | 98.05 | < 0.001 | Random |
| Cross-sectional | 22,197 | 12 | 2.15 | 1.38 - 3.34 | 0.001 | 510.12 | 97.84 | < 0.001 | Random |
| Total | 32,252 | 27 | 2.16 | 1.50 - 3.12 | < 0.001 | 1232.28 | 97.89 | 0.175 | Random |
| HTN (32, 36, 47, 49, 54, 64, 65, 67-69, 83) | |||||||||
| Case-control | 8,608 | 6 | 1.64 | 1.14 - 2.35 | 0.007 | 82.33 | 93.92 | < 0.001 | Random |
| Cross-sectional | 19,859 | 7 | 2.61 | 2.38 - 2.86 | < 0.001 | 9.84 | 39.06 | 0.132 | Fixed |
| Total | 28,467 | 13 | 2.53 | 2.32 - 2.77 | < 0.001 | 975.60 | 98.77 | < 0.001 | Random |
| SBP (36, 38, 42-44, 47, 50, 52, 54, 69, 75, 81, 83) | |||||||||
| Case-control | 2,178 | 9 | 1.57 | 1.26 - 1.97 | < 0.001 | 14.90 | 46.30 | 0.061 | Fixed |
| Cross-sectional | 7,107 | 4 | 2.35 | 1.76 - 3.14 | < 0.001 | 24.84 | 87.92 | < 0.001 | Random |
| Total | 9,285 | 13 | 1.83 | 1.53 - 2.18 | < 0.001 | 49.88 | 75.94 | < 0.001 | Random |
| DBP (36, 38, 42-44, 47, 48, 50, 52, 54, 69, 75, 81, 83) | |||||||||
| Case-control | 4,319 | 10 | 1.54 | 1.23 - 1.91 | < 0.001 | 20.97 | 57.09 | 0.013 | Random |
| Cross-sectional | 7,107 | 4 | 3.59 | 2.27 - 5.67 | < 0.001 | 60.66 | 95.05 | < 0.001 | Random |
| Total | 11,426 | 14 | 1.80 | 1.48 - 2.20 | < 0.001 | 177.37 | 92.67 | < 0.001 | Random |
| FBS (32, 34, 36-40, 43, 45, 47, 48, 50, 54, 58, 60, 61, 63, 66-71, 76-78, 80, 81, 83) | |||||||||
| Case-control | 12,033 | 21 | 3.10 | 2.00 - 4.80 | < 0.001 | 627.26 | 96.81 | < 0.001 | Random |
| Cross-sectional | 21,356 | 10 | 2.70 | 1.68 - 4.33 | < 0.001 | 593.25 | 98.48 | < 0.001 | Random |
| Total | 33,389 | 31 | 2.91 | 2.11 - 4.01 | < 0.001 | 1225.81 | 97.55 | < 0.001 | Random |
| HOMA-IR (34, 64, 65, 67) | |||||||||
| Case-control | 5,797 | 1 | 1.27 | 1.19 - 1.35 | < 0.001 | 0.00 | 0.00 | 1 | Fixed |
| Cross-sectional | 17,798 | 4 | 2.19 | 1.44 - 3.34 | < 0.001 | 217.28 | 98.61 | < 0.001 | Random |
| Total | 23,595 | 5 | 1.92 | 1.48 - 2.59 | < 0.001 | 245.78 | 98.37 | < 0.001 | Random |
| DM (36, 37, 39, 43, 45, 47, 49, 52, 54, 61, 63, 67, 82, 83) | |||||||||
| Case-control | 8,190 | 10 | 3.19 | 2.52 - 4.02 | < 0.001 | 18.87 | 52.32 | 0.026 | Random |
| Cross-sectional | 12,185 | 5 | 2.47 | 1.52 - 4.02 | < 0.001 | 53.39 | 92.50 | < 0.001 | Random |
| Total | 20,375 | 15 | 3.04 | 2.46 - 3.75 | < 0.001 | 94.13 | 85.12 | < 0.001 | Random |
| MS (32, 36, 43, 47, 67, 69, 83) | |||||||||
| Case-control | 3,346 | 4 | 2.41 | 1.42 - 4.10 | 0.001 | 17.80 | 83.14 | < 0.001 | Random |
| Cross-sectional | 12,594 | 6 | 3.96 | 3.00 - 5.22 | < 0.001 | 38.22 | 86.91 | < 0.001 | Random |
| Total | 15,940 | 10 | 3.56 | 2.79 - 4.55 | < 0.001 | 203.64 | 95.58 | < 0.001 | Random |
| PA (37, 40, 44, 45, 56, 61, 73, 76-78, 81) | |||||||||
| Case-control | 6,307 | 11 | 0.32 | 0.24 - 0.43 | < 0.001 | 91.79 | 89.10 | < 0.001 | Random |
| Total | 6,307 | 11 | 0.32 | 0.24 - 0.43 | < 0.001 | 91.79 | 89.10 | < 0.001 | Random |
| Smoking (33, 37-39, 41-45, 47, 49-52, 55-57, 61-64, 67, 73, 76-79, 82, 83) | |||||||||
| Case-control | 12,475 | 18 | 2.25 | 1.13 - 4.48 | 0.020 | 745.03 | 97.71 | < 0.001 | Random |
| Cross-sectional | 18,999 | 12 | 1.03 | 0.83 - 1.28 | 0.764 | 63.049 | 82.67 | < 0.001 | Random |
| Total | 31,474 | 30 | 1.11 | 0.90 - 1.36 | 0.323 | 866.18 | 96.65 | < 0.001 | Random |
| Gender (male/female) (32-34, 36-38, 40-42, 44, 45, 49-62, 66, 68, 70-74, 76-81, 83, 84) | |||||||||
| Case-control | 14,167 | 27 | 1.00 | 0.84 - 1.20 | 0.948 | 133.93 | 80.58 | < 0.001 | Random |
| Cross-sectional | 15,201 | 14 | 0.94 | 0.79 - 1.12 | 0.529 | 58.56 | 77.80 | < 0.001 | Random |
| Total | 29,368 | 41 | 0.97 | 0.86 - 1.10 | 0.688 | 196.89 | 79.68 | < 0.001 | Random |
Results of Meta-analysis, Subgroup Analysis, and Heterogeneity for Non-alcoholic Fatty Liver Disease Risk Factors a
6.4. Results of Publication Bias
Egger’s regression test was performed to assess publication bias. When any suspected asymmetry in the funnel plot was observed, Trim-and-Fill analysis was conducted to observe the stability of the results. In summary, age, BMI, HDL, LDL, TG, ALT, HTN, and DM had significant publication bias (Appendices 21 - 39, Table 4).
| Variables Name | P-Value of Egger’s Regression Test | Results of Trim-and-Fill Analysis (Point Estimate with Lower and Upper Intervals) | Number of Imputed Studies in Trim-and-Fill Analysis |
|---|---|---|---|
| Age | 0.023 | 2.12 (1.79 - 2.51) | 0 |
| BMI | < 0.001 | 5.53 (3.94 - 7.78) | 0 |
| WC | 0.718 | 6.51 (3.42 - 12.38) | 0 |
| WHR | 0.610 | 3.73 (2.57 - 5.43) | 0 |
| TC | 0.387 | 1.82 (1.52 - 2.18) | 0 |
| HDL | < 0.001 | 0.54 (0.44 - 0.66) | 0 |
| LDL | < 0.001 | 1.71 (1.37 - 2.13) | 0 |
| TG | < 0.001 | 2.86 (2.07 - 3.95) | 0 |
| ALT | 0.025 | 4.71 (3.41 - 6.50) | 0 |
| AST | 0.467 | 1.81 (1.24 - 2.64) | 3 |
| HTN | 0.003 | 2.09 (1.46 - 3.00) | 0 |
| SBP | 0.469 | 1.86 (1.54 - 2.25) | 0 |
| DBP | 0.444 | 2.08 (1.52 - 2.83) | 0 |
| FBS | 0.282 | 2.95 (2.19 - 3.98) | 0 |
| DM | 0.003 | 3.01 (2.32 - 3.91) | 0 |
| MS | 0.414 | 3.19 (2.15 - 4.73) | 0 |
| PA | 0.245 | 0.32 (0.24 - 0.43) | 0 |
| Smoking | 0.153 | 1.62 (1.14 - 2.29) | 0 |
| Gender | 0.629 | 0.98 (0.86 - 1.09) | 0 |
Results of Publication Bias and Trim-and-Fill Analysis for Non-alcoholic Fatty Liver Disease Risk Factors
7. Discussion
The NAFLD appears as the most common chronic liver disease worldwide, which is associated with insulin resistance (IR) and the characteristics of MS and several factors, including genetic, environmental, and stress determinants. It might also exacerbate liver damage caused by other factors, such as alcohol, viruses, and industrial toxins (86-88). This systematic meta-analysis review was carried out to identify the risk factors of NAFLD in Iran. A total of 55 studies were included, from which 20 risk factors were surveyed. From the investigated factors, 18 factors, namely age, BMI, WC, WHR, TC, HDL, LDL, TG, ALT, AST, HTN, SBP, DBP, FBS, HOMA-IR, DM, MS, and PA, were significantly associated with NAFLD; however, two factors, namely gender and smoking, were not significant.
7.1. Age
This study showed that older individuals had a significantly higher risk of developing NAFLD. Other studies also showed a high prevalence of NAFLD in the older population (89-92). It has also been reported that older individuals have a higher chance of getting NASH and a higher level of hepatic fibrosis (93, 94).
Older individuals are more sensitive to oxidative stress and oxidative damage; nevertheless, the data are still conflicting (95, 96). Oxidative stress plays an important role in the pathogenesis of NAFLD (97). In addition, it is assumed that older individuals have a higher fat accumulation in the liver, muscle, and bone marrow tissues (98). It is believed there is a shift from subcutaneous adipose tissue to visceral adipose tissue in the elderly, leading to IR (99, 100). The IR is a crucial factor in the pathogenesis of NAFLD (discussed later).
7.2. Gender
Based on the results of the present study, NAFLD was more prevalent in women; however, it was not significant. Some other studies suggest that NAFLD is more common in men (101); nevertheless, other studies believe vice versa (34).
It has been demonstrated that post-menopausal women under hormone replacement therapy (HRT) had lower NAFLD prevalence than post-menopausal women without HRT (87). These phenomena reflect the role of estrogen hormones as a protective factor in developing NAFLD. These hormones have anti-inflammatory, antifibrotic, antiapoptotic, and antioxidant characteristics (102-104).
Estrogen hormones also play an important role in regional fat distribution. It is assumed that estrogen supports subcutaneous fat accumulation rather than visceral fat (105, 106). The direct relationship between the amount of visceral fat and the progression of NAFLD has been demonstrated (107, 108). Gynoid glute-femoral subcutaneous fat reduces the risk of metabolic disorders; however, android visceral fat, which is higher in men, increases the risk of metabolic disorders (109). Glute-femoral adipocytes are less responsive to epinephrine and norepinephrine lipolytic effects and distribute less free fatty acid (FFA) than abdominal adipose tissue (110, 111). Some studies believe estradiol reduces lipolysis and enhances body organ insulin sensitivity (112, 113). Another interesting point that makes NAFLD more prevalent in men is the difference in muscle physiology in both genders. Skeletal muscles are more resistant to insulin in men than women, and IR plays an essential role in the pathogenesis of NAFLD (discussed later) (114, 115).
7.3. Anthropometric Indices
In the current meta-analysis, BMI, WC, and WHR were strong risk factors for NAFLD progression. These anthropometric measurements are related to obesity and can be used in obesity-related health risks (116-119). The association between obesity and NAFLD is a complex phenomenon and is affected by many metabolic pathways. Steatosis has resulted from an imbalance between more FFA input to the liver and less output. The FFA input to the liver depends on liver uptake activity and de novo lipogenesis. Liver uptake activity is affected by liver capacity in uptake and the amount of FFA delivered to the liver. The FFA delivered to the liver originates from adipose tissue and circulating TG (15).
Previous studies have shown an increased liver capacity for FFA uptake in obese individuals. In obese individuals with NAFLD, the gene expression of FAT/CD36, which is an important membrane protein in transporting FFA into tissues, increases in liver and skeletal muscle and decreases in adipose tissue, suggesting a shift in the absorption of FFA from adipose tissue to hepatic tissue (120, 121). Delivery of FFA to the liver also increases in obese individuals. The rates of FFA released from adipose tissue and gene expression of hepatic lipase and hepatic lipoprotein lipase (i.e., an enzyme that changes circulating TG to FFA) are higher in obese individuals (122-124). According to some studies, hepatic de novo lipogenesis is higher in obese individuals due to the overexpression of some involved genes (125, 126).
Another important key in the progression of NAFLD in obese individuals is inflammation. Chemokines [e.g., C-C motif chemokine ligand 2 (CCL2)] and cytokines [e.g., tumor necrosis factor-alpha (TNF-α)] secreted from adipose tissue can lead to IR and inflammation (124). The secretion rate of adipose tissue chemokines and cytokines increases in obese individuals suggesting their role in the pathogenesis of NAFLD (126).
7.4. Dyslipidemia
Atherogenic dyslipidemia, defined as increased plasma TG, small dense LDL, and decreased HDL-C, is noted in patients suffering from NAFLD (16). The fact that NAFLD patients have hypertriglyceridemia is complicated and is affected by several determinants. One of the involved factors in the metabolism is very low-density lipoprotein (VLDL). The VLDLs are TG-carrying particles released from the liver and contain the highest fasting plasma TG (127).
Intrahepatic triglyceride (IHTG) is directly affected by hepatic VLDL production in obese individuals with normal liver fat (128, 129). Studies have shown that in patients with IHTG of more than 10%, the relationship between IHTG and VLDL is disrupted (128, 129). This evidence recommends that VLDL secretion can only compensate for the increased rate of IHTG in a distinct range and might not work correctly in NAFLD subjects. Moreover, IR, observed in NAFLD individuals (130), can decrease the clearance of VLDL from plasma (127). Previous studies have shown that insulin can reduce hepatic VLDL production and increase VLDL clearance by enhancing lipoprotein lipase activity (131). Altogether, the occurrence of these processes simultaneously can justify the coexistence of NAFLD and hypertriglyceridemia.
The current meta-analysis showed that the increased serum LDL was significantly associated with NAFLD development. The LDL is removed from circulatory blood by several receptors on the liver, such as LDL receptor (LDLR) and LDLR related-protein 1 (127). Proprotein convertase subtilisin/kexin type 9 (PCSK9) is a protease that reduces LDLR in the liver leading to increase serum LDL levels (127). Studies have shown that PCSK9 activity has a positive relationship with steatosis status. Additionally, in NAFLD patients, higher PCSK9 activity and higher serum LDL levels are reported (132, 133).
The HDL is a protective determinant for NAFLD patients, and low HDL levels are related to NAFLD progression. Low HDL levels in NAFLD patients can result from hypertriglyceridemia (discussed above). Hypertriglyceridemia can promote cholesterol ester transfer protein activity, producing TG-enriched HDL particles. These particles seem to be removed faster from circulatory blood, leading to lower serum HDL levels (134, 135).
Cholesterol was another critical risk factor in the present meta-analysis. In this study, the relationship between hypercholesterolemia and NAFLD was stronger than in the American population (136). Recent studies claim that hepatic free cholesterol (FC) accumulation is a hallmark of NAFLD pathogenesis and is related to the disease’s histological severity (137, 138). The available evidence demonstrates that cholesterol homeostasis is altered in NAFLD, leading to FC deposition in the liver (139). In animal studies, the accumulation of FC in the liver exacerbates steatohepatitis and liver fibrosis (140-144). The expression and activity of 3-hydroxy-3-methylglutaryl coenzyme A reductase, an essential enzyme in cholesterol biosynthesis (145, 146), are increased in patients with NAFLD leading to increased cholesterol levels (137, 147).
7.5. Hypertension
The HTN is a multifactorial disease influenced by genetic and environmental determinants and is becoming a public health concern (148). The relationship between HTN and NAFLD is a complex issue. It is not clear whether NAFLD is caused by HTN or vice versa. The present study showed that in addition to HTN, high SBP and high DBP are important risk factors for NAFLD.
The mechanisms by which NAFLD can promote HTN are not well understood, and further studies are needed in this regard (149). Several mechanisms can justify the act of NAFLD in HTN progression. There is a relationship between the body’s inflammatory state and sympathetic nervous system stimulation, which plays an important role in the pathogenesis of HTN (150). The NAFLD is considered to be associated with systematic inflammation recognized by the increased serum levels of interleukin 6, TNF-α, and CCL2 (151).
Another mechanism in which NAFLD leads to HTN is IR. In systemic IR, several determinants can result in HTN, such as perivascular and renal sinus fat deposition, endothelial cell dysfunction, and activation of the renin-angiotensin-aldosterone system (RAAS) (149, 152, 153). Other mechanisms leading to HTN in NAFLD include decreased vasodilation and increased vasoconstriction. Several factors can reduce and impair nitric oxide (a vasodilator) activity in NAFLD patients. In addition, as discussed above, the RAAS becomes more active in NAFLD patients, and this hyperactivity can lead to vasoconstriction (154). In NAFLD patients, arterial stiffness develops, affecting contractile vessel function (155).
7.6. Liver Enzymes
In the current study, elevated serum AST and ALT levels were significantly associated with NAFLD; however, some studies reported normal liver enzymes in these individuals (156-159). The present study demonstrated that the relationship between AST and NAFLD was more robust than between ALT and NAFLD. One of the indicative determinants of hepatic injury is ALT which can be considered a maker representing the presence of NAFLD (160). In some studies, AST to platelet ratio index is a prognostic criterion for liver fibrosis in NAFLD patients (161-163). One of the hypotheses about NAFLD pathogenesis that can justify the increased levels of AST and ALT is the two-hit theory. The first hit is defined as fat accumulation in the liver, and the second hit is a liver injury caused by reactive oxygen species-induced necroinflammation (114, 164, 165). The authors of the present study believe that this necroinflammation and hepatocyte injury can result in higher levels of intracellular hepatic enzymes, such as AST and ALT.
7.7. Diabetes Mellitus
The DM was one of the strongest factors associated with NAFLD. The DM and NAFLD have a bilateral relationship, and these two pathologic statuses usually coexist (166-168). Previous studies showed that DM could result in NAFLD progression to NASH, advanced fibrosis, or cirrhosis (169). The pathophysiologic mechanisms of the relationship between NAFLD and DM are not understood well, and debates are going on. The increased chance of getting DM in NAFLD can occur in the early phase (associated with fat accumulation) and late phase (associated with hepatic inflammation) of the disease (169).
Fat accumulation in the liver, which occurs in the first hit regarding the two-hit theory (discussed above), is related to hepatic, adipose, and muscle tissue IR, increasing the chance of DM (3, 166, 169-172). The inflammation of the liver, which occurs in the second hit regarding the two-hit theory (discussed above), is associated with hepatocytes and pro-inflammatory cytokines, such as fetuin-A, fetuin B, angiopoietin-like protein, fibroblast growth factor 21, and selenoprotein, which can increase the risk of DM (3, 167, 173-176). Another mechanism in the pathogenesis of NAFLD and DM is insulin clearance. Lower insulin clearance is shown in patients with NAFLD, and lower hepatic insulin extraction from blood seems to be related to increased hepatic steatosis (169).
In the present study, the IR score (HOMA-IR) was significantly associated with NAFLD. The IR is an important key in the pathogenesis of NAFLD. Several studies have shown that obesity (as discussed above), excess nutrition, and MS play an important role in NAFLD patients; accordingly, a “high-fed status” is expected in these patients (177-180). In high-fed status, FFA is transferred to adipose tissue and, by the effect of insulin, is changed to TG. By this time, the chronic inflammation in adipose tissue leads to peripheral IR (181, 182). In the state of IR, lipogenesis (i.e., the transformation of FFA to TG) does not occur; therefore, circulatory FFA increases (183). These FFA are then transferred to the liver and contribute to de novo lipogenesis (182). A higher de novo lipogenesis is a feature in NAFLD patients (discussed above).
Another phenomenon in the pathogenesis of IR in NAFLD is defined as selective IR. One of the functions of insulin is inhibiting gluconeogenesis and activating de novo lipogenesis in the liver. However, in insulin-resistant NAFLD patients, insulin fails to inhibit gluconeogenesis but can stimulate de novo lipogenesis (182, 184).
7.8. Smoking
The relationship between smoking and NAFLD is controversial, and further studies are needed in this regard. Some studies imply the effect of tobacco on NAFLD progression (185-187). On the other hand, there is some evidence of a non-significant relationship between smoking and NAFLD (188). A significant relationship between NAFLD and smoking was shown in a meta-analysis study by Akhavan Rezayat et al. However, in the present study, this relationship was not significant with a larger sample size (13).
Some witnesses recommend the role of smoking in NAFLD progression. Previous experimental studies have shown the effect of cigarettes on insulin function, which can lead to IR (189, 190). As discussed above, IR is critical in developing NAFLD. The present study talked about the relationship between DM and NAFLD previously. The role of smoking in DM progression and glucose intolerance is also observed in some studies (191-193). Moreover, MS is more prevalent in smokers (194, 195). The links between oxidative stress, pro-inflammatory cytokines, and NAFLD have been discussed. Previous studies also showed the role of smoking in stimulating oxidative stress and inflammation (196-198).
There is also some evidence suggesting the effect of cigarettes on NAFLD prevention. Some studies imply smoking can decrease BMI, and cigarette cessation can lead to following weight gain and DM (199). Moreover, acute energy expenditure is observed with smoking (200). Altogether, some evidence suggests the role of smoking in NAFLD progression; however, other studies reject it. Accordingly, the non-significant effect of smoking on NAFLD development can be justified.
7.9. Limitations
This study identified the risk factors for NAFLD in the Iranian adult population. However, the study had some limitations. There was significant heterogeneity for all variables. For the assessment of the source of heterogeneity, subgroup analysis was performed based on the design of studies (i.e., case-control and cross-sectional). Nevertheless, significant heterogeneity remained for most variables. This review also included studies with low quality, which can affect the pooled effects. In this meta-analysis, the included studies were conducted in 11 cities in Iran, and no study was available for most of the cities; therefore, the results might not be a precise representation of the Iranian population. It was impossible to assess the difference between urban and rural individuals due to a lack of data. It is suggested to perform further studies on the rural population as these individuals have different lifestyles in comparison to urban residents. Not enough information was available regarding the duration of diabetes; therefore, the present study did not assess the effect of this factor on NAFLD. It is recommended to perform future studies to evaluate the duration of DM in diabetic patients who have NAFLD.
8. Conclusions
In conclusion, this study aimed to identify NAFLD risk factors in the Iranian adult population. Among the 18 identified risk factors, WC had the strongest relationship with NAFLD, followed by BMI and WHR. High serum HDL levels and PA were considered two protective factors for NAFLD. Smoking and gender did not have a significant relationship with NAFLD.
