1. Background
Hepatic encephalopathy (HE) is a severe neuropsychiatric complication of decompensated cirrhosis (DC) caused mainly by liver insufficiency and/or portal-systemic shunting (1). Based on the assessment of neuropsychological abnormalities and cognitive impairment, HE is divided into covert HE (CHE) and overt HE, according to the modified West-Haven criteria (2). The incidence and prevalence of HE vary depending on etiologies, severity, and the definition used (covert vs. overt) (3). Studies have reported that the overall incidence of HE was 11.6%, with OHE accounting for more than 34% of cases and being associated with poor survival (4, 5). rates. Given the high short-term mortality of DC patients with HE, risk stratification and timely liver transplantation are critical.
However, HE is not always reversible, and effective therapeutic strategies are minimal. The pathogenesis of HE in cirrhosis is complicated, primarily involving neurotoxicity caused by the accumulation of ammonia and manganese. Although ammonia levels can influence neuronal cell survival and predict HE-related outcomes, exploring without serial ammonia (6-8). measurements is challenging. Hence, there is a need for more effective prediction models.
To date, the relationship between the degree of liver fibrosis and the severity of HE, as well as the short-term outcomes of HE, has not been established. Several non-invasive scoring systems (NSSs) for evaluating liver fibrosis have been reported (9). including the Fibrosis-4 index (FIB-4), aspartate aminotransferase-to-platelet ratio index (APRI), and gamma-glutamyl transpeptidase-to-platelet ratio (GPR), which consist of hepatic enzymes and platelets and are well-known and widely used in clinical practice. Besides NSSs, whether underlying liver diseases and complications affect HE outcomes remains largely unknown.
2. Objectives
This retrospective study aimed to investigate the effect of non-invasive scoring systems (NSSs) and complications on the 3-month mortality prognosis in patients with decompensated cirrhosis (DC) and hepatic encephalopathy (HE). In addition, a new predictive nomogram was established and validated.
3. Methods
3.1. Patients and Data Collection
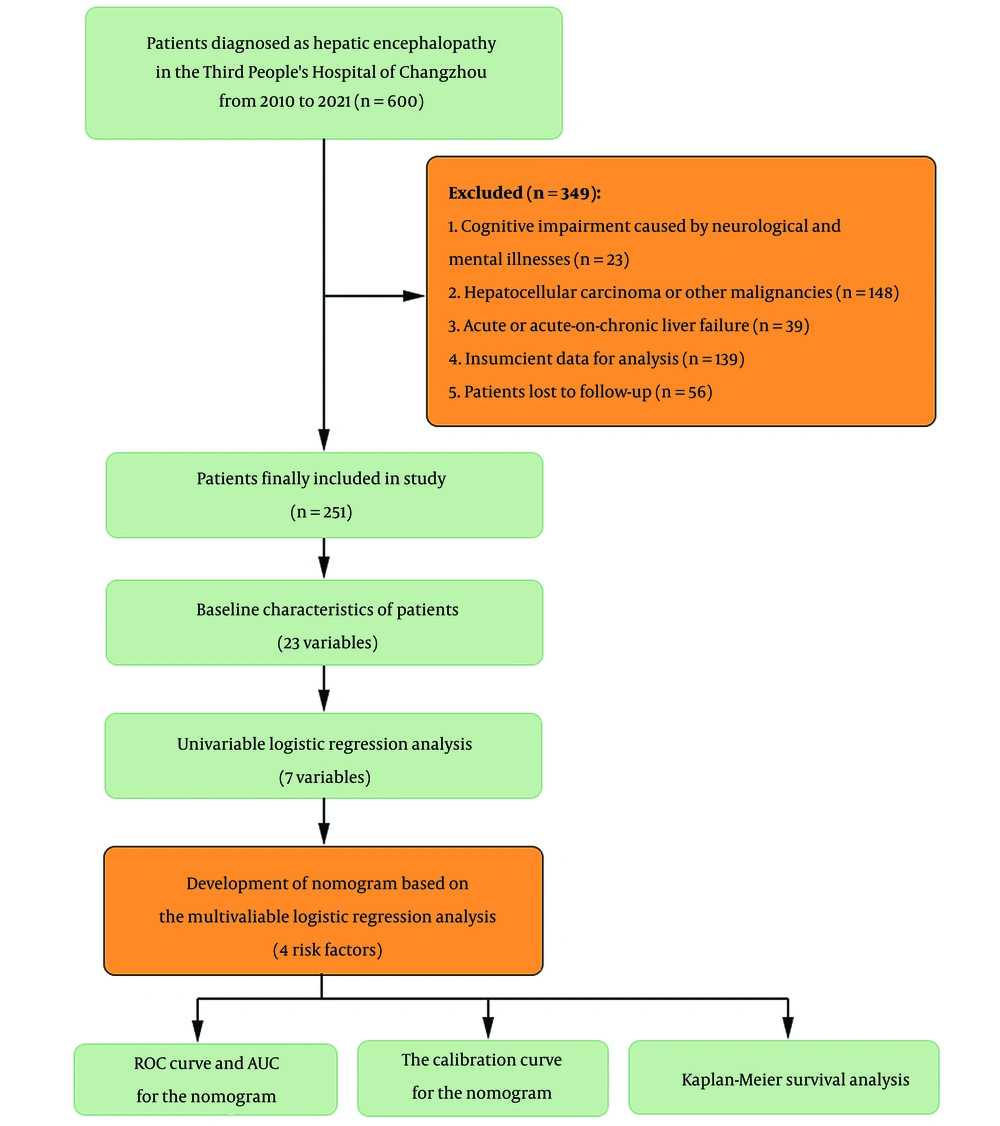
A total of 600 patients diagnosed with cirrhosis (DC) and hepatic encephalopathy (HE) were retrospectively recruited from the Third People's Hospital of Changzhou between August 2010 and August 2021. The diagnosis of HE was based on the following criteria: (1) Underlying DC, diagnosed through clinical, imaging, or endoscopic examination; and (2) overt HE diagnosed during the first admission. OHE was graded from I to IV using the West-Haven criteria (Grade I: Cognitive/behavioral decay but oriented in time and space; Grade II: Disoriented for time and space, with additional symptoms such as apathy or lethargy; Grade III: Unconscious but responsive to stimuli; Grade IV: Coma with no response to pain). Exclusion criteria included: (1) Cognitive impairment caused by neurological or mental illnesses; (2) hepatocellular carcinoma or other malignancies; (3) acute or acute-on-chronic liver failure; (4) insufficient data for analysis; and (5) patients lost to follow-up (Figure 1).
Patient characteristics and clinical data were extracted from the electronic medical record database. This included: (1) Demographic characteristics, such as age and gender; (2) disease-related data, such as etiology (HBV infection or non-HBV), HE grades, diabetes, hypertension, hepatorenal syndrome (HRS), spontaneous bacterial peritonitis (SBP), and upper gastrointestinal bleeding (UGIB); and (3) laboratory test results, such as alanine aminotransferase (ALT), aspartate aminotransferase (AST), gamma-glutamyl transpeptidase (GGT), total bilirubin (TBil), albumin, creatinine, serum sodium, leukocyte count (WBC), platelet count (PLT), and international normalized ratio (INR).
The endpoint of this study was 3-month mortality after the diagnosis of HE. Outcome data were extracted from hospital records and the civil registration system, and patients were divided into survivor and non-survivor groups based on their 3-month outcomes.
3.2. Non-invasive Scoring Systems
Non-invasive scoring systems, such as FIB4, APRI, and GPR, were calculated as previously described. Scoring systems for end-stage liver diseases, including the model for end-stage liver disease (MELD) (10), the Chronic Liver Failure-Consortium acute decompensation score (CLIF-C ADs) (11), and the Chinese Group on the Study of Severe Hepatitis B-acute on chronic liver failure score II (COSSH-ACLF IIs) (12) were analyzed. The Hepatic Encephalopathy Scoring Algorithm (HESA) (13) was also analyzed.
3.3. Statistical Analysis
Continuous data were presented as median (interquartile range [IQR]) and compared using the Mann-Whitney U test. Categorical data were expressed as frequency (percentage) and analyzed using the chi-square or Fisher's exact test. Independent risk factors for 3-month survival were analyzed using logistic regression analysis. A prognostic nomogram based on the results of the final regression analysis was created using R software (version 4.2.2). The regression coefficients in multivariate logistic regression were proportionally transformed into a score scale, and the sum of the scores was then translated into predicted probabilities (14). The required sample size was measured using the pmsampsize package in R to ensure precise predictions and minimize overfitting (15).
The performance of the nomogram was assessed through discrimination and calibration analyses. Discrimination was evaluated by calculating the area under the receiver operating characteristic curve (AUROC, also known as the C statistic). ROC curves were generated using MedCalc Software version 20.1.0 (Mariakerke, Belgium) to compare the predictive nomogram with other scoring systems. Calibration was evaluated using the Hosmer-Lemeshow test and a graphical representation of the predicted versus observed probabilities of mortality. Bootstrap resampling was used for internal validation in both discrimination and calibration analyses (16). Additionally, Kaplan-Meier survival analysis was performed to determine the accuracy of the new scoring system in predicting 3-month survival.
The statistical analyses and visualizations were performed using R version 4.2.2. All tests were two-tailed, and a P-value < 0.05 was considered statistically significant.
4. Results
4.1. Baseline Characteristics
Data from 251 patients with DC and HE were analyzed, and the baseline characteristics of these patients are presented in Table 1. Of these patients, 40 (15.9%) died within three months. Most patients in both the survivor and non-survivor groups were male, although patients in the non-survivor group tended to be older (P = 0.06). HBV infection was the primary etiology in both groups, and there was no significant difference in HE grades between the two groups (P > 0.05). However, ALT, AST, TBil, and creatinine levels were significantly higher, while serum sodium levels were lower in the non-survivor group (all P < 0.05).
| Variables | Survivors (n = 211) | Non-survivors (n = 40) | χ2/Z | P Value |
|---|---|---|---|---|
| Male, No. (%) | 133 (63.0) | 26 (65.0) | 0.056 | 0.81 |
| Age (y) | 62.0 (52.0 - 69.0) | 64.5 (56.3 - 72.8) | 1.856 | 0.06 |
| HBV infection, No. (%) | 119 (56.4) | 16 (40.0) | 3.638 | 0.06 |
| HE grades, No. (%) | 5.725 | 0.22 | ||
| Covert HE | 50 (23.7) | 7 (17.5) | ||
| Grade I | 67 (31.8) | 18 (45.0) | ||
| Grade II | 48 (22.7) | 5 (12.5) | ||
| Grade III | 28 (13.3) | 4 (10.0) | ||
| Grade IV | 18 (8.5) | 6 (15.0) | ||
| Diabetes, No. (%) | 36 (17.1) | 10 (25.0) | 1.416 | 0.23 |
| Hypertension, No. (%) | 67 (31.8) | 13 (32.5) | 0.009 | 0.93 |
| UGIB, No. (%) | 31 (14.7) | 18 (45.0) | 19.660 | < 0.01 |
| SBP, No. (%) | 32 (15.2) | 20 (50.0) | 24.841 | < 0.01 |
| HRS, No. (%) | 23 (10.9) | 15 (37.5) | 18.518 | < 0.01 |
| Laboratory tests | ||||
| ALT, U/L | 27.6 (18.0 - 47.9) | 34.0 (25.4 - 48.0) | 2.265 | 0.02 |
| AST, U/L | 38.0 (26.0 - 62.0) | 54.5 (33.0 - 83.8) | 2.682 | < 0.01 |
| GGT, U/L | 37.0 (21.0 - 76.0) | 76.0 (31.4 - 212.0) | 3.036 | < 0.01 |
| TBil, μmol/L | 35.8 (20.9 - 56.4) | 53.5 (27.6 - 93.1) | 2.482 | 0.01 |
| Albumin, g/L | 30.2 (26.0 - 34.7) | 31.9 (27.5 - 36.6) | 1.217 | 0.22 |
| Creatinine, μmol/L | 76.3 (64.0 - 93.0) | 84.6 (71.6 - 101.2) | 2.448 | 0.01 |
| Sodium, mmol/L | 140.2 (136.5 - 142.3) | 137.9 (133.7 - 140.8) | 2.267 | 0.02 |
| WBC, ×109/L | 4.8 (3.3 - 7.2) | 5.3 (3.4 - 7.6) | 0.765 | 0.44 |
| PLT, ×109/L | 94.0 (55.0 - 159.0) | 75.0 (50.5 - 108.5) | 1.746 | 0.08 |
| INR | 1.4 (1.2 - 1.6) | 1.4 (1.2 - 1.8) | 1.209 | 0.23 |
| MELD | 11.3 (7.1 - 15.3) | 15.5 (10.6 - 19.9) | 3.508 | < 0.01 |
| CLIF-C ADs | 113.1 (109.7 - 118.8) | 116.4 (112.1 - 125.6) | 2.693 | < 0.01 |
| COSSH_ACLF IIs | 6.9 (6.2 - 7.9) | 7.4 (6.9 - 8.8) | 3.304 | < 0.01 |
| FIB-4 | 5.8 (3.0 - 8.8) | 9.2 (5.7 - 13.2) | 3.539 | < 0.01 |
| APRI | 0.5 (0.3 - 0.8) | 0.9 (0.5 - 1.2) | 3.347 | < 0.01 |
| GPR | 0.4 (0.2 - 1.0`) | 1.0 (0.5 - 2.5) | 3.841 | < 0.01 |
Abbreviations: HBV, hepatitis B virus; UGIB, upper gastrointestinal bleeding; SBP, spontaneous bacterial peritonitis; HRS, hepatorenal syndrome; ALT, alanine aminotransferase; AST, aspartate aminotransferase; GGT, gamma-glutamyl transpeptidase; TBil, total bilirubin; WBC, white blood cell; PLT, platelet; INR, international normalized ratio; MELD, model for end-stage liver disease; CLIF-C Ads, Chronic Liver Failure-Consortium acute decompensation score; COSSH-ACLF IIs, Chinese Group on the Study of Severe Hepatitis B-acute on chronic liver failure score II; FIB-4, fibrosis-4 index; APRI, aspartate aminotransferase-to-platelet ratio index; GPR, gamma-glutamyl transpeptidase-to-platelet ratio.
The non-survivor group had higher incidences of DC-related complications, including HRS, SBP, and UGIB, than the survivors (all P < 0.01). Additionally, MELD, CLIF-C ADs, COSSH-ACLF IIs, and non-invasive scoring systems, including FIB-4, GPR, and APRI, were higher in the non-survivors (all P < 0.01).
4.2. Risk Factors and Nomogram
Univariate analysis revealed that FIB-4, TBil, HRS, SBP, and UGIB were associated with 3-month mortality (all P < 0.05). Subsequently, multivariate analysis showed that HRS, SBP, UGIB, and FIB-4 were independent risk factors for mortality within three months of HE diagnosis. However, APRI and GPR were insignificant risk factors (see Table 2 and Appendices 1 and 2).
| Univariate Analysis | Multivariate Analysis | |||
|---|---|---|---|---|
| OR (95% CI) | P Value | OR (95% CI) | P Value | |
| TBil | 1.013 (1.005 - 1.022) | < 0.01 | 0.07 | |
| Creatinine | 1.004 (1.000 - 1.009) | 0.05 | 0.87 | |
| Serum sodium | 0.985 (0.959 - 1.012) | 0.28 | ||
| UGIB | 4.904 (2.264 - 10.622) | < 0.01 | 4.264 (1.810 - 10.047) | < 0.01 |
| SBP | 5.594 (2.709 - 11.550) | < 0.01 | 5.378 (2.365 - 12.230) | < 0.01 |
| HRS | 4.904 (2.264 - 10.622) | < 0.01 | 4.846 (1.985 - 11.830) | < 0.01 |
| FIB4 | 1.065 (1.021 - 1.112) | < 0.01 | 1.089 (1.039 - 1.141) | < 0.01 |
Abbreviations: TBil, total bilirubin; UGIB, upper gastrointestinal bleeding; SBP, spontaneous bacterial peritonitis; HRS, hepatorenal syndrome; FIB-4, Fibrosis-4 index; OR, odds ratio; CI, confidence interval.
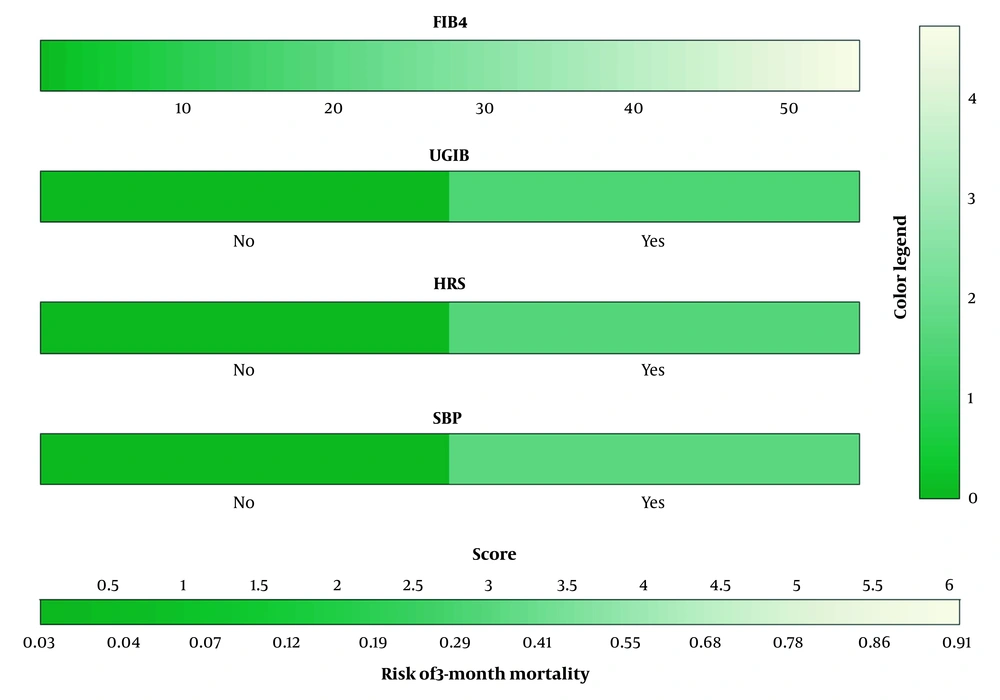
Based on the multivariate analysis, we developed a prognostic nomogram (FIBC) that includes FIB-4 and complications to predict the 3-month mortality of HE patients (Figure 2).
Nomogram consisting of FIB-4 and complications, including UGIB, SBP, and HRS, well predicting the 3-month mortality in patients with HE. The coefficients of FIB-4, UGIB, HRS, and SBP in multivariate logistic regression were 0.085, 1.450, 1.578, and 1.682, transformed into a score scale proportionally. The aggregate score was provided by summing up unique scores to assess the predicted risk. HE, hepatic encephalopathy; HRS, hepatorenal syndrome; SBP, spontaneous bacterial peritonitis; UGIB, upper gastrointestinal bleeding; FIB-4, Fibrosis-4 index.
4.3. Model Performance
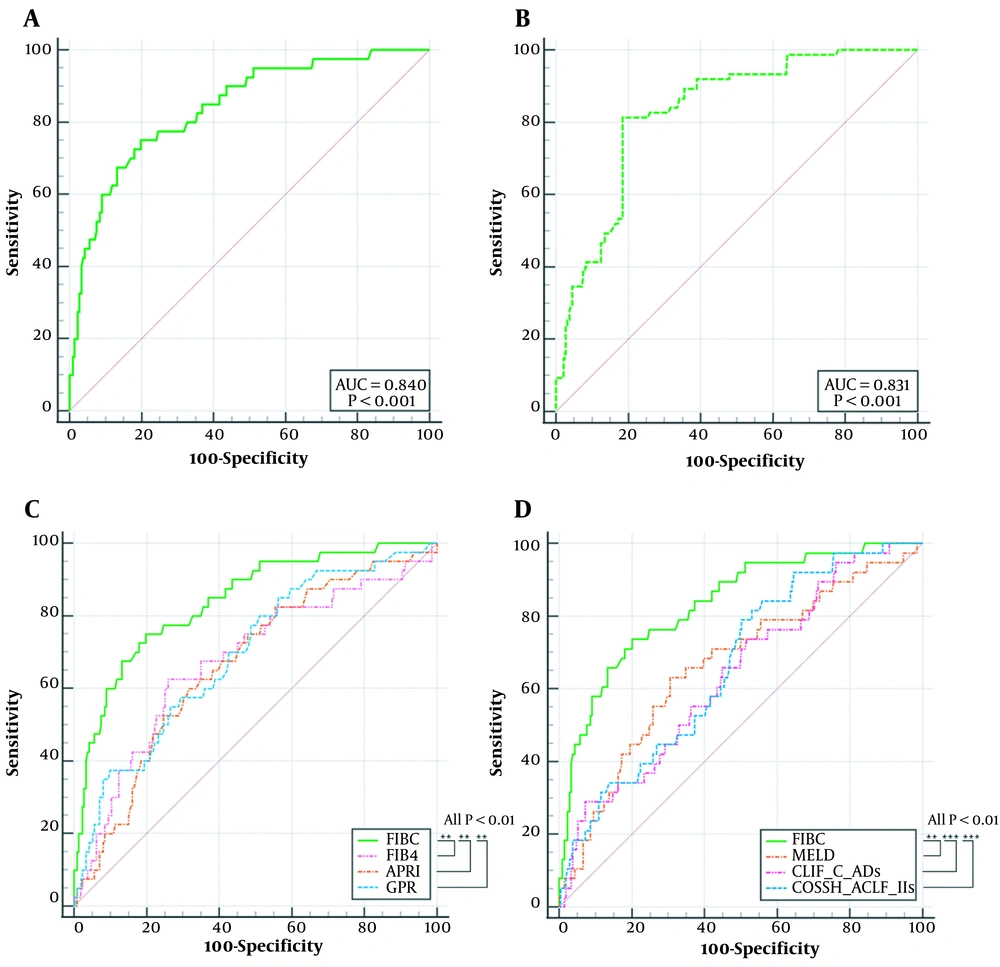
The discriminatory power of the prognostic nomogram was evaluated using an area under the receiver operating characteristic curve (AUROC) of 0.840 (95% confidence interval [CI], 0.789 - 0.883) and a bootstrap-corrected C statistic of 0.831. The AUROCs of MELD, CLIF-C ADs, COSSH-ACLF IIs, FIB-4, APRI, and GPR were 0.675, 0.637, 0.662, 0.676, 0.667, and 0.692, respectively. The AUROC of FIBC was significantly higher than those of the other indicators (all P < 0.01) (Figure 3).
ROC curves for 3-month mortality of HE (A) FIBC in training group; (B) FIBC in validation group via bootstrap resampling; (C) Comparison of FIBC, FIB-4, APRI, and GPR; (D) Comparison of FIBC, MELD, CLIF-C ADs, and COSSH-ACLF IIs. ROC, Receiver operating characteristic curves; FIBC, a nomogram consisting of FIB-4 and complications; MELD, model for end-stage liver disease; FIB-4, fibrosis-4 index; APRI, aspartate aminotransferase-to-platelet ratio index; GPR, gammaglutamyl transpeptidase-to-platelet ratio; CLIF_C Ads, Chronic Liver Failure-Consortium acute decompensation score; COSSH_ACLF IIs, Chinese Group on the Study of Severe Hepatitis B-acute on chronic liver failure score II. (P < 0.001)
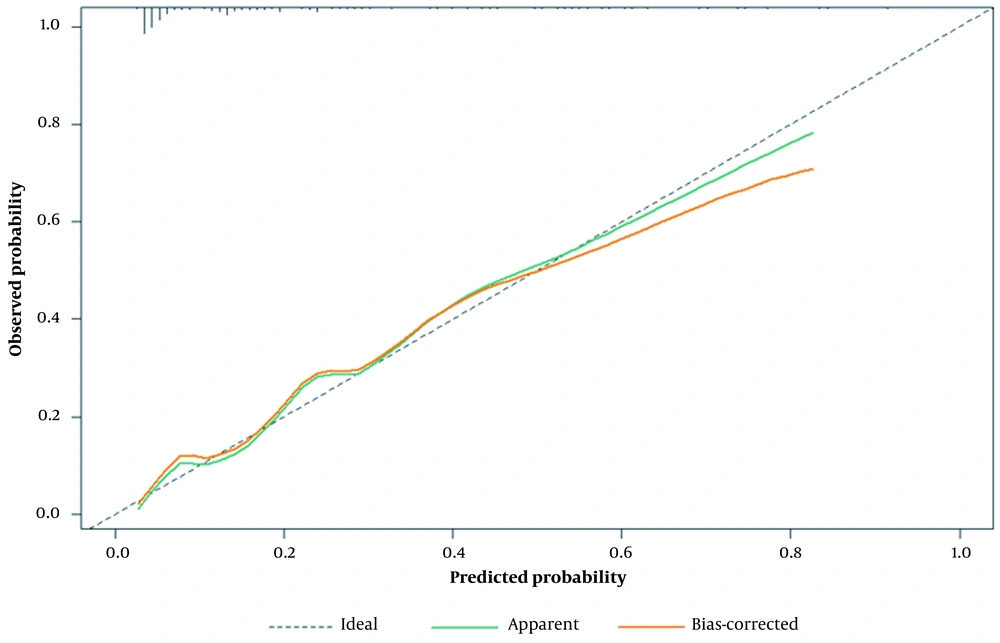
The calibration plot revealed a good fit between the predicted probabilities and the actual prevalence rates (mean absolute error = 0.016, calculated via 1,000 bootstrap samples), as demonstrated by the calibration curve (Figure 4). Furthermore, the Hosmer-Lemeshow test indicated good calibration (P = 0.771).
Calibration plot of the prognostic nomogram. The x-axis represents the expected probability, and the y-axis represents the actual probability. An ideal prediction would be consistent with the 45° gray line. The two solid lines indicate that the calibration was excellent in both the full cohort and after bias correction by bootstrapping (B = 1,000 repetitions).
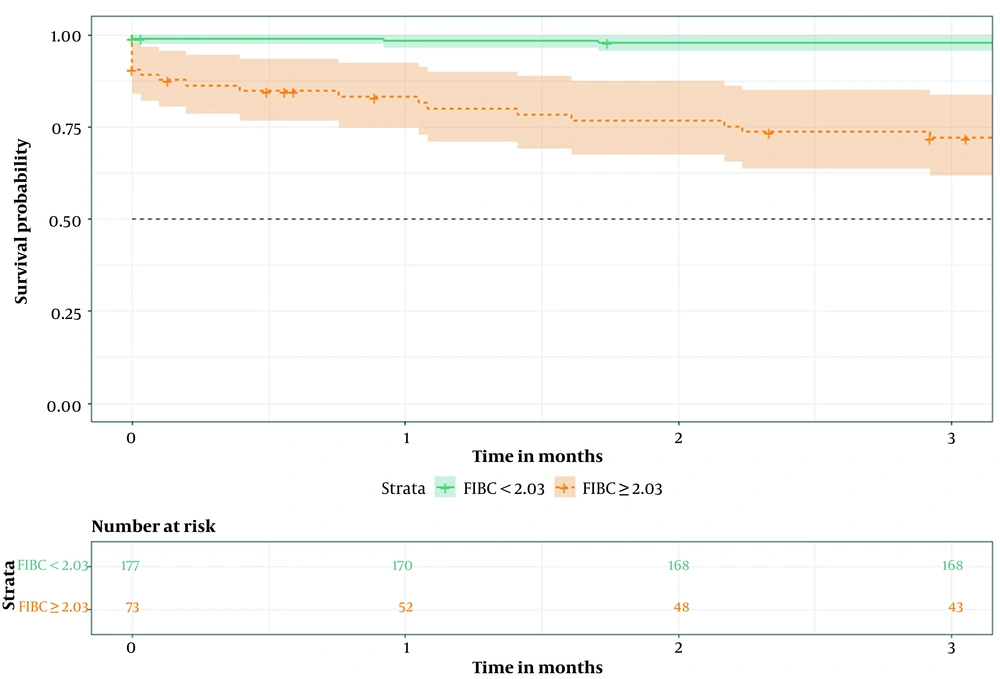
According to the optimal cutoff value in the ROC curve, patients were classified into two groups: The high-risk group (≥ 2.03) and the low-risk group (< 2.03). Kaplan-Meier survival analysis demonstrated that the 3-month cumulative survival rate was significantly lower in the high-risk group than in the low-risk group (P < 0.01) (Figure 5).
5. Discussion
In this study, we aimed to evaluate the predictive accuracy of NSSs in predicting the prognosis of patients with HE. Additionally, we developed and validated a new model, FIBC, which incorporates FIB-4 and complications.
Previous studies have validated the correlation between NSSs and cirrhosis in liver diseases with different etiologies. Studies have shown that FIB-4 and APRI are reliable NSSs for substantial fibrosis in patients with chronic hepatitis B, chronic hepatitis C, and nonalcoholic fatty liver disease but not in individuals with drug-induced liver injury and autoimmune liver disease (17-19) FIB-4 has been demonstrated to predict the formation of DC and adverse clinical outcomes of advanced fibrosis more accurately than other NSSs (20, 21) In this study, age was not included in the multivariate analysis since it was already used as an indicator in the FIB-4 formula. In contrast, age was included in the multivariate analyses using GPR or APRI, but neither GPR nor APRI was found to be an independent risk factor for 3-month mortality of HE (Appendices 1 and 2). These findings suggest that FIB-4 may be superior to GPR and APRI in predicting HE outcomes.
In patients with DC, mortality rates are high due to more than two complications (22). This study identified UGIB, SBP, and HRS as independent risk factors for HE-related mortality. UGIB has been shown to increase ammonia production and absorption in the intestines, while HRS is a severe complication of end-stage liver disease (11). Consistent with previous studies, HRS and UGIB were found to be independent risk factors for 3-month mortality in HE patients (23). In the present study, approximately half of the patients who died had SBP, the most common infection in patients with DC. Therefore, in addition to HRS and UGIB, SBP should be given greater attention in clinical practice for patients with DC and HE.
This study had several limitations. First, it was a single-center study with a relatively small sample size. Second, external validation and data on long-term mortality are necessary. Third, a few patients had normal ammonia levels, and the underlying mechanism of HE in such cases remains unclear.
5.1. Conclusions
In summary, the nomogram comprising FIB-4 and complications such as UGIB, SBP, and HRS effectively predicts the 3-month mortality in patients with HE.
