1. Background
Cirrhosis is considered a premalignant condition, and all patients with cirrhosis have an increased risk of developing hepatocellular carcinoma (HCC), regardless of the underlying cause (1). The main causes of cirrhosis include viral infections such as hepatitis B virus (HBV) and hepatitis C virus (HCV), alcohol-induced fatty liver disease (AFLD), cholestasis-related conditions like primary sclerosing cholangitis (PSC), autoimmune hepatitis (AIH), and metabolic disorders like non-alcoholic fatty liver disease (NAFLD). While viral infections were previously known to be the most common causes of liver cirrhosis, their prevalence has decreased due to HBV vaccination (2). On the other hand, the prevalence of cirrhosis due to cholestasis, AIH, and, specifically, non-alcoholic steatohepatitis (NASH) has been increasing in recent years (2). It has been suggested that immune-mediated mechanisms play a crucial role in the development of these types of cirrhosis, with autoantibodies being prominent in AIH, PSC, and NASH cirrhosis (3). However, the exact mechanisms underlying the pathogenesis of cirrhosis and the potential propensity of cirrhosis due to different etiologies for progression to HCC have yet to be fully understood.
AMP-activated protein kinase (AMPK), a eukaryotic cellular energy sensor, is a serine/threonine kinase that plays a crucial role in controlling cellular homeostasis in specialized tissues, including the liver, muscles, and fat (4). This kinase is a highly sensitive sensor that responds to increased AMP content and promotes ATP production. Additionally, AMPK is activated in certain pathological conditions, such as obesity, and regulates cellular homeostasis, including autophagy, apoptosis, the cell cycle, and cell metabolism (5, 6). Therefore, AMPK is predicted to be deregulated in a variety of pathological conditions, such as hepatic diseases (7). It should be noted that AMPK dysregulation can be either the cause or the outcome of hepatic diseases. Previous studies have also suggested a tumor suppressor activity for AMPK (8). Downregulation of AMPK in hepatocytes predisposes to HCC. AMPK promotes cell cycle arrest and apoptosis through multiple factors, including the p53 transcription factor (9).
The critical role of p53 in tumor suppression has been confirmed in several studies. However, recent studies have also recognized the positive role of p53 in the regulation of different metabolic pathways (10). The expression of p53 has been observed in the nuclei of hepatocytes from mice with fatty liver disease (11). A positive correlation has been reported between liver disease severity and p53 expression (12). Conversely, hepatic steatosis can develop in young p53-knockout mice (11). It has been hypothesized that the hyperactivation or loss of function of p53 can cause liver disease (13). However, similar to AMPK, p53 dysregulation can be either the cause or outcome of hepatic diseases (14). In view of the fact that hepatomegaly is observed in the early stages of liver diseases, atrophic liver becomes one of the main characteristics of end-stage liver disease. Additionally, hepatomegaly is a feature of HCC. It is important to notice that the rates of cell proliferation and death significantly change during the progression of liver disease. The rate of cellular proliferation/death and the balance between them are represented by changes in silver-stained nucleolar organizing regions (AgNOR) in the nuclei of hepatocytes and the expression of p53, a cell cycle regulator and a mediator of apoptosis, in the liver tissue, respectively (15).
2. Objectives
The propensity of liver cirrhosis caused by different etiologies for progression to HCC is not fully understood. However, some studies have reported that patients with HCV cirrhosis have a higher risk of developing HCC (16). A study on cell proliferation/death indicators in patients with liver cirrhosis can help better understand the impact of different liver injuries on the pathogenesis and development of cirrhosis. Thus, the aim of this study was to explore the levels of AMPK and PAMPK proteins as regulators of p53 and p53 gene expression, as well as AgNOR features in patients with cirrhotic livers caused by different etiologies compared to steatotic (as early-stage liver disease) and control liver tissues.
3. Methods
3.1. Tissue Samples
In total, 68 cirrhotic liver tissue samples were gathered from patients with PSC (n = 15), NASH (n = 15), AIH (n = 15), HBV and/or HCV (n = 14), and AFLD (n = 9) referred to the Namazi Transplant Center affiliated with the Shiraz University of Medical Sciences, Shiraz, Iran. The liver tissues of all eligible patients, according to the study’s inclusion criteria, were collected. The causes of cirrhosis were determined by an expert hepatologist team at the Namazi Transplant Center using standard diagnostic criteria. Fifteen control liver samples and 15 liver tissue samples from patients with simple steatosis were collected from those undergoing tissue resection due to benign liver diseases at the Shiraz Central Hospital. Simple steatosis was defined as >5% steatosis in the liver tissue in the absence of inflammation or fibrosis (17). Patients older than 18 years were included in the study. All cirrhotic tissues obtained from patients diagnosed with only one of the desired etiologies in the absence of any other form of liver disease (e.g., Wilson's disease, hemochromatosis, etc.) were included in the study. The tissues from steatosis or control groups were obtained from subjects without any form of infections or known liver inflammation. Liver tissue samples were halved; one piece was frozen immediately and stored at −80 °C for molecular and biochemical measurements, and the other part was fixed in 4% formalin for histological analysis. Based on histological findings, control tissues with abnormal histological features, steatotic tissues with abnormalities other than steatosis, and cirrhotic tissues with etiologies other than the aforementioned common causes were excluded.
The Research Ethics Committee of the Hamadan University of Medical Sciences approved the study (approval number: IR.UMSHA.REC.1399.705). All procedures were performed in accordance with the 1964 Helsinki Declaration and the ethical standards of the National Research Committee of Iran. Written informed consent was obtained from all participants.
3.2. Histological Examinations and AgNOR Staining
In order to confirm the presence of cirrhosis, determine its etiology, verify the intactness of control tissues, and approve liver steatosis, fixed liver tissues were subjected to hematoxylin and eosin (H&E) staining. The silver nitrate method was performed for AgNOR staining using standard protocols (18). AgNOR-stained sections were examined under a light microscope (Echo Lab microscope, Italy) attached to an image analysis system (Echo Lab camera, Italy). AgNOR examination was performed under ×1000 magnification using oil immersion. Within the nucleus, AgNORs appear as discrete black-brown dots. AgNORs’ features, including their count, length, and area, were determined by observing at least 100 nuclei in each sample using Scion Image software (Scion, Frederick, MD, USA).
3.3. Western Blot Analysis
All frozen cirrhotic and control liver tissues were lysed by a radioimmunoprecipitation assay (RIPA) buffer containing protease inhibitors (catalog No.: P8340; Sigma-Aldrich, St. Louis, MO, USA). The expression of the target proteins was determined using the bicinchoninic acid protein assay. Primary monoclonal antibodies against pAMPK (Cell Signaling Technology, Beverly, MA, USA) and AMPK (Abcam, Cambridge, MA, USA) and a secondary antibody, horseradish peroxidase-conjugated goat anti-rabbit IgG (Abcam, Cambridge, MA, USA), were used for western blot analysis. The blots were visualized using the enhanced chemiluminescence method and recorded on an X-ray film (Fuji, Tokyo, Japan). As a control, β-Actin was used to normalize the data.
3.4. Gene Expression Analysis by qRT-PCR
Total RNA was extracted from frozen liver samples using an RNeasy Mini Kit (catalog No.: 74104; Qiagen, Germany), and a cDNA synthesis kit (Thermo Fisher Scientific, Waltham, MA) was used to generate first-strand cDNA templates. The gene expression of p53 was analyzed by quantitative real-time polymerase chain reaction (qRT-PCR) (Light Cycler 96 real-time PCR system, Roche, Germany). The thermal cycling condition was as follows: 95°C for 15 min, followed by 40 cycles of 95°C for 20 s, 52°C for 30 s, and 72°C for 30 s. Primer sequences were as follows: ACTB: 5′- GAGCCTCGCCTTTGCCGATCC-3′ (forward) and 5′- ACATGCCGGAGCCGTTGTCG-3′ (reverse), p53: 5′-AGAGGAAGAGAATCTCCGCAAG-3′ (forward) and 5′- TTGGGCAGTGCTCGCTTAG-3′ (reverse). The reaction was performed in triplicate, and relative changes in p53 gene expression were determined using the 2−ΔCT formula. The ACTB gene was used as an internal control.
3.5. Statistical Analysis
Data analysis was performed using SPSS software (version 16.0; SPSS, Inc., Chicago, IL, USA). The data of AgNOR staining, western blotting, and qRT-PCR were analyzed by one-way analysis of variance (ANOVA) and the independent t-test. The distribution of the data was examined using the Shapiro–Wilk test and Spearman’s correlation coefficient was used to examine the relationships between the investigated parameters. The results were expressed as mean ± standard error of the mean (mean ± SEM), and statistical significance was set at P < 0.05.
4. Results
In the present study, all tissue samples underwent pathological examination, which served as the gold standard method for approving the diagnosis. The clinical and demographic features of the study participants have been summarized in Table 1. Among patients with cirrhosis, those with viral infections (53.64 ± 8.9 years) and NASH (51.66 ± 10.31 years) had higher mean ages compared to those diagnosed with other etiologies. Alcoholic patients had the highest MELD score (30.2 ± 6.7). Unlike other cirrhosis etiologies, females constituted most of the patients with AIH (73.33%). Patients with simple steatosis (30.39 ± 4.36 kg/m2) and NASH-related cirrhosis (29.05 ± 3.39 kg/m2) had the highest BMIs.
| Control Subjects | Simple Steatosis | NASH Cirrhosis | PSC Cirrhosis | AIH Cirrhosis | Alcoholic Cirrhosis | HBV/HCV Cirrhosis | |
|---|---|---|---|---|---|---|---|
| No. of subjects | 15 | 15 | 15 | 15 | 15 | 9 | 14 |
| Sex (male/female) | 9/6 | 4/11 | 9/6 | 5/10 | 4/11 | 8/1 | 9/5 |
| Age, y | 43.2 ± 9.16 | 44.11 ± 9.32 | 51.66 ± 10.31 | 37.4 ± 11.78 | 33.13 ± 11.5 | 36.33 ± 9.3 | 53.64 ± 8.9 |
| BMI, kg/m2 | 22.75 ± 3.27 | 30.39 ± 4.36 | 29.05 ± 3.39 | 26.1 ± 4.3 | 24.4 ± 3.9 | 28.5 ± 5.2 | 26.15 ± 4.8 |
| MELD score | - | - | 22.33± 3.84 | 18.33 ± 5.2 | 21.3 ± 4.8 | 30.2 ± 6.7 | 23.2 ± 7 |
Abbreviations: HBV, hepatitis B virus; HCV, hepatitis C virus; NASH, non-alcoholic steatohepatitis; AIH, autoimmune hepatitis; PSC, primary sclerosing cholangitis; BMI; body mass index; MELD, model for end-stage liver disease.
4.1. The Protein Levels of AMPK and pAMPK in Cirrhotic Liver Tissues
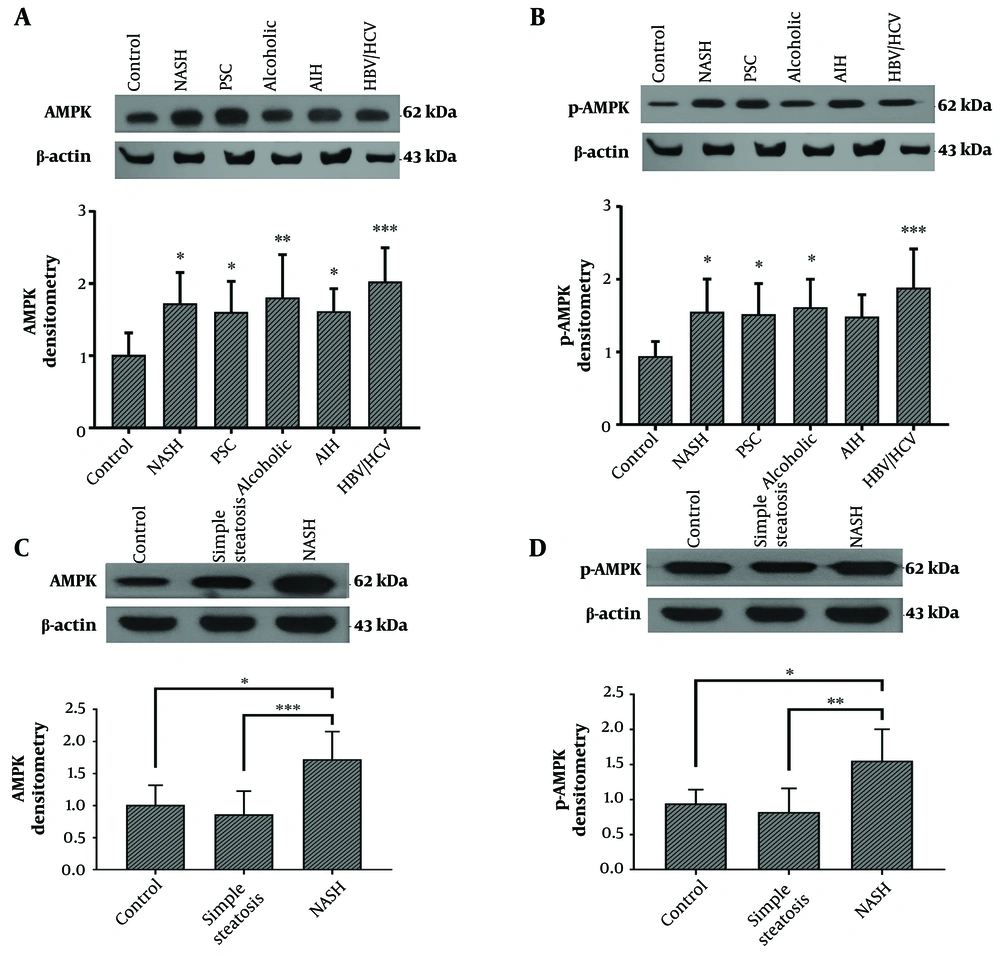
The results of this study showed that the protein level of AMPK was significantly increased in all cirrhotic liver tissues obtained from patients with different etiologies compared to the control group. This increase was greater in cirrhotic livers from HBV/HCV-infected patients (Figure 1A). Additionally, the protein level of pAMPK was significantly increased in all cirrhotic groups, especially in the livers of patients with HBV/HCV infection, except for AIH-related cirrhosis (Figure 1B). The protein levels of AMPK and pAMPK in the liver tissues of patients with simple steatosis were insignificantly lower compared to the control group (Figure 1C and D).
A and B, AMPK and pAMPK protein levels in the cirrhotic liver tissues from patients with PSC (n = 15), NASH (n = 15), AIH (n = 15), alcohol toxicity (n = 9), HBV/HCV (n = 14), and normal liver tissue as control (n = 15). C and D, AMPK and pAMPK protein levels in the liver tissues of patients with NASH-related cirrhosis (n = 15), simple steatosis (n = 15), and normal liver tissue as control (n = 15). Western blotting bands are representative of one sample per group. ImageJ software (National Institutes of Health, Bethesda, MD, USA) was used to quantify band intensity. β-actin levels were used to normalize western blotting results. The results represent mean ± SEM. (*P < 0.05; **P < 0.01; and ***P < 0.001 vs. control). AIH: autoimmune hepatitis; HBV: hepatitis B virus; HCV: hepatitis C virus; NASH: non-alcoholic steatohepatitis; PSC: primary sclerosing cholangitis.
4.2. Does the Etiology of Cirrhosis Affect p53 Gene Expression?
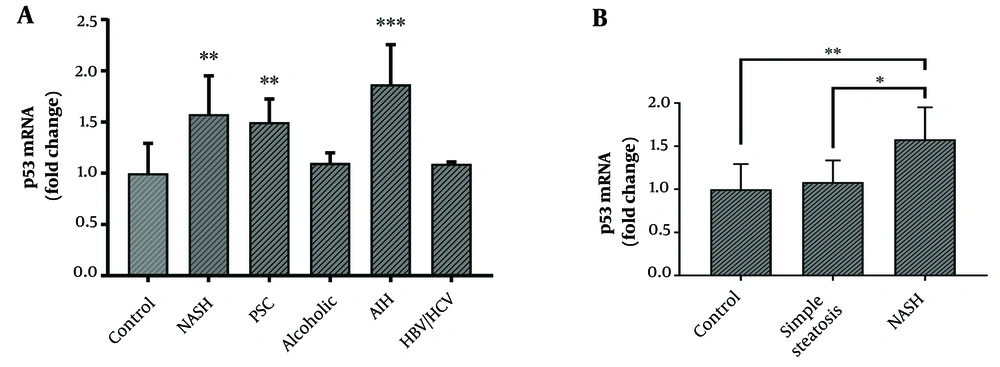
The mRNA level of p53 was significantly increased in the cirrhotic liver tissues of patients with PSC, NASH, and AIH as compared to the control group (Figure 2A). However, p53 gene expression showed no significant difference between the simple steatosis and control groups (Figure 2B). The protein levels of AMPK and p-AMPK showed no significant correlation with the mRNA level of p53 in cirrhotic liver tissues.
A, mRNA levels of p53 in cirrhotic liver tissues from patients with PSC (n = 15), NASH (n = 15), alcohol toxicity (n = 9), HBV/HCV (n = 14), AIH (n = 15), and normal liver tissue as control (n = 15). B, mRNA levels of p53 in the liver tissues from patients with NASH cirrhosis (n = 15), simple steatosis (n = 15), and normal liver tissue as control (n = 15). The ACTB gene was used to normalize the data. Results represent fold-change relative to the control and are expressed as mean ± SEM. (*P < 0.05; **P < 0.01; and ***P < 0.001 vs. control). AIH: autoimmune hepatitis; HBV: hepatitis B virus; HCV: hepatitis C virus; NASH: non-alcoholic steatohepatitis; PSC: primary sclerosing cholangitis.
4.3. AgNOR Features in Cirrhotic and Non-cirrhotic Liver Tissues
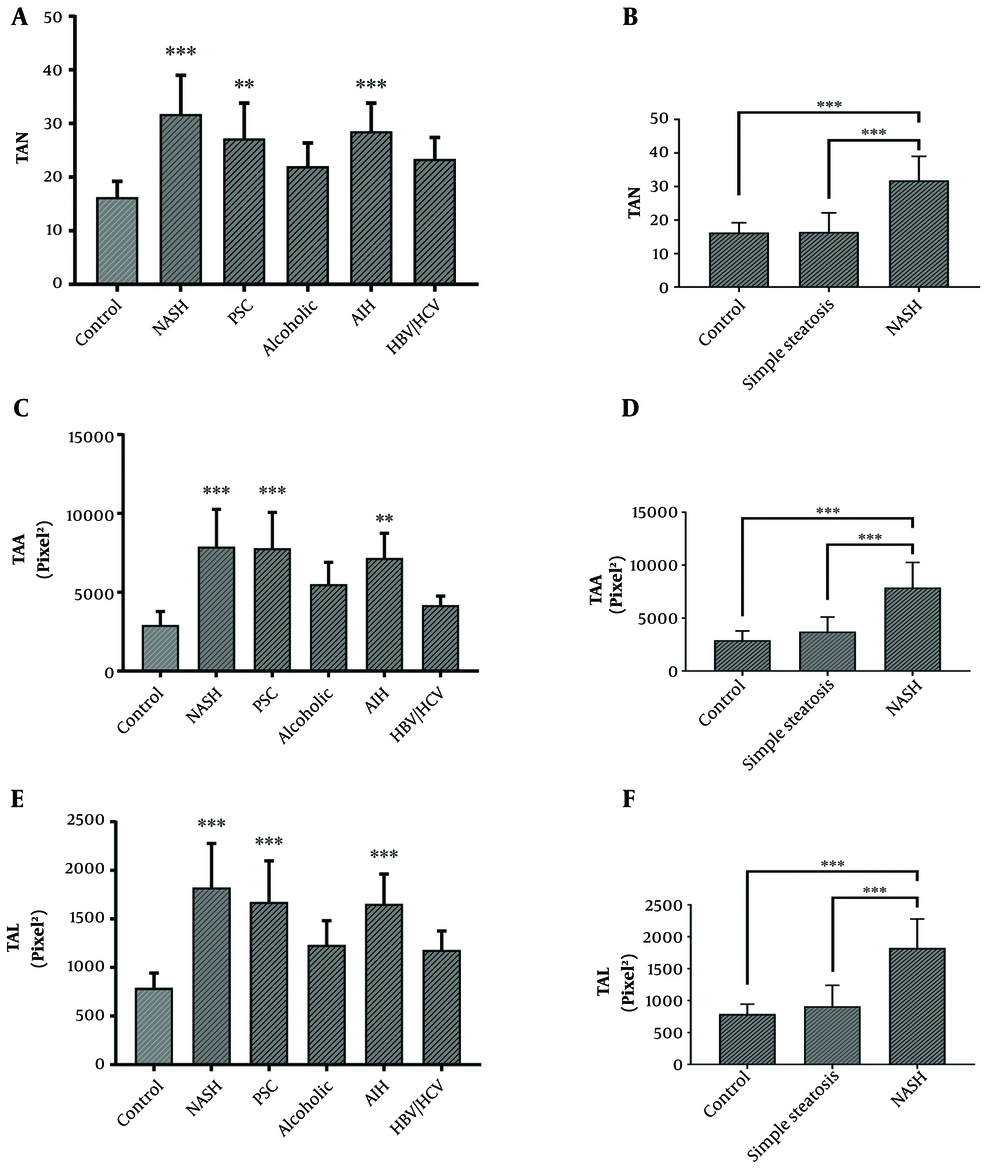
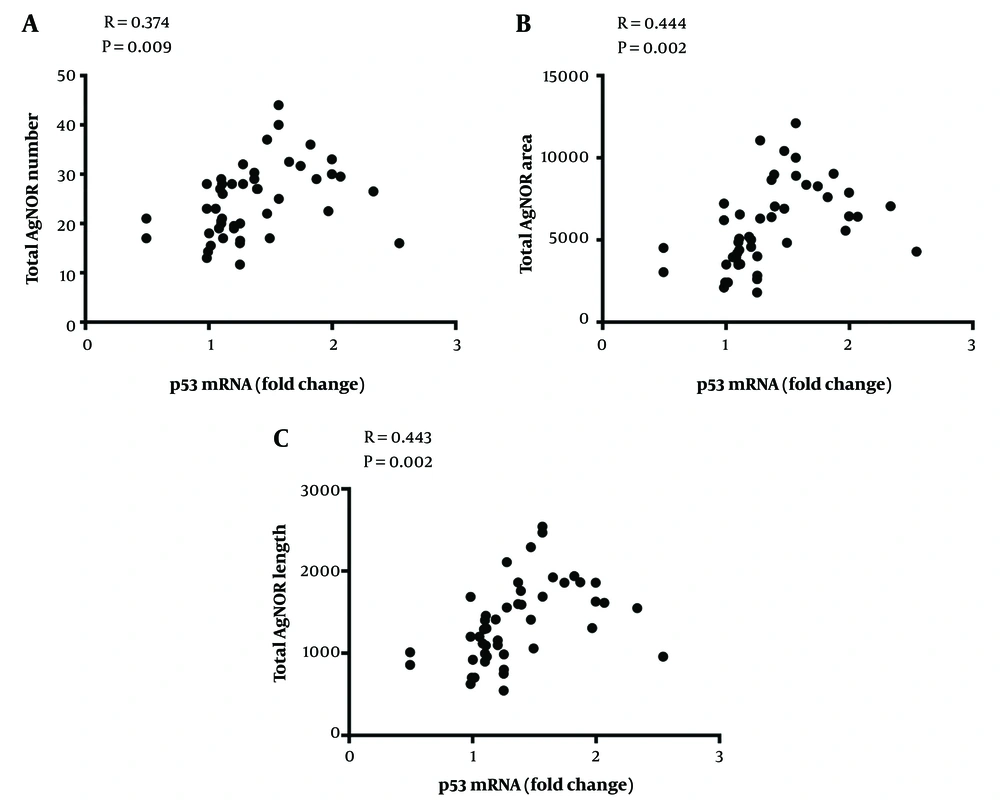
AgNOR staining results showed that the total AgNOR number (TAN), total AgNOR length (TAL), and total AgNOR area (TAA) were significantly higher in cirrhotic liver tissues from patients with NASH, PSC, and AIH than in controls; however, there was no significant difference between cirrhotic liver tissues from alcoholic individuals or those with HBV/HCV infections and controls (Figure 3A, C, and E). Also, AgNOR features were analyzed in tissues from patients with simple steatosis, reflecting features that were similar to that of the control group (Figure 3B, D, and F). There were statistically significant positive correlations between p53 gene expression and AgNOR features in cirrhotic liver tissues (Figure 4).
A, C, and E, AgNOR features including TAN, TAL, and TAA in cirrhotic liver tissues from patients with PSC (n = 15), NASH (n = 15), AIH (n = 15), alcohol toxicity (n = 9), HBV/HCV (n = 14), and normal liver tissue as control (n = 15). B, D, and F, AgNOR features in the liver tissues of patients with NASH cirrhosis (n = 15), simple steatosis (n = 15), and normal liver tissue as control (n = 15). The results represent mean ± SEM. (*P < 0.05; **P < 0.01; and ***P < 0.001 vs. control). TAN: total AgNOR number; TAL: total AgNOR length; TAA: total AgNOR area; AIH: autoimmune hepatitis; HBV: hepatitis B virus; HCV: hepatitis C virus; NASH: non-alcoholic steatohepatitis; PSC: primary sclerosing cholangitis.
5. Discussion
Several causes have been reported to lead to liver diseases and liver cirrhosis, including viral infections, cholestasis, metabolic diseases, alcohol consumption, and autoimmune diseases. In most cases, the exact mechanism underlying liver injury remains obscure and incompletely understood. At the same time, no specific etiology is identifiable in a considerable number of patients with liver cirrhosis despite extensive investigations (i.e., cryptogenic cirrhosis). Regardless, all patients with liver cirrhosis are predisposed to HCC. Accordingly, in the present case-control study, the gene expression of p53, a cell cycle regulator and a mediator of apoptosis, and the protein levels of AMPK and pAMPK, as p53 regulators, as well as AgNOR features, as cell proliferation indicators, were investigated in cirrhotic liver tissues obtained from patients with different liver diseases. In addition, due to the role of p53, AMPK, and pAMPK in the regulation of cellular metabolic pathways, we also explored these factors in the liver tissues of patients with simple steatosis.
Previous studies have confirmed a protective role for AMPK against liver fibrosis (19, 20). In the present study, AMPK and pAMPK protein levels were increased in cirrhotic liver tissues, and this increase was more pronounced in patients with viral hepatitis. According to these results, two questions arise: (1) Why does fibrosis occur despite AMPK up-regulation and activation? (2) How do liver disease causes affect AMPK expression and activation? hepatocytes probably increase AMPK expression and activation in response to injuries; however, in the case of extremely severe and prolonged injuries, it cannot prevent the development of fibrosis. The effects of different causes of liver disease on AMPK expression and activation, and thereby, liver fibrosis, have not been elucidated despite extensive studies on the role of AMPK in the pathogenesis of liver disease due to various etiologies. A brief review of previous studies revealed that AMPK affects the development of liver fibrosis in most patients, particularly in those with HCV infection and fatty liver diseases. AMPK has been reported to decrease the expression of fibrosis-related genes in HCV-infected cells (20). Other studies have shown that HCV core protein can affect AMPK activity and that HCV genome replication decreases AMPK phosphorylation (21). Moreover, HCV genome replication is amplified by AMPK suppression and vice versa (10, 22). In contrast, it has been shown that AMPK signaling inhibits liver fibrosis induced by alcohol consumption and following NASH (19, 23). Therefore, AMPK overexpression in the liver seems to be a general response to cirrhosis, and this increase may be partially dependent on the etiology of liver disease, such as viral hepatitis and fatty liver. Interestingly, we also observed that AMPK and pAMPK protein levels were decreased, but not significantly compared to controls, in the liver tissues of patients with simple steatosis. Previous studies have shown that many of the medications suggested for NAFLD promote AMPK activation (7), which can oppose steatosis development (24). Thus, simple liver steatosis may be induced via AMPK downregulation and inactivation.
Regarding the role of p53 as a mediator of cell cycle arrest and apoptosis promoted by AMPK, p53 gene expression was assessed, and its potential correlation with AMPK and pAMPK levels was investigated in patients with liver cirrhosis. The results showed that there was no significant correlation between these parameters. As postulated in previous studies, p53 expression and activity are regulated by several mechanisms, and our findings indicated that the master regulator of p53 gene expression was independent of the AMPK signaling pathway in patients with liver cirrhosis (25). Meanwhile, it was observed that p53 gene expression might be affected by the etiology of liver disease as only patients with AIH-, PSC-, and NASH-related cirrhosis had significantly higher p53 gene expression compared to the control group. Similar to p53 expression, AgNOR features were also significantly increased only in patients with AIH, PSC, and NASH, indicating a significant and positive correlation between AgNOR features and p53 gene expression in cirrhotic liver tissues. These findings suggest that patients with liver cirrhosis due to AIH, PSC, and NASH are predisposed to developing HCC. It has already been approved that HBV and HCV infections, as well as alcohol abuse, are the major risk factors for HCC (26, 27). However, it should be noted that viral infections and alcohol consumption are the main causes of cirrhosis only in some geographical regions (28, 29). Besides, specific laboratory tests for viral infections and a precise history taking can help identify many patients with HBV-, HCV-, and alcohol-related cirrhosis. However, there are no laboratory tests or definitive criteria for the diagnosis of AIH, NASH, and PSC. Thus, it is likely that a considerable percentage of AIH, NASH, and PSC patients will remain undiagnosed, so related cirrhosis will be named cryptogenic. In addition, autoimmune diseases play an important role in the pathogenesis of liver cirrhosis secondary to AIH, NASH, and PSC and their progression to HCC (30). Progression to HCC has also been reported in NASH, even in the absence of cirrhosis (31), suggesting shared pathologic mechanisms for these conditions. According to our findings, patients with liver cirrhosis due to AIH, NASH, and PSC are more likely to develop HCC than those with cirrhosis caused by viral infections and alcohol toxicity. Further studies are required to confirm this claim. Moreover, AgNOR features and p53 gene expression were similar in liver tissues obtained from patients with simple steatosis and control subjects. These findings suggest that cellular proliferation/apoptosis rates remain unaffected in patients with simple steatosis.
There are some worth-mentioning limitations in this study, including the small sample size, sample recruitment strategy (i.e., collecting cirrhotic liver tissues from patients undergoing liver transplantation), and lack of following patients up to monitor their long-term outcomes, including progression to HCC. Also, since gender might have been a confounding factor with regard to some liver disease etiologies, it is suggested to assess the variables studied here in each gender separately, demanding further investigations with different designs (like cohort studies) to determine whether etiologies such as PSC, AIH, and NASH can predispose patients to HCC.
In conclusion, we showed that AMPK and pAMPK protein expressions were increased in cirrhotic liver tissues obtained from patients with different etiologies, suggesting these mediators as parts of a general response to cirrhosis. In addition, the downregulation of AMPK and pAMPK may be an important mechanism of liver steatosis. P53 gene expression was increased in patients with liver cirrhosis, which was dependent on the etiology but independent of the AMPK signaling pathway. In parallel with p53 gene upregulation, AgNOR features were pronounced in patients with PSC-, AIH-, and NASH-related cirrhosis, showing a positive correlation with p53 gene expression. Overall, alcohol abuse and viral infections can be considered important risk factors for HCC.


