


1. Background
Non-alcoholic fatty liver disease (NAFLD) affects over 50% of patients with type 2 diabetes mellitus (T2DM) worldwide (1-3). Non-alcoholic fatty liver disease shares insulin resistance as a key pathogenic mechanism with T2DM and increases the risk of developing T2DM (4, 5). Non-alcoholic steatohepatitis (NASH), a progressive form of NAFLD, is diagnosed when liver fat exceeds 5% of liver volume and is associated with elevated levels of alanine aminotransferase (ALT) and aspartate aminotransferase (AST) (6). In T2DM patients, ALT levels may underestimate the severity of fatty liver disease (7). The NASH can progress to fibrosis, cirrhosis, and hepatocellular carcinoma (HCC), leading to increased mortality risk (8, 9) and a higher risk of cardiovascular disease (10).
Several glucose-lowering agents, including liraglutide and pioglitazone, have demonstrated metabolic and histological improvements in patients with NASH (11, 12). Sodium-glucose cotransporter 2 (SGLT2) inhibitors promote urinary glucose excretion by acting on the proximal renal tubules and are also beneficial to kidney function (13). Clinical trials and animal studies have shown positive effects of SGLT2 inhibitors on liver function (14-16). Empagliflozin, a selective SGLT2 inhibitor, facilitates weight loss by reducing fat mass (17-22). Furthermore, this drug is effective in reducing cardiovascular events and mortality (23, 24). A 2021 study demonstrated that 24 weeks of treatment with 25 mg/day of empagliflozin improved histological markers of inflammation in T2DM patients with NASH (25).
2. Objectives
This interventional study aims to investigate the impact of empagliflozin on hepatic enzymes and liver function tests, lipid profile, anthropometric indices, and liver ultrasound findings in T2DM patients with NASH.
3. Methods
3.1. Study Design
This study was a 24-week, prospective, randomized, placebo-controlled clinical trial conducted at Ayatollah Rouhani Hospital in Babol. It adhered to the principles of the Declaration of Helsinki and was approved by the Ethics Committee of Babol University of Medical Sciences (IR.MUBABOL.REC.1400.186). The study was registered with the Iranian Registry of Clinical Trials (IRCT) under the code IRCT20210609051526N2. All participants provided written informed consent at the time of enrollment.
3.2. Study Participants
Patients aged 18 - 85 years with a confirmed diagnosis of T2DM and NASH, hemoglobin A1C (HbA1c) levels between 7% and 10%, and a body mass index (BMI) ≤ 35 kg/m2 were included. The exclusion criteria were: A history of hepatitis, alcohol or drug abuse, use of hepatic steatosis-inducing drugs (amiodarone, tamoxifen, methotrexate, glucocorticoids, and valproate), thiazolidinedione (TZD) or glucagon-like peptide-1 (GLP-1) receptor agonists, pregnancy or HELLP syndrome in previous pregnancies, hepatocellular carcinoma or cirrhosis, and contraindications to empagliflozin (including recurrent urogenital infections or allergic reactions to the drug). Participants were randomized using the block randomization method and assigned to two groups in a 1:1 ratio.
3.3. Procedures
The placebo group received a standard T2DM regimen (sulfonylureas, DPP-4 inhibitors ± alpha-glucosidase inhibitors, biguanides, insulin, liraglutide, and sitagliptin/gliclazide) along with a placebo, while the treatment group received the same regimen plus 10 mg of empagliflozin daily. Baseline data—including age, gender, weight, height, waist circumference, BMI, duration of diabetes, history of cardiovascular disease, hypertension (HTN), chronic kidney disease, liver enzymes, lipid profile, GGT, bilirubin, and liver ultrasound—were collected from medical records, with additional tests performed as needed. Patients were evaluated at 12 and 24 weeks through clinical examinations, laboratory tests, and imaging studies.
3.4. Statistical Analysis
Data were analyzed using SPSS version 22. Descriptive statistics were reported as mean, standard deviation, frequency, and percentage. The effect of empagliflozin was assessed using repeated measures ANOVA and Friedman’s test for multiple analyses, based on both quantitative and qualitative variables. Additionally, univariate analyses were conducted according to qualitative variables such as age, gender, BMI, and duration of diabetes. A P-value of less than 0.05 was considered statistically significant.
4. Results
4.1. Patient Characteristics
A total of 210 individuals were assessed, of whom 140 met the inclusion criteria and were enrolled in the study, with equal allocation to the treatment (n = 70) and placebo (n = 70) groups. Ultimately, 110 participants successfully completed the trial (Figure 1). The average age of participants was approximately 50 years (ranging from 22 to 78 years), with an equal male-to-female ratio and a mean BMI in the overweight range. More than half had a history of diabetes exceeding three years, and one-third were diagnosed with grade 2 fatty liver based on ultrasound findings. Additional details are provided in Tables 1 and 2.

The CONSORT flowchart
| Variables | No. (%) |
|---|---|
| Gender | |
| Female | 54(50.9) |
| Male | 56 (49.1) |
| Age | |
| < 50 | 62 (56.4) |
| ≥ 50 | 48 (43.6) |
| Hypertension | |
| Yes | 38 (34.5) |
| No | 72 (65.5) |
| Cardiovascular disease | |
| Yes | 35 (34.5) |
| No | 75 (65.5) |
| Chronic kidney disease | |
| Yes | 31 (28.2) |
| No | 79 (71.8) |
| BMI | |
| Normal | 36 (32.7) |
| Overweight | 60 (54.5) |
| Obese | 14 (12.7) |
| Diabetes mellitus duration (y) | |
| < 3 | 51 (46.4) |
| ≥ 3 | 59 (53.6) |
| Liver ultrasound | |
| Normal | 24 (21.8) |
| Grade 1 | 20 (18.2) |
| Grade 2 | 48 (43.6) |
| Grade 3 | 18 (16.4) |
| Variables | Mean ± SD |
|---|---|
| Diabetes duration (y) | 3.32 ± 1.74 |
| Weight (kg) | 86.91 ± 11.39 |
| Height (cm) | 180.94 ±7.03 |
| Waist circumference (cm) | 93.89 ± 13.78 |
| BMI (kg/m2) | 26.53 ± 3.03 |
| AST (IU/L) | 40.63 ± 18.96 |
| ALT (IU/L) | 36.30 ± 16.35 |
| ALP (IU/L) | 348.48 ± 86.77 |
| GGT (IU/L) a | 49.56 ± 14.20 |
| Total bilirubin (mg/dL) | 0.79 ± 0.49 |
| Direct bilirubin (mg/dL) | 0.51 ± 0.31 |
| Cholesterol (mg/dL) | 230.91 ± 78.10 |
| Triglyceride (mg/dL) | 238.72 ± 80.90 |
| HDL (mg/dL) | 30.98 ± 7.30 |
| LDL (mg/dL) | 221.77 ± 68.00 |
Abbreviations: BMI, body mass index; ALT, alanine aminotransferase; AST, aspartate aminotransferase.
a This test was performed only for 16 patients due to the costs and lack of laboratory kits, of which six patients were of the treatment group with empagliflozin.
In the treatment group, levels of AST, ALT, ALP, and direct bilirubin decreased significantly. HDL increased, while LDL decreased; however, changes in triglyceride and total cholesterol levels were not statistically significant. In the placebo group, fatty liver grades at baseline, 12 weeks, and 24 weeks were 2.02, 2.07, and 1.91, respectively (P = 0.459). In contrast, the treatment group showed a decline in fatty liver grades from 2.50 to 2.05 and 1.45 over the same period—a 42% reduction (P < 0.001). Detailed data are provided in Table 3, and liver enzyme trends are illustrated in Figures 2 - 4.
| Variables | Treatment Group | Placebo Group | P-Value | ||||
|---|---|---|---|---|---|---|---|
| Baseline | 12 Weeks | 24 Weeks | Baseline | 12 Weeks | 24 Weeks | ||
| AST | 41.07 ± 20.33 | 30.74 ± 11.89 | 27.10 ± 13.15 | 40.20 ± 17.66 | 41.32 ± 15.60 | 51.10 ± 20.19 | < 0.001 b |
| ALT | 37.63 ± 17.08 | 27.00 ± 10.15 | 24.12 ± 12.66 | 34.98 ± 15.62 | 37.80 ± 12.45 | 44.05 ± 17.10 | < 0.001 b |
| ALP | 347.92 ± 83.21 | 298.80 ± 60.73 | 266.49 ± 64.49 | 349.03 ± 90.95 | 342.58 ± 70.77 | 344.83 ± 67.02 | 0.001 b |
| GGT | 52.83 ± 15.63 | 43.33 ± 12.50 | 40.50 ± 8.40 | 47.60 ± 13.74 | 49.70 ± 11.59 | 52.70 ± 13.25 | 0.412 |
| Total bilirubin | 0.89 ± 0.44 | 0.66 ± 0.27 | 0.41 ± 0.24 | 0.69 ± 0.53 | 0.65 ± 0.35 | 0.75 ± 0.33 | 0.478 |
| Direct bilirubin | 0.42 ± 0.20 | 0.35 ± 0.21 | 0.26 ± 0.26 | 0.60 ± 0.36 | 0.68 ± 0.44 | 0.99 ± 0.67 | 0.001 b |
| Cholesterol | 228.61 ± 81.67 | 191.70 ± 65.27 | 159.10 ± 51.92 | 233.21 ± 75.04 | 213.56 ± 67.11 | 200.14 ± 61.69 | 0.051 |
| Triglyceride | 241.47 ± 82.71 | 197.63 ± 61.85 | 163.63 ± 53.44 | 235.98 ± 79.72 | 223.56 ± 70.86 | 210.10 ± 61.75 | 0.064 |
| HDL | 31.49 ± 6.47 | 34.81 ± 5.36 | 38.76 ± 6.56 | 30.47 ± 8.06 | 29.89 ± 5.32 | 30.58 ± 6.46 | < 0.001 b |
| LDL | 221.81 ± 68.75 | 183.05 ± 52.93 | 152.72 ± 45.60 | 221.72 ± 67.88 | 208.30 ± 58.64 | 198.61 ± 56.18 | 0.020 b |
| Waist circumference | 93.69 ± 14.20 | 91.11 ± 12.70 | 88.42 ± 10.33 | 94.09 ± 13.48 | 93.29 ± 14.04 | 93.42 ± 14.90 | 0.300 |
Abbreviations: AST, aspartate aminotransferase; ALT, alanine aminotransferase.
a Values are expressed as mean ± SD.
b The P-values less than 0.05 were deemed statistically significant.
 levels of treatment and placebo group at baseline, 12 weeks, and 24 weeks. The red line in the graph represents the treatment group and the blue line shows the placebo group.")
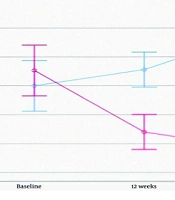
The aspartate aminotransferase (AST) levels of treatment and placebo group at baseline, 12 weeks, and 24 weeks. The red line in the graph represents the treatment group and the blue line shows the placebo group.
 levels of treatment and placebo group at baseline, 12 weeks, and 24 weeks. The red line in the graph represents the treatment group and the blue line shows the placebo group.")
The alanine aminotransferase (ALT) levels of treatment and placebo group at baseline, 12 weeks, and 24 weeks. The red line in the graph represents the treatment group and the blue line shows the placebo group.

The ALP levels of treatment and placebo group at baseline, 12 weeks, and 24 weeks. The red line in the graph represents the treatment group and the blue line shows the placebo group.
Significant correlations were observed in AST and ALT reductions across both age groups (< 50 and ≥ 50 years), with the most notable reductions of 23.4% and 28.7% in AST and ALT, respectively, among patients aged 50 or older (P-values: 0.014, 0.001, 0.017, and < 0.001, respectively). A 22% significant reduction in ALP was also observed in participants aged 50 or older (P = 0.005). Cholesterol and triglyceride levels followed a similar trend to ALP, with P-values of 0.049 and 0.032, respectively.
Based on diabetes mellitus duration, participants were classified into two groups: “< 3 years” and “≥ 3 years.” Significant decreases in AST, ALT, and ALP were observed in the treatment groups of both classifications, with the most prominent change in ALT levels, showing a 35% reduction (P < 0.001 for all). GGT changes were only significant in the “< 3 years” group (P = 0.002 vs. 0.085), while changes in total and direct bilirubin were significant in the “< 3 years” (P = 0.045) and “≥ 3 years” (P < 0.001) groups, respectively. In the lipid profile, significant changes were found only in triglyceride (P = 0.037) and LDL (P = 0.018) levels in patients with a diabetes duration of 3 years or more.
In the female group, AST, ALT, and ALP levels decreased significantly in the treatment group (P < 0.001 for all), with the greatest reduction observed in ALT at 37%. Total and direct bilirubin levels changed significantly in the female treatment group (P < 0.05 for both), while in males, only direct bilirubin showed a significant decrease (P = 0.009). Lipid profile analysis in females showed a significant increase in HDL and a decrease in LDL, whereas in males, only HDL levels increased significantly (P = 0.005).
Data were also analyzed based on BMI: Normal, overweight, and obese. Aspartate aminotransferase (P = 0.002, P = 0.014) and ALT (P = 0.001, P = 0.014) reductions were significant in the normal and overweight groups, while ALP reduction (P < 0.001) was significant only in the normal BMI group. GGT was measured only in the overweight group. Direct bilirubin declined in all BMI categories, but total bilirubin showed a significant change only in the normal BMI group (P = 0.042). Cholesterol, triglyceride, LDL, and HDL levels improved in both the normal and overweight groups (P < 0.05), but no significant changes were observed in obese patients. Waist circumference decreased significantly across all groups (P < 0.05).
5. Discussion
In the present study, empagliflozin significantly decreased AST, ALT, ALP, and direct bilirubin levels. In the lipid profile, this drug significantly decreased LDL and increased HDL levels. Additionally, the grades of fatty liver based on ultrasound findings improved. Several similar studies have been conducted in recent years. Pokharel et al. (26) carried out a study using the same empagliflozin dose and trial duration as ours, enrolling 84 participants, while Taheri et al. (27) applied an identical protocol to 90 non‑T2DM patients. In terms of study design, one study used a higher daily dose (25 mg) of empagliflozin (25), and another employed a shorter 20‑week trial period with the same treatment dose as ours (28). Notably, none of these studies altered the existing T2DM drug regimen.
Our study aligns with a 2018 study using MRI-PDFF, which found that empagliflozin significantly reduced liver fat and ALT but not AST or GGT (28). The lack of significant AST changes in that study, unlike ours, could be attributed to smaller sample sizes or differences in patient selection. In 2021, Pokharel et al. found that six months of 10 mg empagliflozin significantly reduced ALT, AST, and GGT levels, accompanied by weight loss and no major side effects (26).
A 2021 review concluded that SGLT2 inhibitors significantly reduce liver enzymes and fat, while improving body composition, including fat mass distribution (29). In a 2018 study, researchers reported significant reductions in both ALT and AST after empagliflozin administration, with greater changes observed in ALT (30).
We also analyzed empagliflozin’s effects based on age, sex, BMI, and diabetes duration. The drug significantly improved ALT and AST levels across all age groups, in females, regardless of diabetes duration, and in patients with normal or overweight BMI. Lipid profiles improved in older patients, females, those with long-term T2DM, and non-obese individuals. A 2021 review found that SGLT2 inhibitors may slow the progression of NAFLD/NASH (31). A 2018 interventional study concluded that empagliflozin significantly lowered AST and ALT levels compared to a control group at 28 weeks, with more noticeable changes in ALT. Their findings consistently support the potential of empagliflozin to reduce liver fat, consistent with our results (30).
We demonstrated that the reduction in LDL and elevation in HDL levels among participants in the treatment group were statistically significant (P < 0.001 and P = 0.020, respectively); however, the endpoint values did not meet the thresholds recommended by current clinical guidelines. Although significant reductions in total cholesterol and triglyceride levels were also observed, these changes likewise did not reach the recommended criteria for cardiovascular protection (32). It is possible that a longer duration of empagliflozin therapy is needed to further improve lipid profiles and fully realize its cardioprotective benefits.
While empagliflozin reduced waist circumference across all BMI groups, these changes were not statistically significant. The treatment group showed gradual reductions over the three follow-up visits, but without reaching significance. A 2020 study reported a significant reduction in both waist circumference and BMI with 25 mg of empagliflozin over 24 weeks, which differs from our findings. However, its reported improvements in steatosis and liver fat align with our results, suggesting a need for further validation (25).
This study has several limitations. Of the initial 210 patients assessed, only 110 completed the trial. A total of 47 patients did not meet the inclusion criteria, 18 declined consent, and 5 withdrew during the study. These factors may introduce selection bias and limit the generalizability of the findings. Liver fat content was evaluated using ultrasound rather than more precise modalities such as MRI-PDFF or liver biopsy. Additionally, markers of insulin resistance were not assessed, and the six-month follow-up period limits the ability to draw conclusions regarding long-term outcomes. Concomitant medication use was not fully controlled, and adverse effects—such as urinary tract infections or changes in blood pressure—were not systematically recorded. Furthermore, subgroup analysis for comorbidities was incomplete, underscoring the need for more comprehensive future research.
5.1. Conclusions
According to our study, empagliflozin effectively lowers AST and ALT levels, decreases LDL, and increases HDL levels. It also improves fatty liver grading, making it a promising therapeutic option for patients with T2DM diagnosed with NASH.
