


1. Background
Hepatocellular carcinoma (HCC) is a primary intrahepatic malignant tumor with a high incidence and mortality rate (1). Nearly 50% of HCC cases worldwide occur in China, seriously affecting public health (2). Despite improvements in pre-treatment evaluation, treatment strategies, and post-treatment management of HCC — such as surgical resection, interventional embolization, and radiofrequency ablation (RFA) — the recurrence rate remains high, and the prognosis is still suboptimal (3).
Currently, there are several interventional treatment methods available, among which transcatheter arterial chemoembolization (TACE) is commonly used (4). However, due to factors such as incomplete occlusion of blood supply vessels and collateral vessel formation after surgery (5), TACE alone cannot completely eliminate all tumor cells, necessitating supplementary treatments such as RFA (6, 7).
Following interventional surgery, local necrosis, bleeding, and secondary inflammatory reactions create complex structures in the lesion area, making it difficult to accurately determine tumor viability or recurrence (8, 9). Accurately identifying residual or recurrent tumors after interventional therapy plays a crucial role in evaluating the effectiveness of treatment and in guiding subsequent therapeutic decisions.
Many conventional imaging examination methods have been used to improve the diagnostic and differential diagnostic value for liver cancer, such as ultrasound-guided biopsy and computed tomography (CT) (10). However, neither of these methods provides useful imaging biomarkers for evaluating the prognosis of patients with HCC (11).
Magnetic resonance imaging (MRI) is currently the most effective non-invasive technology for detecting and evaluating HCC, including techniques such as intravoxel incoherent motion imaging (IVIM), diffusion tensor imaging (DTI), diffusion kurtosis imaging (DKI), dynamic contrast-enhanced MRI (DCE-MRI), amide proton transfer imaging (APTI), and blood oxygen level-dependent imaging (BOLD) (12).
Multimodal MRI refers to the combination of conventional MRI scanning sequences with advanced functional MRI techniques, achieving complementary imaging effects and providing more detailed information for disease diagnosis (13). The application of multimodal MRI in the diagnosis of abdominal diseases has received increasing attention (14, 15). Multimodal MRI emphasizes integration, based on factors such as sequence stability and the irreplaceability of specific sequences (16). Therefore, the combined application of multimodal MRI may lead to improved diagnostic outcomes for various diseases.
This study compared the imaging patterns of single nodular primary HCC across three different stages — from follow-up to recurrence — after interventional surgery, using multimodal MRI sequence imaging. The aim was to identify early signal changes, morphological features, and to evaluate the diagnostic efficacy of multimodal MRI sequences for detecting tumor recurrence.
2. Methods
2.1. Population
A retrospective analysis was conducted on cases of single nodular HCC confirmed by biopsy pathology or clinical diagnosis at our hospital between September 2009 and September 2014. This study was approved by the Ethics Committee of our hospital, and informed consent forms were signed by 149 patients who experienced recurrence after undergoing systematic TACE and RFA combined treatment.
Among these, 44 cases were excluded, and a total of 105 cases with 105 lesions were included in the final analysis. The included cohort consisted of 87 males and 18 females, aged 46 - 83 years, with a median age of 63 years.
2.1.1. Inclusion criteria
No allergy to contrast agents, lesions were not surgically resected, regular follow-up intervals of 3 - 4 months were maintained until tumor recurrence at the target lesion.
2.1.2. Exclusion Criteria
History of upper gastrointestinal bleeding or severe coagulation dysfunction, presence of severe underlying diseases, including significant impairment of heart, liver, or kidney function, irregular follow-up intervals (i.e., not maintained at 3 - 4 months), receipt of other treatments before or after the combined interventional therapy.
2.2. Magnetic Resonance Imaging Technique
A GE 1.5T magnetic resonance scanner (GE Medical Systems, Signa EXCITE HD) was used, equipped with a body coil for RF transmission and an 8-channel phased array coil for signal reception. During scanning, patients were positioned supine with feet first, and additional respiratory gating (compensation) was applied to the abdomen. The conventional sequence scanning parameters were as follows: Transverse T1-weighted imaging (T1WI): TR/TE = 400/8 ms, slice thickness = 6.0 mm, slice spacing = 1.0 mm, FOV = 32 × 32 cm, matrix = 320 × 192, NEX = 2.0; transverse T2-weighted imaging (T2WI) with fat suppression: TR/TE = 4000/125 ms, slice thickness = 6.0 mm, slice spacing = 1.0 mm, FOV = 32 × 32 cm, matrix = 320 × 192, NEX = 4.0. Diffusion-weighted imaging (DWI) was performed using the SE-EPI sequence, with parameters TR/TE = 4000/70 ms and b-value = 600 s/mm2. For DWI, a b-value of 600 s/mm2 was selected to balance sensitivity for detecting small recurrent HCC foci while maintaining image quality. Liver acquisition with volume acceleration (LAVA) sequence parameters were: TR/TE = 3.9/1.9 ms, inversion time (TI) = 7.0 ms, FOV = 39 × 39 cm, matrix = 272 × 192. Contrast administration: The contrast agent gadolinium diethylenetriamine pentaacetic acid (Gd-DTPA) was injected intravenously through the elbow vein at a dosage of 0.1 mmol/kg body weight, with an injection rate of 2.5 mL/s. Dynamic contrast-enhanced scanning was performed at multiple time points post-injection (16 s, 32 s, 48 s, 64 s), and delayed imaging was performed at 300 s.
In the DWI sequence, a b-value of 600 s/mm2 was selected to provide sufficient sensitivity for detecting small recurrent foci of HCC while maintaining acceptable image quality. In the LAVA sequence, a TR of 3.9 ms and a TE of 1.9 ms were used to enable rapid acquisition of high-quality liver images, which is essential for dynamic contrast-enhanced scanning and evaluation of tumor blood supply. A TI of 7.0 ms was chosen to effectively suppress the background fat signal, thereby improving tumor visualization and contrast. A smaller field of view (FOV) of 39 × 39 cm was selected to specifically focus on the liver area, enhancing resolution and image detail. This approach allows for more accurate assessment of tumor size, shape, and boundaries. The matrix size of 272 × 192 was selected to reduce acquisition time and data storage requirements while ensuring adequate image quality.
2.3. Analysis and Measurement of Magnetic Resonance Imaging Images
The MRI images were analyzed and measured by two physicians with experience in MRI diagnosis. The kappa statistic was used to assess the consistency of diagnostic results between the two physicians. In cases where the imaging diagnoses were inconsistent, additional participants with more than two years of diagnostic experience were invited to conduct a joint analysis in order to reach a consensus.
2.4. Staging from Tumor Intervention to Recurrence
Tumor recurrence group: Patients demonstrated typical HCC imaging features without other causes of elevated alpha-fetoprotein (AFP), such as pregnancy, germline embryogenic tumors, or active hepatitis after interventional surgery. The AFP levels increased again by ≥ 400 µg/L for 1 month or ≥ 200 µg/L for 2 months. Suspicious group: (1) Interventional lesion size: According to the modified response evaluation criteria in solid tumors (mRECIST) for tumor recurrence after combined interventional surgery, lesions did not meet the criteria for partial remission (PR) or progressive disease (Pd); (2) after intervention, AFP levels slightly increased again or showed no significant change compared to the postoperative group; (3) slight changes were observed in certain sequence signals during each sequence scan. Postoperative group: (1) Interventional lesion size: Lesions met the mRECIST standard for stability (stable disease, SD) following combined interventional surgery; (2) no significant changes were observed in AFP levels during follow-up after intervention; (3) the imaging signals remained stable across all sequence scans.
2.5. Magnetic Resonance Imaging Sign Analysis
Signal changes were classified into four types: High signal, equal signal, low signal, and mixed signal. Morphological features were categorized as follows: (1) Nodular shadow: Solitary nodular abnormal signal shadows observed in the lesion area; (2) semilunar shadow: Localized thickened shadow in the lesion area with obvious enhancement or high signal intensity on DWI; (3) other non-abnormal appearances: Including annular and sheet-like shapes.
2.6. Statistical Analysis
Statistical analysis was performed using SPSS version 17.0. The chi-square test was used to compare individual sequence signal and morphological changes among the three groups. The numbering of signals and shapes was based on the percentage composition of each signal and shape type in the recurrence group. Comparison between the recurrence group and the postoperative group was conducted using receiver operating characteristic (ROC) curves to determine the diagnostic thresholds for each sequence. The numbering of morphological forms was based on the percentage composition of each form in the suspicious group. Logistic regression analysis was used to calculate diagnostic values for the T1WI, T2WI, LAVA, and DWI sequences individually, in pairwise combinations, in three-sequence combinations, and in four-sequence combinations, in order to identify the sequence combinations with the highest Youden's Index (Youden’s Index = sensitivity + specificity - 1).
3. Results
3.1. Comparison of Lesion Signal on T1-Weighted Imaging, T2-Weighted Imaging, Liver Acquisition with Volume Acceleration, and Diffusion-Weighted Imaging Sequences in Different Groups
The signal comparisons of each sequence of lesions among the recurrence, suspicious, and postoperative groups are shown in Table 1. Statistical analysis revealed that differences in the signal characteristics of the intervention lesion areas among the three groups were statistically significant (P < 0.05).
| Groups | T1WI Signal | T2WI Signal | DWI Signal | LAVA Strengthen | |||||||||||
|---|---|---|---|---|---|---|---|---|---|---|---|---|---|---|---|
| Higher | Wait | Low | Mix | Higher | Wait | Low | Mix | Higher | Wait | Low | Mix | Significant Enhancement | Mild Enhancement | No Enhancement | |
| Recurrence (n = 105) | 0.0 | 3.3 | 85.81 | 17.16 | 90.86 | 0.0 | 0.0 | 15.14 | 97.92 | 0.0 | 0.0 | 8.8 | 89.85 | 16.15 | 0.0 |
| Suspicious (n = 105) | 18.17 | 11.11 | 33.31 | 43.41 | 35.33 | 21.20 | 27.26 | 22.21 | 57.54 | 10.1 | 24.23 | 14.13 | 23.22 | 13.12 | 69.66 |
| Postoperative (n = 105) | 47.45 | 18.17 | 16.15 | 24.23 | 3.3 | 29.28 | 60.57 | 13.12 | 4.4 | 28.27 | 59.56 | 14.13 | 0.0 | 20.19 | 85.81 |
| χ2 /P (three group) | 50.138/0.000 | 39.107/0.000 | 40.895/0.000 | 40.50/0.000 | |||||||||||
| χ2 /P (recurrence group vs. postoperative group) | 41.695/0.000 | 45.405/0.000 | 48.563/0.001 | 42.001/0.000 | |||||||||||
| χ2 /P (recurrence group vs. suspicious group) | 40.701/0.000 | 41.002/0.000 | 45.117/0.004 | 50.067/0.012 | |||||||||||
| χ2 /P (recurrence group vs. suspicious group) | 40.500/0.000 | 40.211/0.000 | 42.885/0.001 | 47.883/0.000 | |||||||||||
Abbreviations: T1WI, T1-weighted imaging; T2WI, T2-weighted imaging; DWI, diffusion-weighted imaging; LAVA, liver acquisition with volume acceleration.
a Values are expressed as percent.
3.2. Operating Characteristic Curve Analysis of the Diagnostic Value of T1-Weighted Imaging, T2-Weighted Imaging, Liver Acquisition with Volume Acceleration, and Diffusion-Weighted Imaging in the Recurrence Group-Postoperative Group
The recurrence group and the postoperative group were sequentially scored and numbered based on the percentage of signal types in each sequence within the recurrence and postoperative groups. Additionally, the recurrence group and postoperative group were sequentially numbered based on the percentage of LAVA enhancement observed in the recurrence group. The ROC curve results for the diagnostic performance of T1WI, T2WI, LAVA, and DWI sequences in distinguishing between the recurrence group and the postoperative group are presented in Table 2.
| Signals | AUC (%) | Rating Threshold | Strengthen Signal (%) | Specificity (%) |
|---|---|---|---|---|
| T1WI signal | 75.9 | 2.5 | 95.2 | 61 |
| T2WI signal | 96.3 | 1.5 | 96 | 82.9 |
| DWI signal | 96.8 | 2.5 | 93.4 | 95.2 |
| LAVA strengthen signal | 95.8 | 2.5 | 84.8 | 94.1 |
Abbreviations: T1WI, T1-weighted imaging; T2WI, T2-weighted imaging; DWI, diffusion-weighted imaging; LAVA, liver acquisition with volume acceleration; AUC, area under the curve.
3.3. Comparison of T1-Weighted Imaging, T2-Weighted Imaging, Diffusion-Weighted Imaging and Liver Acquisition with Volume Acceleration Signal Rates Diagnostic Criteria
After determining the signal scoring threshold for diagnosing the recurrence group based on the results in Table 2, the suspicious group and postoperative group were subjected to binary classification based on the recurrence group signal characteristics. The chi-square test was applied to assess the diagnostic criteria based on signal scoring, and the differences were found to be statistically significant (P < 0.05), as shown in Table 3.
| Variables | T1WI | T2WI | DWI | LAVA | ||||
|---|---|---|---|---|---|---|---|---|
| 1 | 0 | 1 | 0 | 1 | 0 | 1 | 0 | |
| Suspicious | 73 | 32 | 59 | 46 | 72 | 33 | 22 | 83 |
| Postoperative | 40 | 65 | 18 | 87 | 5 | 100 | 2 | 103 |
| χ2 | 67.925 | 66.303 | 59.733 | 93.333 | ||||
| P-value | 0.012 | 0.000 | 0.000 | 0.000 | ||||
Abbreviations: T1WI, T1-weighted imaging; T2WI, T2-weighted imaging; DWI, diffusion-weighted imaging; LAVA, liver acquisition with volume acceleration.
3.4. Comparison of Lesion Morphology on T1-Weighted Imaging, T2-Weighted Imaging, Liver Acquisition with Volume Acceleration, and Diffusion-Weighted Imaging Sequences in Different Groups
The comparative results of T1WI, T2WI, LAVA, and DWI lesion morphology among the recurrence, suspicious, and postoperative groups are shown in Table 4. The differences in lesion morphology across the three stages of the recurrence area following intervention were statistically significant (P < 0.05).
| Groups | T1WI Lesion Morphology | T2WI Lesion Morphology | DWI Lesion Morphology | LAVA Lesion Morphology | ||||||||
|---|---|---|---|---|---|---|---|---|---|---|---|---|
| Nodular | Semilunar | No Displayed | Nodular | Semilunar | No Displayed | Nodular | Semilunar | No Displayed | Nodular | Semilunar | No Displayed | |
| Recurrence | 69.66 | 36.34 | 0.0 | 68.65 | 37.35 | 0.0 | 71.68 | 34.32 | 0.0 | 67.64 | 38.36 | 0.0 |
| Suspicious | 11.10 | 20.18 | 74.72 | 14.13 | 22.20 | 69.67 | 71.68 | 34.32 | 0.0 | 67.64 | 38.36 | 81.77 |
| Postoperative | 0.0 | 0.0 | 105.100 | 0.0 | 2.2 | 103.98 | 0.0 | 2.2 | 103.98 | 0.0 | 0.0 | 105.100 |
| χ2/P-value (three groups) | 22.720/0.002 | 9.058/0.000 | 21.379/0.000 | 27.891/0.000 | ||||||||
| χ2/P-value (recurrence group vs. postoperative group) | 13.319/0.000 | 24.897/0.000 | 14.418/0.000 | 20.398/0.000 | ||||||||
| χ2/P-value (recurrence group vs. suspicious group) | 10.149/0.001 | 7.462/0.001 | 13.877/0.000 | 21.045/0.002 | ||||||||
| χ2/P-value (recurrence group vs. suspicious group) | 24.814/0.000 | 20.870/0.000 | 17.894/0.001 | 19.565/0.000 | ||||||||
Abbreviations: T1WI, T1-weighted imaging; T2WI, T2-weighted imaging; DWI, diffusion-weighted imaging; LAVA, liver acquisition with volume acceleration.
a Values are expressed as percent.
3.5. Combination of T1-Weighted Imaging, T2-Weighted Imaging, Diffusion-Weighted Imaging, and Liver Acquisition with Volume Acceleration Had High Diagnostic Sensitivity and Specificity
Based on Table 4, and according to the percentage distribution of nodular, semilunar, and other non-abnormal (circular, patchy) signals in the T1WI, T2WI, DWI, and LAVA sequences within the suspicious group, the semilunar, nodular, and non-abnormal signals were sequentially assigned scores of 3, 2, and 1, respectively. These signal and morphological score values were then incorporated into the logistic regression analysis to evaluate the diagnostic efficacy for the suspicious group, as presented in Table 5.
| Suspicious Group (N = 105) | Sensitivity (%) | Specificity (%) | Diagnostic Accuracy |
|---|---|---|---|
| T1WI | 78.1 | 61.9 | 70 |
| T2WI | 69.5 | 81 | 75.2 |
| DWI | 76.2 | 93.3 | 84.8 |
| LAVA | 59 | 98.1 | 68.6 |
| T1WI + T2WI | 70.5 | 88.6 | 79.5 |
| T1WI + DWI | 83.8 | 93.3 | 88.6 |
| T1WI + LAVA | 59 | 98.1 | 78.6 |
| T2WI + DWI | 83.8 | 93.3 | 88.6 |
| T2WI + LAVA | 77.1 | 80 | 78.6 |
| DWI + LAVA | 79 | 93.3 | 86.2 |
| T1WI + T2WI + DWI | 90.5 | 93.3 | 91.9 |
| T1WI + DWI + LAVA | 81.7 | 92.3 | 89.5 |
| T2WI + DWI + LAVA | 85.7 | 93.3 | 89.5 |
| T1WI + T2WI + DWI + LAVA | 85.7 | 93.3 | 89.5 |
Abbreviations: T1WI, T1-weighted imaging; T2WI, T2-weighted imaging; DWI, diffusion-weighted imaging; LAVA, liver acquisition with volume acceleration.
The results showed that the combination of T1WI, T2WI, DWI, and LAVA sequences achieved the highest diagnostic sensitivity and specificity.
4. Discussion
This study analyzed the signal and morphological changes — particularly focusing on the suspicious group — across three stages after TACE combined with RFA treatment, providing earlier clinical data for practice. The results suggest that the combination of multiple MRI sequences can improve the diagnostic efficiency of tumor recurrence after interventional surgery for HCC. Primary HCC is characterized by a high degree of malignancy and rapid progression, resulting in a surgical resection rate of only 9.0% to 13.5% for most cases (17). Although interventional therapy offers advantages such as minimal trauma and shorter treatment time, evaluating and monitoring the efficacy of lesions after HCC intervention remains a major clinical challenge. One year of follow-up after TACE treatment revealed that treatment efficacy gradually decreases over time (18), and repeated TACE procedures can cause liver function impairment, which further affects treatment outcomes (19). Therefore, TACE is often combined with other local treatments, such as RFA, to improve patient outcomes and quality of life. The RFA works by destroying tumor tissue through heating at temperatures exceeding 60°C (20). Consequently, the combination of TACE and RFA has been shown to effectively reduce tumor recurrence and improve both overall survival and tumor-free survival rates (21). Scholars have found that the combination therapy of TACE and RFA is significantly more effective than TACE or RFA alone, particularly for HCC lesions with a diameter greater than 3 cm (22). Within 48 hours after HCC intervention, due to factors such as bleeding and protein concentration, the T1WI of the lesion often exhibits high signal intensity centrally and low signal intensity in the surrounding crescent-shaped area. Meanwhile, T2WI typically shows low signal intensity, with possible mixed signals and peripheral low signal intensity, and the crescent-shaped area demonstrates enhancement after contrast administration (23). These imaging changes are associated with liver tissue congestion secondary to heat injury. At one month post-operation, reexamination of the upper abdomen revealed that the volume of the intervention focus, observed on multiphase enhanced MRI, had slightly reduced. The surrounding semilunar shadow became pale or disappeared, and arterial phase enhancement was not obvious, indicating that ablation of the intervention focus was relatively complete. Semilunar enhancement becomes rare after six months and, when present, often appears during the venous and delayed phases (23).
Some scholars have found that not all early enhancement indicates tumor survival or recurrence. It is important to recognize that postoperative inflammatory changes and abnormal perfusion can also lead to early enhancement (24). The fibrous capsule typically appears as low signal intensity on both T1WI and T2WI; however, distinguishing it from early-stage recurrence remains difficult (24). Additionally, studies have shown that DWI can be affected by artifacts, which may result in abnormally high signals, leading to certain false-positive and false-negative findings when lesions are assessed using a single sequence alone (25). Reports have indicated that the combined use of multiple MRI sequences provides higher accuracy in evaluating the efficacy of liver cancer interventions compared to the use of individual sequences such as T1WI, T2WI, dynamic contrast enhancement, or DWI alone. These findings support that the combination of multimodal MRI can significantly improve diagnostic efficiency (26).
In this study, the intervention lesions in the postoperative group exhibited equal and high signal intensity on the T1WI sequence and low signal intensity on the T2WI sequence, which may be attributed to varying degrees of coagulation necrosis of tumor tissue after combined interventional therapy. The low signal intensity observed on DWI may be related to ischemia and hypoxia of the target tumor cells caused by lipiodol deposition and chemotherapy drugs following interventional treatment. This process leads to tumor necrosis and apoptosis, increased permeability and rupture of cell membranes, expansion of the extracellular space, and increased free diffusion of water molecules. LAVA dynamic contrast-enhanced scanning can accurately determine the non-blood supply phase of the tumor, and lesions in the postoperative group typically showed no enhancement. However, over time, a series of pathological changes can occur following TACE combined with RFA, including bleeding, steatosis, liquefaction necrosis, and other alterations, which can easily be confused with early tumor recurrence. Therefore, the suspicious group observed during follow-up requires the most careful attention. Detecting abnormalities in this period can significantly improve patient survival rates. This study thus focuses on providing earlier clinical data based on the imaging characteristics of the suspicious group in the recurrence areas of the intervention lesions.
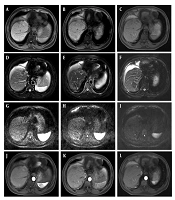
Most of the intervention lesions (suspicious group) in this study exhibited high and mixed signals on T1WI, while slightly high signals with multiple edges were observed on T2WI. Early recurrent lesions were often very subtle and could manifest only as slight signal changes at the edge of the lesion. Therefore, careful evaluation of lesion margins after interventional surgery serves as an important reference indicator for recurrence. This study found that dynamic enhancement on LAVA sequences in the suspicious group showed marginal or nodular enhancement of the lesion, along with the presence of small abnormal blood vessels (Figure 1), which should raise concern for viable tumor cells. DWI was also sensitive to residual and recurrent lesions, presenting as slightly higher mixed signal shadows (Figure 2).
 images of the HCC patient. Follow-up was conducted three months after transcatheter arterial chemoembolization (TACE) + radiofrequency ablation (RFA) surgery, and recurrence of the interventional lesion was found after 10 months of follow-up. A - C, T1-weighted imaging (T1WI) phase III (recurrence, suspicious, and postoperative groups); D - F, phase III T2-weighted imaging (T2WI) images; G - I, diffusion-weighted imaging (DWI) phase III images; J - L, LAVE enhanced arterial phase three phase images. When dynamic enhancement of liver acquisition with volume acceleration (LAVA) in the suspicious group showed marginal or nodular enhancement of the lesion, and small abnormal blood vessels were found, attention should be paid to the presence of viable tumor cells.")
Representative magnetic resonance imaging (MRI) images of the HCC patient. Follow-up was conducted three months after transcatheter arterial chemoembolization (TACE) + radiofrequency ablation (RFA) surgery, and recurrence of the interventional lesion was found after 10 months of follow-up. A - C, T1-weighted imaging (T1WI) phase III (recurrence, suspicious, and postoperative groups); D - F, phase III T2-weighted imaging (T2WI) images; G - I, diffusion-weighted imaging (DWI) phase III images; J - L, LAVE enhanced arterial phase three phase images. When dynamic enhancement of liver acquisition with volume acceleration (LAVA) in the suspicious group showed marginal or nodular enhancement of the lesion, and small abnormal blood vessels were found, attention should be paid to the presence of viable tumor cells.
 + radiofrequency ablation (RFA) observation was performed 2 months after surgery. After 12 months of follow-up, recurrence of the intervention lesion was found. A - C, phase III T1-weighted imaging (T1WI) (recurrence, suspicious, and postoperative groups); D - F, phase III T2-weighted imaging (T2WI) images; G - I, diffusion-weighted imaging (DWI) phase III images; J - L, LAVE enhanced arterial phase three phase images. DWI was sensitive to residual and recurrent lesions, so it presented slightly higher mixed signal shadows.")
Transcatheter arterial chemoembolization (TACE) + radiofrequency ablation (RFA) observation was performed 2 months after surgery. After 12 months of follow-up, recurrence of the intervention lesion was found. A - C, phase III T1-weighted imaging (T1WI) (recurrence, suspicious, and postoperative groups); D - F, phase III T2-weighted imaging (T2WI) images; G - I, diffusion-weighted imaging (DWI) phase III images; J - L, LAVE enhanced arterial phase three phase images. DWI was sensitive to residual and recurrent lesions, so it presented slightly higher mixed signal shadows.
Given that HCC is typically a hypervascular malignant tumor, previous literature has reported that LAVA dynamic enhancement sequences can effectively detect changes in tumors following interventional surgery. In addition, after TACE combined with RFA, lesions generally tend to shrink over time; thus, any increase in lesion size during follow-up is highly suggestive of local recurrence (Figure 3).
, a recurrence of the lesion was detected and radiofrequency ablation (RFA) surgery was added. One month after surgery, the patient was enrolled for follow-up, and a recurrence of the interventional lesion was found after 15 months of follow-up. A - C, phase III T1-weighted imaging (T1WI) (recurrence, suspicious, and postoperative groups); D - F, phase III T2-weighted imaging (T2WI) images; G - I, diffusion-weighted imaging (DWI) phase III images; J - L, LAVE enhanced arterial phase three phase images. After TACE combined with RFA surgery, the lesion would shrink over time, and if the lesion increased during follow-up, there was also a high suspicion of local recurrence.")
Five months after transcatheter arterial chemoembolization (TACE), a recurrence of the lesion was detected and radiofrequency ablation (RFA) surgery was added. One month after surgery, the patient was enrolled for follow-up, and a recurrence of the interventional lesion was found after 15 months of follow-up. A - C, phase III T1-weighted imaging (T1WI) (recurrence, suspicious, and postoperative groups); D - F, phase III T2-weighted imaging (T2WI) images; G - I, diffusion-weighted imaging (DWI) phase III images; J - L, LAVE enhanced arterial phase three phase images. After TACE combined with RFA surgery, the lesion would shrink over time, and if the lesion increased during follow-up, there was also a high suspicion of local recurrence.
When tumor recurrence is suspected, additional interventional treatment or alternative therapies should be considered. However, it is important to note that residual lesions, fibrous capsules, and intratumoral fibrous septa can also exhibit enhancement during the portal and delayed phases, which can sometimes mimic recurrence. Our analysis showed that the sensitivity and specificity of the combined diagnosis using T1WI, T2WI, DWI, and LAVA sequences were 85.7% and 94.3%, respectively, indicating that their combination provides valuable diagnostic utility for detecting postoperative recurrence of HCC.
Firstly, this study highlights the potential of multimodal MRI in improving the accuracy of diagnosing recurrent liver cancer after interventional therapy. This advancement can assist clinicians in identifying recurrent tumors earlier and more precisely, thereby enabling more timely and effective treatment measures. Secondly, accurate diagnostic information is critical for formulating and optimizing treatment strategies. Timely detection and management of recurrent tumors can extend patients’ survival and significantly enhance their quality of life. The findings of this study also suggest that the application of multimodal MRI will promote the further development of advanced imaging technologies, offering expanded possibilities for the diagnosis and treatment of liver cancer. Future research should explore the optimal combination of different MRI sequences to further enhance diagnostic efficacy and conduct long-term follow-up studies to assess the predictive value of multimodal MRI in patients' long-term prognosis.
4.1. Conclusions
In summary, this study applied multimodal MRI to the diagnosis of suspicious recurrence areas after HCC interventional surgery and demonstrated that the combination of multiple MRI sequences can improve the diagnostic efficiency for detecting tumor recurrence following HCC intervention.
