

Dear Editor,
Non-alcoholic fatty liver disease (NAFLD) is a clinical-pathological syndrome closely associated with factors such as insulin resistance, metabolism, and genetics. With the rising prevalence of metabolic-related diseases, such as diabetes and obesity, the number of NAFLD patients in China is expected to increase in the coming years (1). Non-alcoholic steatohepatitis (NASH) represents the progressive stage of NAFLD and carries a higher risk of extrahepatic malignancies, particularly gastrointestinal cancers (2). However, there is currently no clear report on the relationship between NASH and gastric cancer (GC). Therefore, it is necessary to explore the biological markers of NASH and GC to aid in diagnosis and treatment.
To screen for genes related to NASH and GC, datasets from the gene expression omnibus (GEO) database were analyzed. The datasets GSE54129, GSE118916, GSE48452, and GSE63067 were downloaded and included in this study. The gene chip GSE54129 contains 111 GC samples and 21 normal gastric tissue samples, while GSE118916 includes 15 GC samples and 15 normal gastric tissue samples. GSE48452 consists of 18 NASH samples and 14 normal liver tissue samples, and GSE63067 includes 9 NASH samples and 7 normal liver tissue samples.
The GEO2R online analysis tool was used to analyze the datasets (P < 0.05, |logFC| > 1, t-test). Differentially expressed genes (DEGs) were visualized for display. Using the (Venny) online platform, the intersection of DEGs related to NASH and GC was identified, and a Venn diagram was generated to determine the associated genes of the two diseases. The volcano plot of DEGs is shown in Figure 1A, and the Venn diagram illustrating the intersection is shown in Figure 1B.
 gene chips revealed that GC's gene chip GSE54129 had 1856 upregulated genes and 2087 downregulated genes. In the gene chip GSE118916 of GC 974 genes were upregulated and 873 genes were downregulated. NASH's gene chip GSE48452 upregulated 25 genes and downregulated 10 genes. The non-alcoholic steatohepatitis's gene chip GSE63067, 120 genes were upregulated and 19 genes were downregulated; B, venn Plot: PEG10 gene and IGFBP2 gene are jointly involved in the disease process of GC and NASH. Among them, the PEG10 gene is highly expressed in NASH and GC tissues relative to the control tissue, while the IGFBP2 gene is low expressed in NASH and GC tissues relative to the control tissue; C, expression differences of PEG10 gene and IGFBP2 gene in NASH and GC compared to normal tissue of the control group; D, in the protein interaction network formed by a single gene, there are 10 proteins that interact with PEG10, namely PLAGL1, GRB10, MEST, SGCE, RTL8B, RTL8C, RTL8A, LDOC1, CEP290, PEG3; there are 10 proteins that interact with IGFBP2, namely IGF1R, IGF2, IGFBP3, IGF1, INS, CYFIP1, NIPA1, NIPA2, TUBGCP5, and MIIP; E, correlation between ZNF143, SMARCA4, BRD4, MBD3 and differentially expressed genes (DEGs).")
A, Volcano diagram: Differential gene screening of GC and non-alcoholic steatohepatitis (NASH) gene chips revealed that GC's gene chip GSE54129 had 1856 upregulated genes and 2087 downregulated genes. In the gene chip GSE118916 of GC 974 genes were upregulated and 873 genes were downregulated. NASH's gene chip GSE48452 upregulated 25 genes and downregulated 10 genes. The non-alcoholic steatohepatitis's gene chip GSE63067, 120 genes were upregulated and 19 genes were downregulated; B, venn Plot: PEG10 gene and IGFBP2 gene are jointly involved in the disease process of GC and NASH. Among them, the PEG10 gene is highly expressed in NASH and GC tissues relative to the control tissue, while the IGFBP2 gene is low expressed in NASH and GC tissues relative to the control tissue; C, expression differences of PEG10 gene and IGFBP2 gene in NASH and GC compared to normal tissue of the control group; D, in the protein interaction network formed by a single gene, there are 10 proteins that interact with PEG10, namely PLAGL1, GRB10, MEST, SGCE, RTL8B, RTL8C, RTL8A, LDOC1, CEP290, PEG3; there are 10 proteins that interact with IGFBP2, namely IGF1R, IGF2, IGFBP3, IGF1, INS, CYFIP1, NIPA1, NIPA2, TUBGCP5, and MIIP; E, correlation between ZNF143, SMARCA4, BRD4, MBD3 and differentially expressed genes (DEGs).
Our study identified the PEG10 and IGFBP2 genes as jointly involved in the disease processes of GC and NASH. Specifically, the PEG10 gene is highly expressed in both NASH and GC tissues compared to control tissues, while the IGFBP2 gene is downregulated in NASH and GC tissues relative to control tissues (Figure 1C).
The DEGs between NASH and GC were input into the (STRING) database with a minimum interaction score set at 0.4 to construct a single-gene protein-protein interaction (PPI) network. The top ten genes with the highest scores were selected as hub genes. The data were then imported into Cytoscape 3.8.0 software, and the MCODE plugin was used for visual analysis and display.
In the PPI network, PEG10 interacts with ten proteins: PLAGL1, GRB10, MEST, SGCE, RTL8B, RTL8C, RTL8A, LDOC1, CEP290, and PEG3. Similarly, IGFBP2 interacts with ten proteins: IGF1R, IGF2, IGFBP3, IGF1, INS, CYFIP1, NIPA1, NIPA2, TUBGCP5, and MIIP. The analysis results are displayed in Figure 1D, where darker colors indicate stronger correlations. Notably, GRB10, PEG3, PLAGL1, MEST, and SGCE show strong correlations with PEG10, while IGFBP3, IGF2, IGF1R, IGF1, and INS are strongly correlated with IGFBP2.
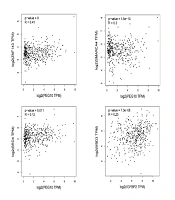
Utilizing the (NCBI) database, the promoter sequences of the PEG10 and IGFBP2 genes were retrieved. A 2000 bp region upstream of the transcription start site was selected for inclusion in this study. The (HumanTFBD) database was used to identify the top five transcription factors with the highest scores and predict their interactions. The (GEPIA2) database was used to verify and explore the correlation between genes. The PEG10 promoter is located on chromosome 7: 94656325 – 94669695. The transcription factors MYC, ZNF143, SMARCA4, NOTCH1, and BRD4 were identified as having the highest scores, indicating a correlation with PEG10 gene expression. The IGFBP2 promoter is located on chromosome 2: 216632828 – 216664436. The transcription factors ESR1, FOXO3, CREB1, BRD4, and MBD3 were identified as having the highest scores, indicating a correlation with IGFBP2 gene expression. Validation using the GEPIA2 database revealed that the expression of ZNF143, SMARCA4, BRD4, and PEG10 was positively correlated, and the expression of MBD3 and IGFBP2 was positively correlated (Figure 1E).
The discovery of NASH during routine health examinations is gradually increasing, with gastrointestinal tumors becoming one of its main complications. Previous studies have discussed the impact of NASH-related gene expression on disease progression, but few have utilized bioinformatics methods to comprehensively analyze the gene expression profiles and biological markers of both diseases. The relationship and specific mechanisms between the two diseases are not yet fully understood, but there is a significant correlation in gene expression that should be widely recognized. In this study, gene expression data from both diseases were analyzed, and the interrelationships and molecular mechanisms between genes were elucidated using bioinformatics methods, providing possibilities for early diagnosis.
Among the DEGs identified in this study, the PEG10 gene was upregulated in both diseases. The PEG10 gene is involved in the genesis and regulation of various tumors. Previous research has shown its importance in breast cancer (3), prostate cancer (4), and other malignancies. Wang et al. (5) demonstrated that knocking out long non-coding RNA related to PEG10 can upregulate miRNA-3200 in vitro and in vivo, exerting an anti-tumor effect in GC by blocking the JNK and Wnt pathways. Ishii et al. (6) found that PEG10, as a high lymph node ratio gene, can inhibit TGF-β signaling by interacting with ALK1, stimulate cell proliferation, or participate in positive feedback regulation of the c-Myc gene, making it a potential target for GC diagnosis and treatment. Arendt et al. (7) studied the severity of NASH and cancer-related gene expression, finding that PEG10 expression is positively correlated with insulin resistance and disease severity. Du et al. (8), through bioinformatics analysis of NAFLD, suggested that PEG10 may be involved in NAFLD pathogenesis and serve as a biomarker for the disease.
The IGFBP2 gene was found to be downregulated in both NASH and GC. Previous studies using qRT-PCR experiments (9) showed that IGFBP2 and IGFBP6 proteins from the IGFBP gene family are underexpressed in GC tissues and may serve as markers for diagnosis, treatment, and prognosis. Stanley et al. (10) reported that as liver steatosis worsens, IGFBP2 and IGFBP4 expression decreases, while IGFBP6 and IGFBP7 expression increases. The PEG10 gene encodes gag-like proteins (RF1/RF2) that interact with mRNA, mediating apoptosis and cell differentiation. When overexpressed, PEG10 can negatively affect cell viability by regulating proliferation and apoptosis (11). Therefore, targeting PEG10 overexpression in NASH and GC patients could represent a potential therapeutic strategy.
PLAGL1 encodes a zinc finger protein that regulates apoptosis during the G1 phase, and its hypermethylation is significantly associated with the development of GC. Hypermethylation is present in GC tissue, while normal gastric tissue exhibits only non-methylated sequences (12). As the disease progresses, the degree of methylation also changes, which may influence disease outcomes. The GRB10 gene encodes growth factor receptor-binding proteins involved in regulating the insulin signaling pathway and the occurrence and development of GC, although the underlying mechanism remains unclear. Knocking out the GRB10 gene significantly reduces the proliferation, adhesion, and migration abilities of GC cells (13).
IGFBPs constitute a cysteine-rich protein family capable of binding to IGF1 and IGF2, exerting biological functions. Their affinity for IGFs is higher than that of IGFR. During tumor development, this high affinity prolongs the half-life of IGFs, enhancing their interaction with IGFR, thereby regulating downstream IGF signaling pathways and forming the IGF-IGFR-IGFBP axis. IGF and IGFR are associated with the degree of liver fibrosis, reflecting the severity of NASH. This relationship may be linked to the regulatory effects of growth hormone-releasing hormone (GHRH) on nutrient metabolism. Therefore, the IGF-IGFR-IGFBP axis can serve as a valuable prognostic marker for NASH.
Promoter analysis revealed that BRD4 can form regulatory interactions with both PEG10 and IGFBP2. As an important member of the BET family, BRD4 contains two bromodomain transcriptional enhancers. Animal studies have confirmed that BRD4 can upregulate type I collagen alpha 1 chain (Col1A1) via the TGF-β signaling pathway, contributing to liver fibrosis (14). In liver fibrosis tissues, BRD4 expression is upregulated in fibrosis caused by various diseases and shows a positive correlation with the severity of fibrosis (15). Additionally, BRD4 can activate c-MYC through transcriptional and epigenetic regulatory mechanisms, promoting GC cell proliferation and inhibiting apoptosis (16). c-MYC is a known transcriptional target of BRD4. BET inhibitors, which bind to acetylated lysine residues within the bromodomain, have shown potential in inhibiting cancer cell proliferation and differentiation.
This study identified differences in gene expression between NASH and GC, providing references for disease diagnosis, treatment, and prognosis. However, limitations exist, including the lack of experimental validation and the reliance solely on dataset analysis. In summary, this study utilized bioinformatics approaches, explored databases, reviewed relevant literature, and discussed key genes involved in the occurrence, development, and prognosis of NASH and GC. These findings offer new insights and potential directions for disease diagnosis and therapeutic strategies.
