


1. Background
2. Objectives
3. Materials and Methods
3.1. Codon Optimization of HCVcp Gene and Construction of Expression Vectors
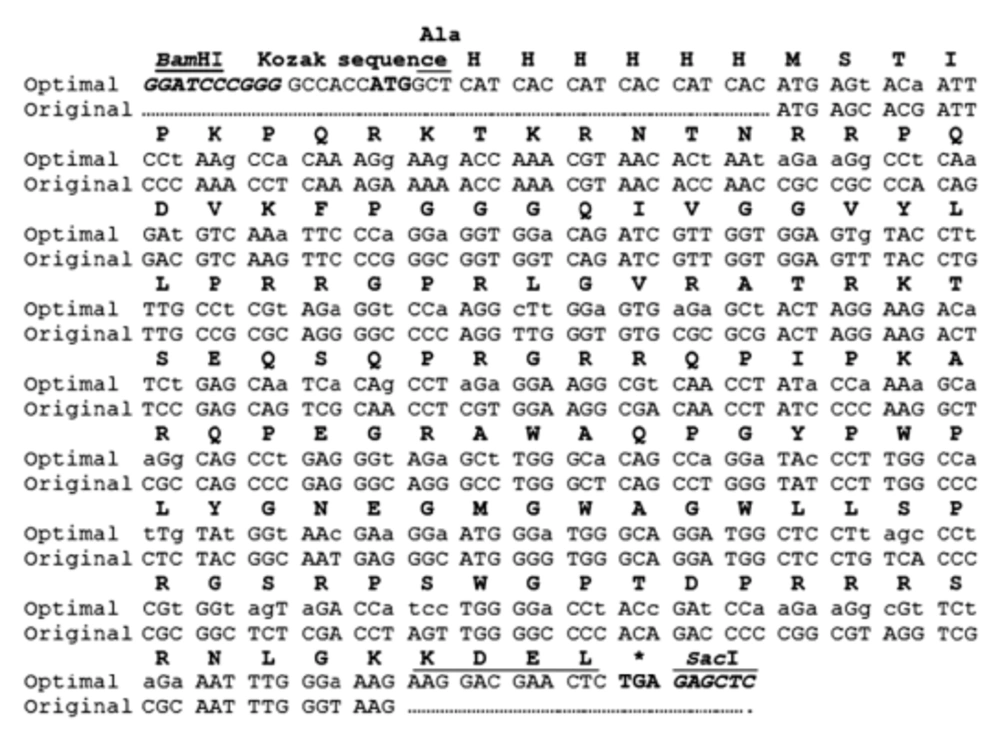
The changes to the original sequence are shown by lower case letters. Location of the Kozak sequence, 6 xHis-tag, nucleotides encoding KDEL and restriction sites for BamHI and SacI are indicated. ATG and TGA denote the start and termination codons, respectively.
3.2. Transformation of Agrobacterium tumefactions by Plant Expression Vectors
3.3. Co-Agroinfiltration of Nicotiana tabacum Leaves by p19 Silencing-Suppressor Gene
3.4. Protein Extraction
3.5. Sodium Dodecyl Sulfate Polyacrylamide Gel Electrophoresis and Blotting Analyses
3.6. Sandwich ELISA Analyses
3.7. Statistical Analyses
4. Results
4.1. Codon Optimization of Tr-HCVcp for Efficient Expression in Plant
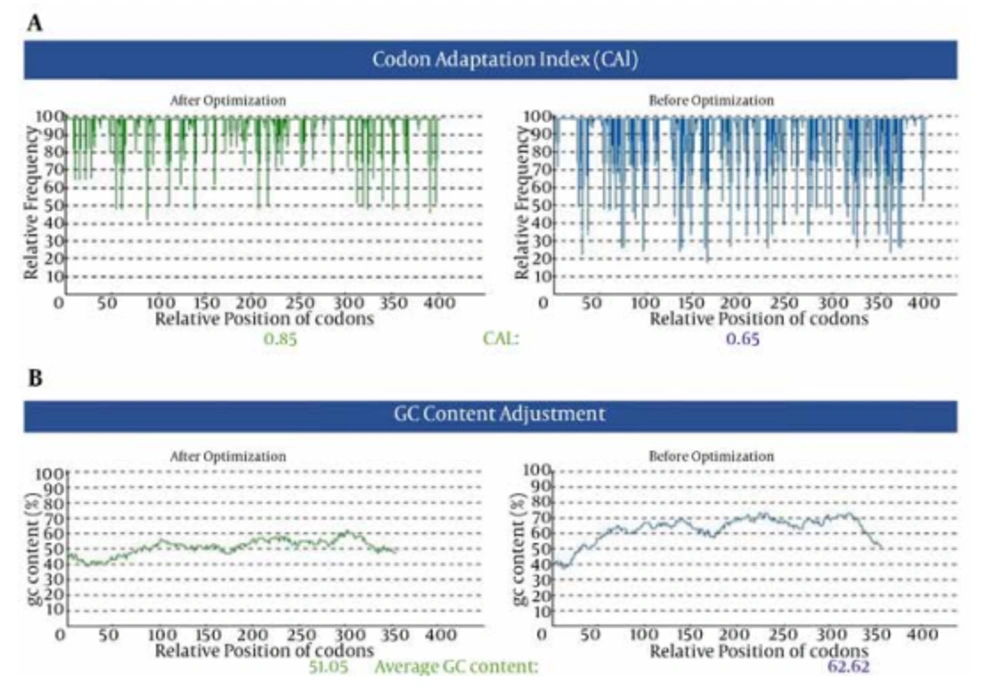
A) The corresponding nucleotide alterations increased the CAI value from 0.65 to 0.85 (the frequency of non-optimized bases decreased after optimization. The value of 100 is set for the codon with the highest usage frequency). B) The corresponding nucleotide alterations reduced the GC content from 62.62 to 51.05.
4.2. Tr-HCVcp Coding Plant Vectors
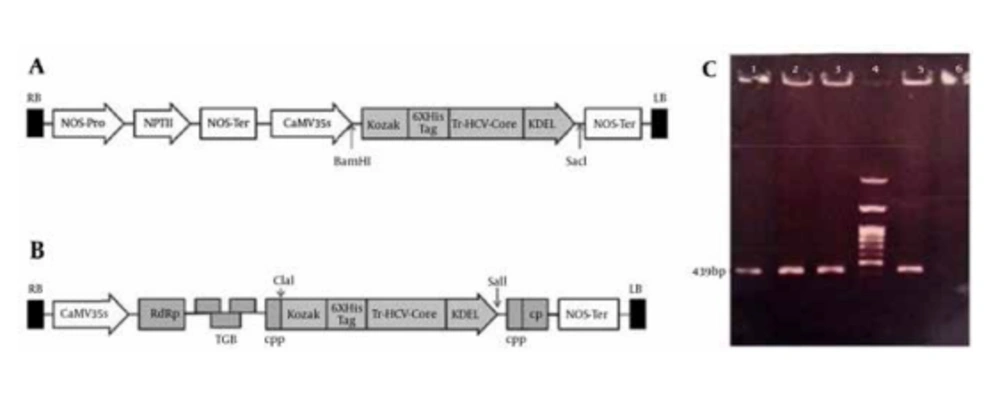
A) The synthetic Tr-HCVcp gene was inserted into pBI121 through BamHI/SacI sites under the control of CaMV 35S promoter. B) The Tr-HCVcp gene was cloned into ClaI/SalI sites of PVX-GW vector under the control of duplicated PVX-coat protein subgenomic promoter (CPP). C) Colony PCR analysis of transformed Agrobacterium LB4404. Lanes 1 and 2: PCR on colonies transformed with pBI-core; lanes 3 and 5: PCR on colonies transformed with PVX-core construct; lane 4: 100-bp DNA ladder; lane 6, untransformed Agrobacterium (without constructs) as negative control. Appearance of the 439-bp fragment in transformed colonies indicated the positive colonies.
4.3. Analyses of pHCVcp by Blotting Assays
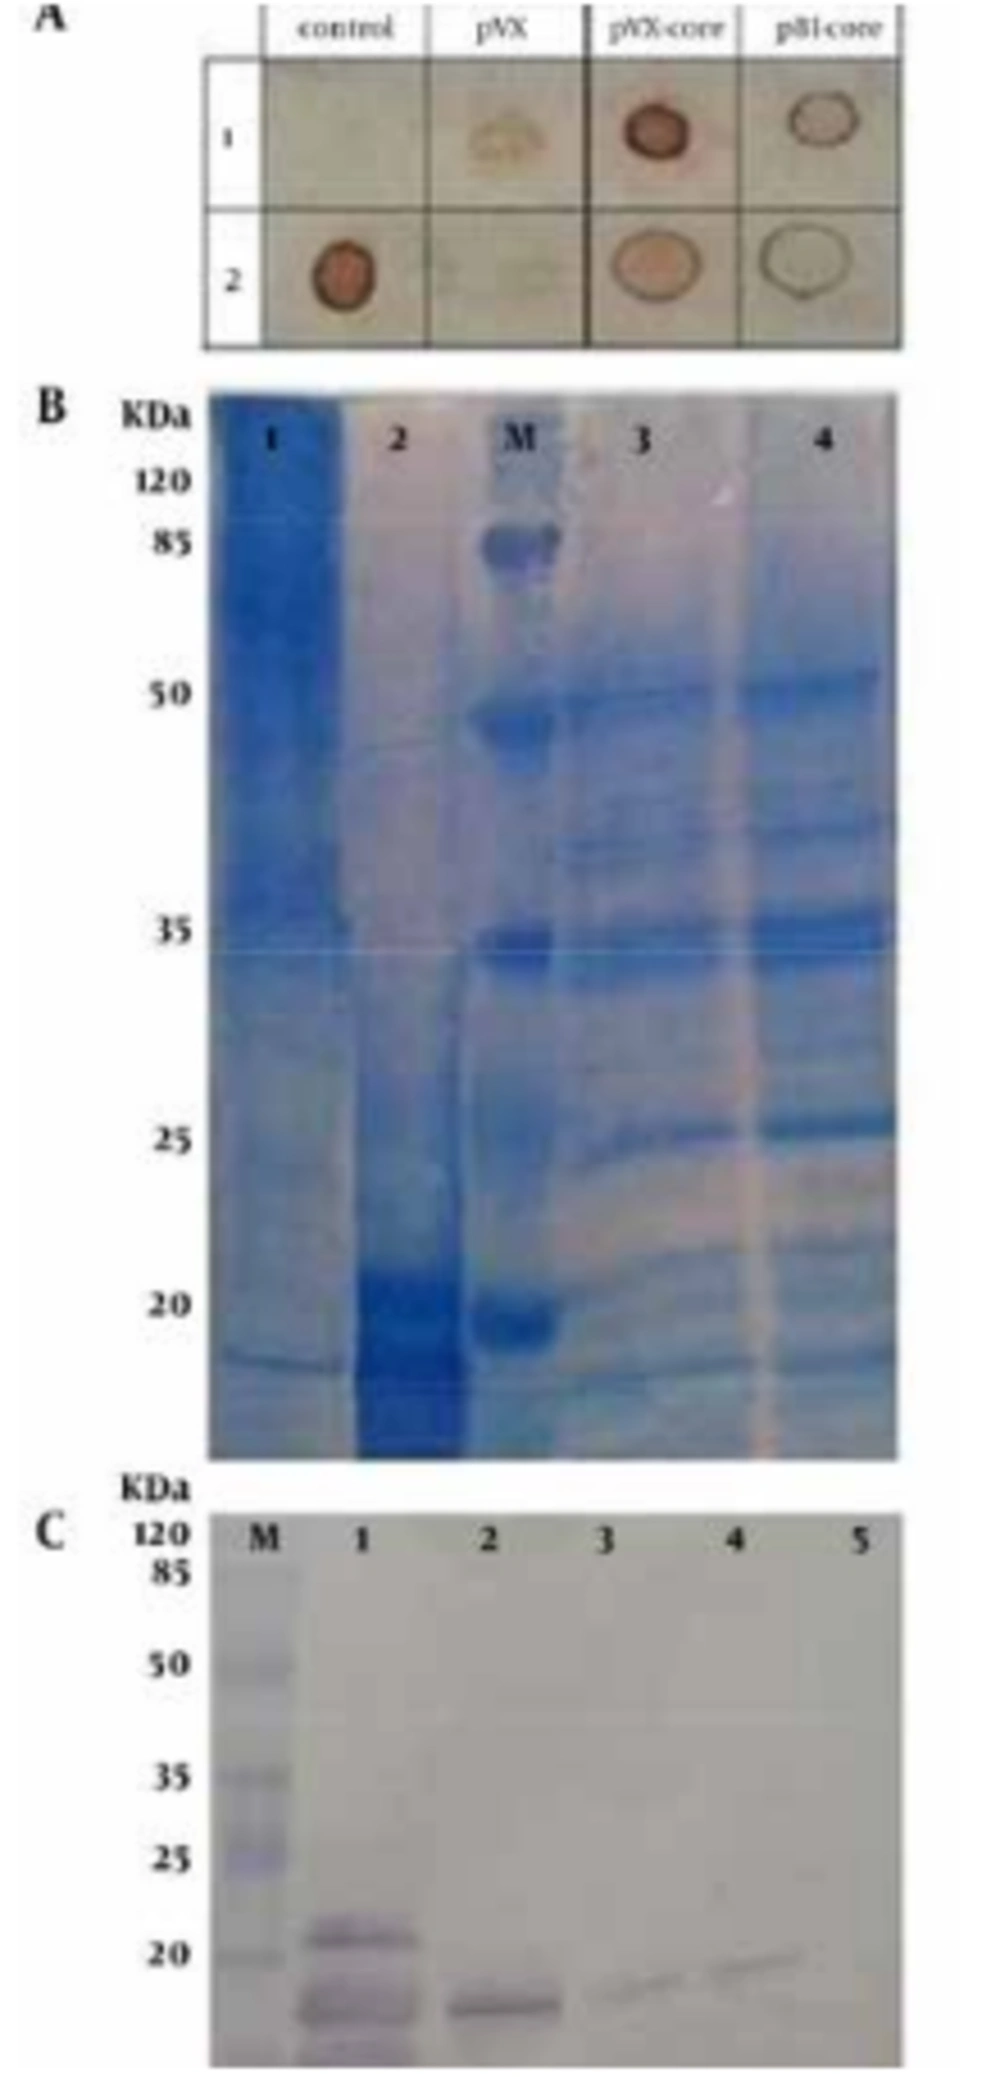
A). Dot blotting; at control column: row 1: negative control (25 μg TSP of untransformed tobacco leaves); row 2: 5 μg positive control (eHCVcp). At PVX column: negative control (tobacco leaves transformed by PVX vector alone; ie, without Tr-HCVcp). PVX-core and pBI-core columns: the extracts from the PVX-core and pBI-core P19 co-agroinfiltrated leaves, respectively. Rows 2 and 1 in these two last columns correspond to 5 µg and 25 µg of TSP, respectively. B) Coomassie-stained 12% SDS-PAGE gel, loaded with; lane 1: 5 μg concentrated plant-purified HCVcp (from the PVX-core expression system). Lane 2: 5 μg of purified eHCVcp. Lane 3: crude protein extract from agroinfiltrated leaves with PVX-core (20 µg). Lane 4: untransformed leaves (20 µg). C) Western blotting; lane 1: positive control (700 ng purified eHCVcp). Lane 2: purified pHCVcp (700 ng from the PVX-core expression system). Lanes 3 and 4: the extracts from P19 co-agroinfiltrated PVX-core and pBI-core leaves, respectively (50 µg of plant TSP was applied in each lane). Lane 5: negative control (50 µg of plant TSP of untransformed tobacco leaves). Lane M: prestained protein ladder (Fermentas). HCVcp denote to HCV core protein, eHCVcp and pHCVcp dnote to E.coli-derived and plant-derived HCVcp, respectively. In western blot and SDS-PAGE figures, the location of HCVcp under the 20 kDa molecular weight range is shown by arrows. The reason for multiple bands in the case of eHCVcp is explained in the corresponding result section of the text. The results of SDS-PAGE showed that Ni-NTA pull-downs of plant extract contained endogenous nonspecific plant proteins besides pHCVcp. According to ELISA data, the concentration of pHCVcp was 1/20 of the column-purified protein. Therefore, although 1 µg (100 µL of 10 μg/mL coated) was coated, only a small amount reacted (less than 50 ng) (Figure 5 B). However, none of these endogenous nonspecific plant proteins reacted with anti-HCVcp in western blotting of the purified protein fraction.
4.4. Analysis of the Expression Levels of pHCVcp and Its Diagnostic Potency by ELISA
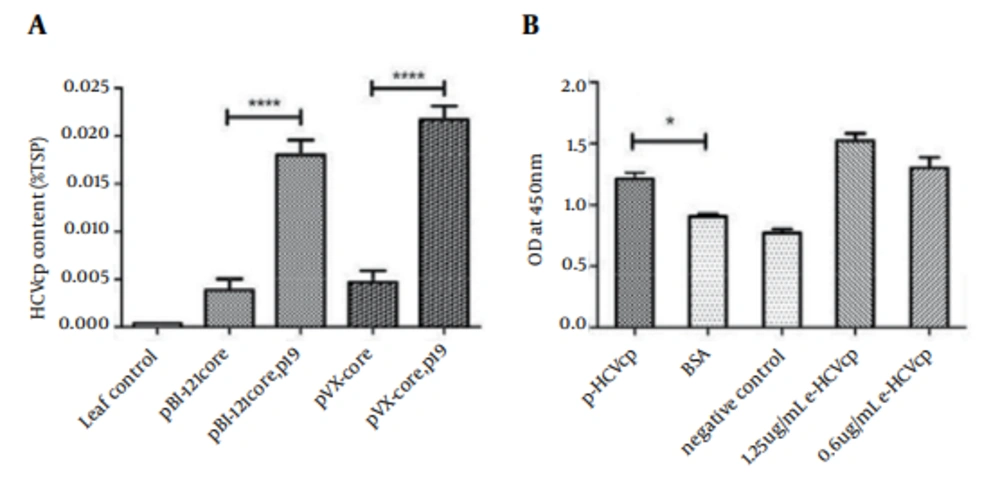
A) The expression level of pBI-core and PVX-core were assessed by ELISA and compared in the presence or absence of co-agroinfiltration by gene silencing suppressor P19 construct. Leaf control denotes the tobacco leaves transformed by PVX vector alone (ie, without Tr-HCVcp). B) Result of ELISA assay for confirmation of plant-derived HCVcp, using HCV-positive human serum. Negative control corresponds to HCV negative human sera. BSA was also used as another negative control. pHCVcp (corresponding to 100 µL of 10 µg/mL of pHCVcp from PVX-core-transformed tobacco leaves) and eHCVcp denote plant- and E. coli-derived HCVcp, respectively. Statistical analysis was performed by one-way analysis of variance (ANOVA), using the Bonferroni’s multiple comparison test.
