1. Background
Tissue engineering is an interdisciplinary field, which combines life and material sciences to restore or maintain tissue functions by means of 3D scaffolds and/or cells (1). The restoring capacity of patient during tissue engineering is enhanced and improved, thereby damaged tissues can be healed and their normal functions can be restored. There are three main therapeutic methods for curing impaired tissues in patients; (I) implantation of freshly cultured or isolated cells, (II) implantation of in vitro cultured tissues from cells and/or scaffolds; and (III) endogenous regeneration (2). In this regard, the methods for tissue engineering are diverse and plentiful, though choosing the proper biomaterial for the scaffold is as important as selection of appropriate cell type (1).
The ideal scaffold should exhibit immunologic integrity, have tissue-like mechanical properties and support cell adhesion, differentiation and migration. The temporary scaffold privileged wipes out via specific degradation, while new tissue is shaped (3). Scaffolds can be fabricated from synthetic materials, natural materials or mixture of them (hybrid scaffolds). Only a few numbers of synthetic and natural scaffolds show all these features; one of them named fibrin scaffolds. Fibrin is a natural substance with a high potential for application in tissue engineering. Moreover, it can be obtained from patient's own blood to be used as an autologous scaffold, to reduce the potential risk of immunological reaction or infections (4, 5). In vivo, fibrin has a main role in wound healing, inflammation, homeostasis and angiogenesis (6, 7). While in contact with fibrin, cells would progressively substitute the fibrin scaffold by their own extracellular matrix. Taken together, these properties make fibrin an interesting and widely used protein for tissue engineered scaffolds (8).
The features of fibrin scaffolds can be affected by changing the concentration of fibrinogen, thrombin and Ca2+ during polymerization (9). In addition, concentrations of these fibrin scaffold constituents modulate the way cells differentiate, proliferate and migrate within fibrin (10-12). The optimum conditions of fibrin scaffold were already specified in vitro for nerve cell culture (13, 14), fibroblasts fibrin (10, 15) and mesenchymal stem cells (11). These findings propose that fibrin scaffolds require to be optimized for each cell type to reduce the number of cell death and promote cell adhesion and migration. However, optimization of fibrin scaffold conditions for hepatic cell was not determined yet.
2. Objectives
The aim of this investigation was to optimize fibrin scaffold circumstances using statistical design method (Box-Behnken design) to enhance the proliferation of HepG2 cell line and to assign suitable cell seeding conditions. Moreover, we developed a fibrin scaffold manufactured from plasma as an inexpensive source of fibrinogen and thrombin. This research provided a framework for additional studies about essential factors for shaping hepatic tissue by applying fibrin-matrix scaffolds.
3. Materials and Methods
3.1. Culture of HepG2 Cells
The human HepG2 cell line (hepatic carcinoma cells) was prepared from the National Cell bank of Iran (NCBI, Pasteur Institute of Iran). HepG2 cells were cultured in 5% CO2 at 37°C in growth medium [RPMI 1640 (Gibco, Austria) supplemented with 10% (v/v) fetal calf serum (FBS, Gibco/BRL), 10 μg/mL streptomycin and 100 mg/mL penicillin (Sigma, CA, USA)]. Cells were subcultured every 5 - 7 days. Suspensions of HepG2 cells were obtained from mostly confluent cultures (about 80 - 90%) using Trypsin/EDTA solution and cell concentration determined using a hemocytometer. HepG2 cells were inoculated at equal densities directly into wells of a standard 24-well plate (Guangzhou, China). Growth medium was changed every 72 hours as required.
3.2. Preparation of Fibrin Scaffolds
Fresh frozen human plasma with normal coagulation parameters and 300 mg/dL fibrinogen concentration and citrate phosphate dextrose adenine (CPDA-1) (as an anticoagulant) was obtained from the Iranian Blood Transfusion Organization. A different volume of plasma/RPMI (1:4, 4:1, and 1:1) was added into each well of the 24-well plate; the ratio of plasma/RPMI is based on the final volume of each well (500,750 and 1000 µL) shown on Table 1. Various cell numbers (2 × 10³, 2 × 10⁴, and 1 × 10⁵) were seeded and followed by adding 50 µL of different CaCl2 concentrations stocks (0.1, 0.15, and 0.2 mol) per each well and incubated 20 minutes at 37°C in 5% CO2. After coagulation and formation of fibrin scaffold, 500 µL of RPMI 1640 media supplemented with 10% FBS was added on top of each scaffold and incubated at 37°C in 5% CO2. The growth media was replaced every 24 hours as required.
3.3. Optimization Procedure
For achieving the best condition for cell growth and fibrin scaffold fabrication, Response Surface Methodology (RSM) using Box-Behnken design experiment was applied to identify each key independent variable (16). All the experiments were designed using MINITAB software (version15, PA, USA). Experiments were performed in triplicate and mean values were reported. Finally, the ultimate optimum experimental factors were computed using the Minitab Response Surface Optimizer function, which enables us to distinguish the best combination of each constituent. The designed matrix for four independent variables is exhibited in Table 1. For forecasting the optimal point, a second order polynomial function was fitted to correlate the relationship among independent variables and response for the four factors (concentrations of CaCl2, initial cell numbers, and ratios of plasma/RPMI media and various volumes of scaffolds in each of the wells of 24 cell culture plate). This equation is:
(1) Y = β0 + β1X1 + β2X2 + β3X3 + β4X4 + β12X1X2 + β13X1X3 + β14X1X4 +β23X2X3 + β24X1X4 + β34X3X4 + β11X12+ β22X22 + β33X32 + β44X42
Where Y is the predicted response, β0 is model constant; β1, β2, β3 and β4 are linear coefficients; X1, X2, X3 and X4 are independent variables; β12, β13, β14, β23, β24 and β34 are cross product coefficients and β11, β22, β33 and β44 are quadratic coefficients. The quality of fit of the polynomial model equation was presented by the coefficient of determination R2.
3.4. Viability Assay
Scaffolds were degraded with fibrinolytic activity of streptokinase (10000IU) in each well for 10 minutes at 37°C until the whole fibrin scaffold was dissolved, and then, cell viability was evaluated by Trypan Blue dye exclusion assay after 10 days of incubation (17).
3.5. Function Assay
The functional assays were evaluated by determination of urea secretion after 24 hours in media on the fifth and tenth days using commercial Quantification Kit (Pars Azmoon, Tehran, Iran).
Table 1.
Experimental and Predicted Values of Urea Secretion Recorded in the Box-Behnken Design a
| Trials | Ca++, mol | Cell Number | Plasma/RPMI | Volume, µL | Urea Secretion, mg/dL | |||
|---|---|---|---|---|---|---|---|---|
| Day 5 | Day 10 | |||||||
| Measured | Predicted | Measured | Predicted | |||||
| 1 | -1 (0.1) | 0 (2 × 10⁴) | -1 (1:4) | 0 (750) | 14.30 | 14.09 | 15.50 | 15.49 |
| 2 | -1 (0.1) | 0 (2 × 10⁴) | 1 (4:1) | 0 (750) | 13.10 | 13.16 | 10.80 | 10.50 |
| 3 | 1 (0.2) | 1 (1 × 10⁵) | 0 (4:1) | 0 (750) | 17.80 | 17.94 | 20.25 | 21.18 |
| 4 | 0 (0.15) | 0 (2 × 10⁴) | 0 (4:1) | 0 (750) | 15.50 | 15.63 | 16.30 | 16.36 |
| 5 | -1 (0.1) | 1 (1 × 10⁵) | 0 (1:1) | 0 (750) | 15.30 | 15.05 | 17.30 | 16.93 |
| 6 | -1 (0.1) | 0 (2 × 10⁴) | 0 (1:1) | 1 (1000) | 13.00 | 13.38 | 13.50 | 13.67 |
| 7 | 1 (0.2) | 0 (2 × 10⁴) | 0 (1:1) | -1 (500) | 15.00 | 14.78 | 16.10 | 16.35 |
| 8 | 0 (0.15) | 0 (2 × 10⁴) | -1 (1:4) | -1 (500) | 18.20 | 17.89 | 16.50 | 16.59 |
| 9 | 1 (0.2) | 0 (2 × 10⁴) | 1 (4:1) | 0 (750) | 12.90 | 13.06 | 15.00 | 14.27 |
| 10 | 1 (0.2) | -1 (2 × 10³) | 0 (1:1) | 0 (750) | 13.21 | 13.32 | 12.50 | 13.16 |
| 11 | 0 (0.15) | -1 (2 × 10³) | -1 (1:4) | 0 (750) | 15.30 | 15.64 | 14.75 | 15.31 |
| 12 | 0 (0.15) | 0 (2 × 10⁵) | 1 (4:1) | -1 (500) | 13.10 | 13.31 | 11.80 | 13.10 |
| 13 | 0 (0.15) | 1 (1 × 10⁵) | 0 (1:1) | 1 (1000) | 17.40 | 17.19 | 16.90 | 17.30 |
| 14 | 0 (0.15) | 0 (2 × 10⁴) | 1 (4:1) | 1 (1000) | 15.29 | 15.46 | 12.50 | 12.70 |
| 15 | 0 (0.15) | 1 (1 × 10⁵) | 0 (1:1) | -1 (500) | 18.50 | 18.36 | 23.50 | 21.85 |
| 16 | 0 (0.15) | -1 (2 × 10³) | 0 (1:1) | -1 (500) | 13.70 | 13.86 | 13.50 | 12.35 |
| 17 | 0 (0.15) | 0 (2 × 10⁴) | 0 (1:1) | 0 (750) | 15.70 | 15.63 | 16.60 | 16.36 |
| 18 | 0 (0.15) | -1 (2 × 10³) | 0 (1:1) | 1 (1000) | 15.15 | 15.24 | 14.50 | 15.40 |
| 19 | -1 (0.1) | -1 (2 × 10³) | 0 (1:1) | 0 (750) | 13.50 | 13.22 | 14.20 | 13.56 |
| 20 | -1 (0.1) | 0 (2 × 10⁴) | 0 (1:1) | -1 (500) | 14.00 | 14.28 | 12.50 | 13.62 |
| 21 | 0 (0.15) | 0 (2 × 10⁴) | 0 (1:1) | 0 (750) | 15.70 | 15.63 | 16.20 | 16.36 |
| 22 | 1 (0.2) | 0 (2 × 10⁵) | 0 (1:1) | 1 (1000) | 16.00 | 15.88 | 15.50 | 14.80 |
| 23 | 0 (0.15) | -1 (2 × 10³) | 1 (4:1) | 0 (750) | 13.50 | 13.05 | 11.50 | 11.14 |
| 24 | 1 (0.2) | 0 (2 × 10⁵) | -1 (1:4) | 0 (750) | 17.30 | 17.19 | 16.00 | 15.56 |
| 25 | 0 (0.15) | 0 (2 × 10⁵) | -1 (1:4) | 1 (1000) | 16.30 | 15.95 | 16.50 | 15.49 |
| 26 | 0 (0.15) | 1 (1 × 10⁵) | -1 (1:4) | 0 (750) | 18.20 | 18.81 | 19.20 | 19.98 |
| 27 | 0 (0.15) | 1 (1 × 10⁵) | 1 (4:1) | 0 (750) | 16.50 | 16.32 | 18.00 | 17.86 |
a The values in parenthesis are the levels of coded variables.
4. Results
4.1. Morphological Characteristics of HepG2 Cells Grown on Alternative Substrates
The cultivation of HepG2 cell line in routine 2D flask and 3D fibrin scaffold showed significant differences in obtained cells morphology. The grown cells in 2D flask (usually polystyrene surfaces) showed flat extended structures after two days of cultivation. They were also heterogeneous and showed as disarrangement in their appearance. Moreover, after seven days of cultivation, the cells formed aggregates and appeared as unhealthy in which some cells were disintegrating and others were rounding up (data not shown). In contrast, 3D cultivation of HepG2 cell line in fibrin scaffold led to more homogeneous cells compared to their 2D counterparts. In this system, HepG2 cell line could intimately interact with the surrounding fibrin scaffold containing plasma and the nutritious environment of human plasma could help these cells to differentiate and proliferate appropriately. Most observed cells in 3D fibrin scaffold had spheroid shape, forming multicellular spheroids (Figure 1). This aggregation is necessary for re-establishment of cell-cell contacts to function as a natural tissue (18). Some researchers reported that existence of extracellular matrices (ECMs) in plasma promoted cell morphologies, phenotypes, differentiated functions and metabolic activities of hepatocytes in a 3D configuration in-vitro (19, 20). These data showed that fibrin scaffold containing human plasma provide an inspiring material for differentiation and cell adhesion studies (21, 22).
4.2. Fibrin Gel Appearance
The initial observation of the formed fibrin scaffold revealed that various combinations of abovementioned factors affected fibrin scaffold appearance. Regarding plasma/RPMI 1640 ratio, gels with a ratio of 1:1 and 4:1 showed a transparent appearance. In contrast, gels prepared with less than 1:1 plasma/RPMI 1640 ratio appeared a little turbid after gelling, were unstable and contracted within ten days of incubation; however, they did not dissolve during this incubation (data not shown). While Ca2+ concentrations of 0.15 mol and 0.1 mol Ca2+ led to transparent gels, fibrin gels containing more than 0.15 mol Ca2+ were turbid (data not shown). Our results showed consistency with the findings of Eyrich et al. who reported similar results (23). It is suggested that such divalent ions like Ca2+ affect fibrin gel transparency due to their influences of electrostatic forces and ionic strength, though any increase in Ca2+ concentration results in fibrin gel turbidity (24, 25). More interestingly, it is reported that variation of parameters for gelation of fibrin scaffold, such as concentration of fibrinogen and thrombin and ionic strength had significantly affected gel appearance, mechanical properties and stability (26).
At very low fibrinogen concentrations (less than 0.5 mg/mL) the fibrin gel appeared turbid, which was related to the large pore size and large fiber diameter (27). In contrast, the opposite impact took place at higher fibrinogen concentrations (1.5 - 23.4 mg/mL) that resulted in finer and stiffer fibrin gels (24). Moreover, changes in thrombin concentrations for 0.001 - 1 U/mL influenced the gel structure (27). However, Eyrich et al. found that variation in thrombin concentration did not affect gel appearance and only affected the speed of polymerization (23). These findings were in agreement with our results showing that normal physiological thrombin concentration (0.9 U/mL) in plasma/RPMI 1640 had no effect on gel appearance.
4.3. Determination of Optimal Fibrin Scaffold Components
The response surface methodology using Box-Behnken design was applied to optimize the fibrin scaffold. Four variables including Ca2+ concentrations, cell numbers, various ratio of plasma/RPMI 1640 and thickness of fibrin scaffold were considered to evaluate the conditions for fibrin scaffold optimization. Urea secretion in culture media was opted as the response for different run series of the runs. Table 1 shows the design matrix for four independent variables for urea secretion in 27 experiments, which were run in three times. Then mean of each response (urea secretion) was computed. The obtained data from the experiments were analyzed by linear multiple regression using Minitab 15 and presented in Tables 2 and 3. The corresponding second-order response model founded after the regression analysis was (Day 5 of incubation):
(2) Y day 5 = 15.63 + 0.75X1 + 1.61X2 - 1.26X3 + 0.05X4 - 1.16X12 + 0.41X22 - 0.09X32 + 0.11X42 + 0.69X1X2 - 0.80X1X3 + 0.50X1X4 + 0.02X2X3 - 0.6X2X4 + 1.02 X3X4
(3) Y day 10 = 16.36 + 0.96X1 + 2.85X2 - 1.57X3 - 0.37X4 - 1.13X12 + 0.98X22 - 1.27X32 - 0.61X42 + 1.16X1X2 + 0.92X1X3 - 0.40X1X4 + 0.51X2X3 - 1.90X2X4 + 0.17X3X4
Where Y is the predicted response (urea secretion) and X1, X2, X3 and X4 are the coded values of Ca2+ concentration, cell number, plasma/RPMI1640 ratio and thickness, respectively. As illustrated in Tables 4 and 5, relatively high F value and very low P value indicated that the experimental model was in excellent conformity with the experiment for both responses (day 5 and day 10). ANOVA showed that linear term of the polynomial model was much significant. Data in Tables 4 and 5 show low value of F test and high P value (P > 0.05) for lack of fit, which was non-significant indicating that the model is fit. The linear regression coefficients R2 = 0.9795 and 0.9351 and the adjusted determination coefficients R2 (Adj) were 0.9556 and 0.8594 for the model (for day 5 and day 10, respectively), which showed accuracy of the model for the Box-Behnken design. R2 values close to one proposed the robust model resulting in actual values of responses which were closer to the predicted one (16). Among interactive terms for day 5 of incubation, only X2X3 did not have a significant influence (P > 0.05) on responses (urea secretion), while X1X3 (Ca2+ concentration vs. plasma/RPMI1640 ratio) and X2X4 (cell number vs. thickness) coefficient presented a negative effect on HepG2 cell viability (urea secretion for day 5); therefore, they were not suitable for viability of HepG2 cell line. These negative impacts may attribute to the fact that high Ca2+ provided turbid gels that were more viscous than transparent gels. This higher viscosity may hinder the formation of more densely cross-linked networks leading to failure of withstanding high mechanical loading needed for the cell viability (28). Among the four variables, the plasma/RPMI 1640 ratio and thickness had a negative impact on cell viability. However, P > 0.05 for the thickness means that no significant correlation is present. The detrimental impact of plasma/RPMI 1640 may attribute to the high fibrin concentration, which was proportional to the plasma volume, resulted in a more rigid and dense fibrin gel that halted cell migration and proliferation (11).
Due to the high number of variables, one by one comparison is time consuming and may lead to misinterpretation. Therefore, the final optimum levels of four components were calculated by means of Minitab Response Surface Optimizer function. Optimized values of the factors (for day 5) were found to be: Ca2+ concentration 0.15 mol, cell number 105, plasma/RPMI 1640 -1:4 and thickness 2.3 mm. A similar pattern was also found for day 10 results. In addition, this model forecasted up to 21.19 mg/dL of urea secretion proportional to the cell viability and activity. By comparing the forecasted and observed values of the Box-Behnken design (Table 1), their good correlation supported precision of the response model and existence of an optimal point (16, 29). However, most researchers investigated optimal conditions for manufacturing fibrin scaffold by means of one-factor-at-a-time methods; there was no report of using statistical design. For the first time, we used the Box-Behnken Design to determine the optimum components for fabricating fibrin scaffold. In this regard, Eyrich et al. reported the optimum fibrin scaffold components as fibrinogen concentration of 25 mg/mL, 3 million cells per construct and Ca2+ concentration of 20 mM in pH between 6.8 and 9 using one-factor-at-a-time method (23). In a similar study, Willerth et al. found optimal fibrin scaffold constituents of 10 mg/mL for fibrinogen and 2 NIH units/mL of thrombin (9). In another study, Ferreira et al. evaluated various scaffolds for blood-hematopoietic stem cell expansion and found that fibrin-based scaffold provided the best 3D support, which gave the highest numbers of engraftment and multilineage differentiation in comparison to other 3D biomaterial scaffolds. These features may be due to the efficient cell adhesion to the substrate, which is known to be part of the natural process happening in the liver niche that controls cell proliferation and differentiation. Moreover, this efficient adhesion is sufficient enough for cell migration and homing abilities (30). In comparison to our results, it was concluded that moderate concentration of fibrinogen plus Ca2+ concentration would result optimum fibrin scaffold, though at this fibrinogen concentration, the proliferation and migration of HepG2 cell line would be occurred optimally.
Additional studies are needed to elucidate other components, which exist in human plasma for better fibrin scaffold manufacturing. In addition, it is necessary to evaluate the immunological reactions to ensure lack or minimum allergenicity. Using human plasma instead of purified fibrinogen provides an easy method for fibrin scaffold fabrication and is considered an economic advantage due to elimination of the costs of purification steps in the preparation of pure fibrinogen with no need for using thrombin. Moreover, in human plasma, some growth factors or other components may exist in human plasma, which are essential for cell proliferation or differentiation.
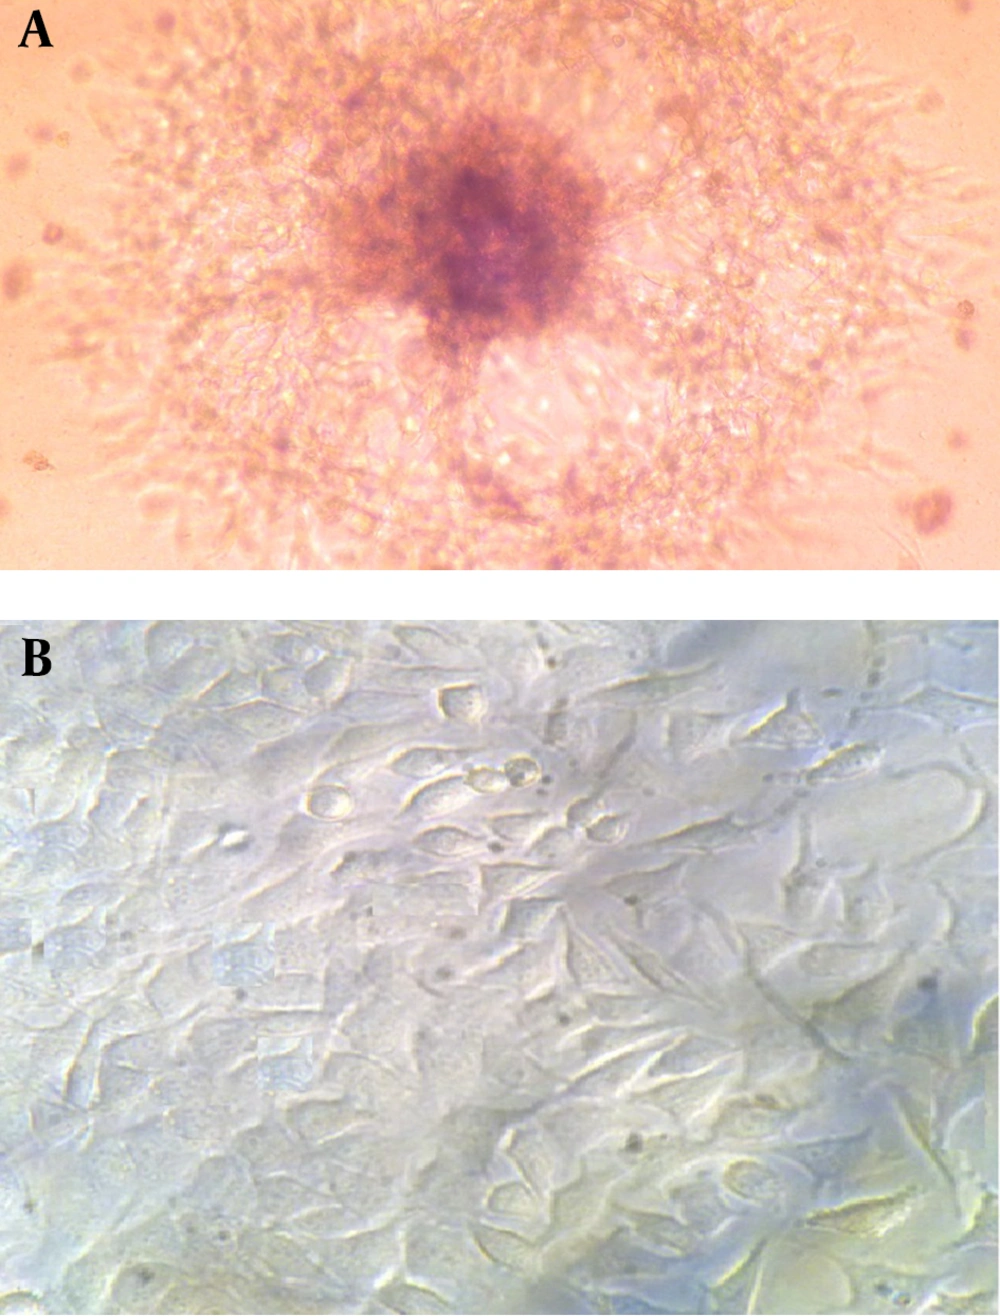
Figure 1.
Light Microscopy Evaluation of HepG2 Morphology, After 10 Days of Incubation in A) Fibrin Scaffold 10 × and B) in 2D Routine Polystyrene Matrix 40 × (B)
Table 2.
Statistical Analysis of the Box-Behnken Design for Day Five
| Variable | Coefficient | SE-Coefficient | t | P Value |
|---|---|---|---|---|
| Constant | 15.6333 | 0.2159 | 72.395 | 0.000 |
| X1 | 0.7508 | 0.1080 | 6.954 | 0.000 |
| X2 | 1.6117 | 0.1080 | 14.927 | 0.000 |
| X3 | -1.2675 | 0.1080 | -11.739 | 0.000 |
| X4 | 0.0533 | 0.1080 | 0.494 | 0.630 |
| X12 | -1.1633 | 0.1620 | -7.183 | 0.000 |
| X22 | 0.4179 | 0.1620 | 2.580 | 0.024 |
| X32 | -0.0908 | 0.1620 | -0.561 | 0.585 |
| X42 | 0.1154 | 0.1620 | 0.713 | 0.490 |
| X1X2 | 0.6975 | 0.1870 | 3.730 | 0.003 |
| X1X3 | -0.8000 | 0.1870 | -4.278 | 0.001 |
| X1X4 | 0.5000 | 0.1870 | 2.674 | 0.020 |
| X2X3 | 0.0250 | 0.1870 | 0.134 | 0.896 |
| X2X4 | -0.6375 | 0.1870 | -3.409 | 0.005 |
| X3X4 | 1.0225 | 0.1870 | 5.467 | 0.000 |
Table 3.
Statistical Analysis of the Box-Behnken Design for Day Ten
| Variable | Coefficient | SE-Coefficient | T | P Value |
|---|---|---|---|---|
| Constant | 16.3667 | 0.6107 | 26.798 | 0.000 |
| X1 | 0.9625 | 0.3054 | 3.152 | 0.008 |
| X2 | 2.8500 | 0.3054 | 9.333 | 0.000 |
| X3 | -1.5708 | 0.3054 | -5.144 | 0.000 |
| X4 | -0.3750 | 0.3054 | -1228 | 0.243 |
| X12 | -1.1354 | 0.4581 | -2.479 | 0.029 |
| X22 | 0.9833 | 0.4581 | 2.147 | 0.053 |
| X32 | -1.2729 | 0.4581 | -2.779 | 0.017 |
| X42 | -0.6167 | 0.4581 | -1.346 | 0.203 |
| X1X2 | 1.1625 | 0.5289 | 2.198 | 0.048 |
| X1X3 | 0.9250 | 0.5289 | 1.749 | 0.106 |
| X1X4 | -0.4000 | 0.5289 | -0.756 | 0.464 |
| X2X3 | 0.5125 | 0.5289 | 0.969 | 0.352 |
| X2X4 | -1.9000 | 0.5289 | -3.592 | 0.004 |
| X3X4 | 0.1750 | 0.5289 | 0.331 | 0.746 |
Table 4.
ANOVA for the Model That Represents a Secretion Yield From HepG2 in Day Five of Incubation a
| Source | DF b | Sum of Squares | Mean of Squares | F Value | P Value |
|---|---|---|---|---|---|
| Regression | 14 | 80.2674 | 5.7334 | 40.98 | 0.000 |
| Linear | 4 | 57.2475 | 14.3119 | 102.30 | 0.000 |
| Square | 4 | 11.7038 | 2.9259 | 20.91 | 0.000 |
| Interaction | 6 | 11.3162 | 1.8860 | 13.48 | 0.000 |
| Residual Error | 12 | 1.6788 | 0.1399 | ||
| Lack-of-Fit | 10 | 1.6521 | 0.1652 | 12.39 | 0.077 |
| Pure Error | 2 | 0.0267 | 0.0133 | ||
| Total | 26 | 81.9462 |
a Abbreviation: DF, degrees of freedom.
b Data are presented with R2 = 0.9795.
Table 5.
ANOVA for the Model That Represents a Secretion Yield From HepG2 in Day Ten of Incubation a
| Source | DF b | Sum of Squares | Mean of Squares | F Value | P Value |
|---|---|---|---|---|---|
| Regression | 14 | 193.462 | 13.8187 | 12.35 | 0.000 |
| Linear | 4 | 139.885 | 34.9711 | 31.25 | 0.000 |
| Square | 4 | 28.496 | 7.1240 | 6.37 | 0.005 |
| Interaction | 6 | 25.081 | 4.1802 | 3.74 | 0.025 |
| Residual Error | 12 | 13.429 | 1.1190 | ||
| Lack-of-Fit | 10 | 13.342 | 1.3342 | 30.79 | 0.075 |
| Pure Error | 2 | 0.087 | 0.0433 | ||
| Total | 26 | 206.890 |
a Abbreviation: DF, degrees of freedom.
b Data are presented with R2 = 0.9795.
5. Discussion
Fibrin is a natural substance with a high potential for application in tissue engineering. Fibrin based scaffold provides the best 3D support and acts as a vector to deliver growth factors and other components that play an essential role in cell proliferation, migration, differentiation and tissue regeneration (30). Wu et al. fabricated self-assembling peptide nanofiber scaffold that can serve as an ideal model for tumorigenesis, growth, local invasion and metastasis, with results comparable to our data. However, ease of manipulation and inexpensive fibrin scaffold could be important advantages in the fabrication of scaffolds (18). In this study, we determined optimal components for the preparation of fibrin scaffold for hepatic tissue engineering. Cultivation of HepG2 cell lines within these 3D scaffolds resulted in the development of an efficient hepatic tissue. These fabricated fibrin scaffolds show appropriate long-term stability providing adequate time for the formation of hepatic tissue as well as human hepatocytes. Moreover, preparation of these fibrin scaffolds from human plasma has advantage over conventional purified fibrinogen due to ease of the process; hence, it is ideal for a wide variety of applications in tissue engineering. However, to use this novel expansion strategy for human liver transplantation protocols, comprehensive clinical examinations need to be performed to avoid possible side effects. Totally, our approach is a safe an economic method versus previous strategies and has a potential to be used in clinics.