1. Background
Chronic hepatitis B (CHB) has been established as a risk factor for cirrhosis and hepatocellular carcinoma (1). In CHB patients, covalently closed circular DNA (cccDNA) serves as the template for hepatitis B virus (HBV) gene expression, and thus plays an important role in the life cycle of virus and maintenance of persistent infection (2). Therefore, cccDNA is considered a reliable marker for HBV infection and persistence (3, 4). The existence and longevity of cccDNA may account for the lack of efficacy of present antiviral therapies for CHB (5, 6). Understanding the role of cccDNA in the course of CHB infection may reveal novel antiviral targets for therapeutic drugs and facilitate the design of antiviral strategies to decrease and eventually clear cccDNA pool (7, 8). Determining the mechanism of cccDNA formation and regulation is crucial for comprehending HBV pathogenesis and evaluating antiviral drugs. Therefore, development of a reliable cccDNA measurement method is necessary. Recently, several methods were developed to detect HBV cccDNA (8-11). DNA-based methods such as Southern blotting and real-time PCR (e.g. nested PCR, invader PCR and rolling cycle PCR) are highly reproducible and sensitive. However, the Southern blot assay is time-consuming and costly (9), thus its use is highly limited in routine clinical laboratory. PCR-based methods have high discriminatory power, rapid processing and low cost. Therefore, many PCR-based quantitative methods have been developed to detect cccDNA in liver tissue (12-14), serum (15, 16), peripheral blood mononuclear cells (PMBC) (8, 17) and marrow mononuclear cells (MMNCs) (8, 18) in CHB patients. However, detectable rates vary for the same sample (e.g. serum and PMBC samples). Some studies failed to detect cccDNA from serum (9, 10, 13, 19); whereas some studies reported that the concentration of cccDNA in CHB patient sera reaches 104–106 copies/mL (8, 16, 20). These differences might arise from different methods used by different researchers and low level of serum cccDNA (21). Therefore, specific detection and enrichment separation for quantitative cccDNA is very important. The specificity of HBV cccDNA detection is based on two important factors (21): (a) selective extraction of cccDNA and removal of interfering substances such as rcDNA, and (b) design of primers located on both sides of the rcDNA gap, resulting in selective amplification of cccDNA. For more than a decade, magnetic particles have been widely applied to separate nucleic acids from complex mixtures. For clinical diagnostics, selective extraction of nucleic acids is essential to isolate target DNA or RNA from background material that may significantly interferes with downstream processes such as reverse transcription and amplification. This method commonly uses magnetic particles functionalized with either streptavidin or short oligonucleotides (22, 23). The magnetic bead surface can be modified in various ways by bio-conjugation techniques, and hybridization efficiencies are similar to those in solution and better than those using other fixed solid supports.
2. Objectives
In the present study, we aimed to develop a magnetic capture hybridization and quantitative PCR method for HBV cccDNA by combining the specificity of functionalized nanoparticles and sensitivity of quantitative PCR technology and evaluate its performance primarily.
3. Materials and Methods
3.1. Preparation and Modification of Magnetic Nanoparticles
Magnetic nanoparticles were prepared by the co-precipitation method (24) and magnetite-silica core-shell nanoparticles were synthesized using reverse microemulsion method (25). Then streptavidin (SA) was absorbed to the nanoparticle surfaces and fixed with glutaraldehyde according to the literature (26, 27).
3.2. Preparation of Functionalized Nanoparticles
Oligonucleotides were designed using Oligo®primer analysis software (version 7.56, Molecular Biology Insights, Inc.) for specific cccDNA capture targeted both sides of the rcDNA gap to selectively capture cccDNA. The sequences were listed in Table 1. The 5’-biotin-labeled oligonucleotides [Sangon Biotech (Shanghai) Co. Ltd] were linked to magnetic beads modified by streptavidin (28).
| Oligonucleotide | length | sequence (5’-3’) | Use |
|---|---|---|---|
| probe 1 | 26 | act ctc agc aat gtc aac gac cga cc | capture probe |
| probe 2 | 21 | ctt cgc ttc acc tct gca cgt | capture probe |
| probe 3 | 35 | tgt act agg agg ctg tag gca taa att ggt ctg tt | capture probe |
| probe 4 | 49 | agg tta atg atc ttt gta cta gga ggc tgt agg cat aaa ttg gtc tgt t | capture probe |
| FITC-1 | 26 | ggt cgg tcg ttg aca ttg ctg aga gt | complementary hybridization probe |
| FITC-1 | 21 | acg tgc aga ggt gaa gcg aag | complementary hybridization probe |
| FITC-1 | 35 | aa cag acc aat tta tgc cta cag cct cct agt aca | complementary hybridization probe |
| FITC-1 | 49 | a aca gac caa ttt atg cct aca gcc tcc tag tac aaa gat cat taa cct | complementary hybridization probe |
| control | 26 | tga gag tcg tta cag ttg ctg gct gg | noncomplementary hybridization probe |
Oligonucleotide Probes Used in This Study
3.3. Hybridization Capture of Complementary Oligonucleotides
To optimize the proportion of particles and target sequences, we performed the experiment as follows: 5’-fluorescently labeled oligonucleotides completely complementary to the capture probe were synthesized by Sangon Biotech Co., Ltd (Shanghai). The sequences are listed in Table 1. Hybridization reaction mixtures consisted of 50 μL of functionalized magnetic particles, 10 μL of labeled oligonucleotides (50, 100, 150 and 200 pmol), 10 μL of sodium chloride (5 M) and 30 μL of hybridization buffer (20 mmol/Tris-HCl, 150 mmol/L NaCl, pH 8.0). Reactions were incubated at 62°C for 30 minutes with slow, end-over-end rotation (14). The supernatant was removed and the fluorescence intensity was detected using a fluorescence spectrophotometer (2300 EnSpire Multilabel Reader, software version 3.0, Finland).
3.4. Optimization of Functional Nanoparticles for cccDNA
To determine the optimal functionalized nanoparticle probe for cccDNA capture, the same batches of particles previously used for capture of fluorescently labeled oligonucleotides were applied in capture experiments with plasmid HBV DNA (cccDNA standard) with the following reaction conditions; 5 μL of functionalized nanoparticles (1 μg/μL), 5 μL of diluted plasmid HBV DNA templates (105 IU/mL), 18 μL of hybridization buffer and 2 μL of 5 mol/L NaCl. The mixture solutions were incubated at 62°C for 1 hour, 2 hours or 3 hours (14). Next, the supernatant was removed, the particles were washed three times, 30 μL of hybridization buffer was added, and denaturing was achieved by heating at 95°C for 10 minutes and then immediately cooling on ice. The supernatant was separated and the concentration of cccDNA was detected quantitatively by real-time PCR. Briefly, a 30 μL reaction solution was prepared that contained 4 μL of supernatant (template), 2 μL of Taq enzyme (TakaRa), 3 μL of Taqman probes, 2 μL each of the forward and reverse primers and 17 μL of PCR buffer. The sequences of the primers and probe were as follows; up primer: 5’-ggg gcg cac ctc tct tta-3’; down primer: 5’-agg cac agc ttg gag gc-3’; and probe: FAM-5’-tcc tcc aat ttg tcc tgg tta tcg ct-3’-TAMRA. The real-time PCR reaction was performed at 50°C for 2 minutes and 94°C for 5 minutes followed by 40 cycles of 94°C for 30 seconds and 60°C for 60 seconds. Serially diluted plasmid DNA containing complete HBV genome served as a quantitative standard.
3.5. Confirmation of Lower Limit and Specificity of Detection
To evaluate the limits of detection, linearity, and reproducibility, 10-fold serial dilutions of cccDNA standards were hybridized with optimal functionalized nanoparticle capture probe and subjected to magnetic separation and real-time PCR as described above. All samples were analyzed in triplicate (inter-run) on five consecutive days (intra-run), so 15 samples were analyzed by MCH-PCR per dilution. To assess whether this assay cross reacts with HBV rcDNA, a CHB patient plasma sample (cccDNA negative) containing 1.05 × 10⁸ IU/mL of total HBV DNA was selected. The DNA was extracted and quantified using the Artus HBV TM PCR Kit (QIAGEN, Germany). Then, mixed samples were composed using 10 μL 10-fold serial dilutions of the cccDNA standard and a 90 μL constant amount of HBV DNA copies. The cccDNA in the mixtures was detected by MCH-qPCR and recovery rates were calculated for each dilution.
3.6. Clinical Samples and Methodological Comparison
Four liver biopsy tissues were collected from four CHB patients selected from the Affiliated Hospital of Luzhou Medical College in China. Additionally, two liver biopsy tissues were collected from two subjects without HBV infection as negative controls. Ten serum samples were collected from CHB patients with positive results for HbeAg with alanine aminotransferase (ALT) levels over the upper limit of the reference interval. The standard for diagnosis of CHB was based on the Chinese Management Scheme of Diagnostic and Therapy Criteria of Viral Hepatitis (29). Serum samples were collected within 1 week of use, and liver biopsy tissues were stored at -80°C until use. The study was approved by the ethics committee of the Affiliated Hospital of Luzhou Medical College and performed in accordance with the Declaration of Helsinki. To further test the applicability of established MCH-qPCR, total DNA from liver tissues and sera samples was extracted using the Hirt method. Four liver biopsy tissue samples from CHB patients served as positive controls and samples from two subjects without HBV infection served as negative controls. CccDNA from serum samples was detected by both real-time PCR and MCH-qPCR.
3.7. Statistical Analysis
All data was reported as the mean ± standard deviation for at least three independent samples. Continuous variables were tested for normality using the K-S test; correlations between two variables were tested with Pearson’s correlation analysis and normally distributed variables were analyzed by student’s t-test using statistical package for the social sciences (SPSS) software (version 17.0, SPSS, Chicago, IL). The criteria for statistical significance were * P < 0.05 and ** P < 0.01.
4. Results
4.1. Preparation of Magnetic Silica-Coated Nanoparticles
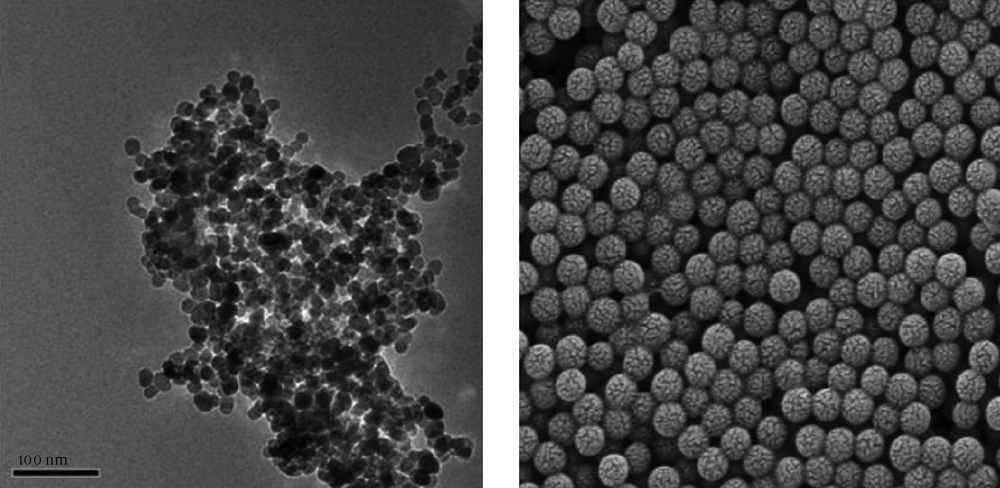
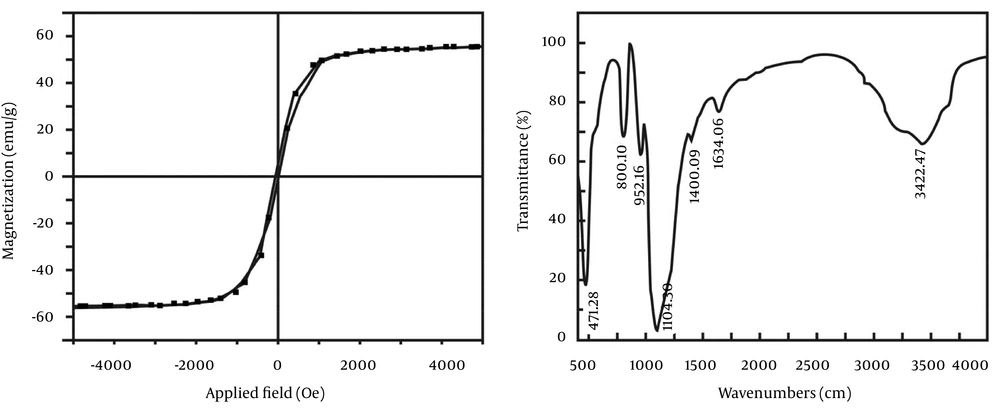
Single-phase nanopowders showed a uniform distribution, which was in agreement with previous reports (16). Silica-coated nanoparticles were cubic and highly uniform in size. The silica-coated particles had significantly better dispersion than the Fe3O4 nanoparticles (Figure 1). The structure and superparamagnetic quality of silica-coated nanoparticles confirmed by the Fourier transform infrared spectrum (FITR) are shown in Figure 2.
Particle sizes of single-phase nanopowders (Fe3O4) were between 8 and 15 nm, average size was about 13.2 nm, and that of silica-coated nanoparticles ranged from 65 to 93 nm, its average size was about 84 nm. Surface modification of nanoparticles (silica-coated nanoparticles) could greatly reduce aggregation.
Left, the saturation magnetization of the nanoparticles was approximately 55 emu/g, lower than the saturation magnetization of bulk magnetite (92 emu/g). Moreover, non-hysteresis and remanence phenomena were observed, which indicated an obvious superparamagnetic phenomenon that magnetism only existed when the external magnetic field was present; when the external magnetic field was removed the magnetic field completely disappears. Right, The Fe-O-Fe stretching vibration was 471/cm, and the stretching vibration of Si-O was 1104/cm. Therefore, the main peaks show that the synthetic particles contained Fe3O4 and silica.
4.2. Preparation of Functionalized Nanoparticles
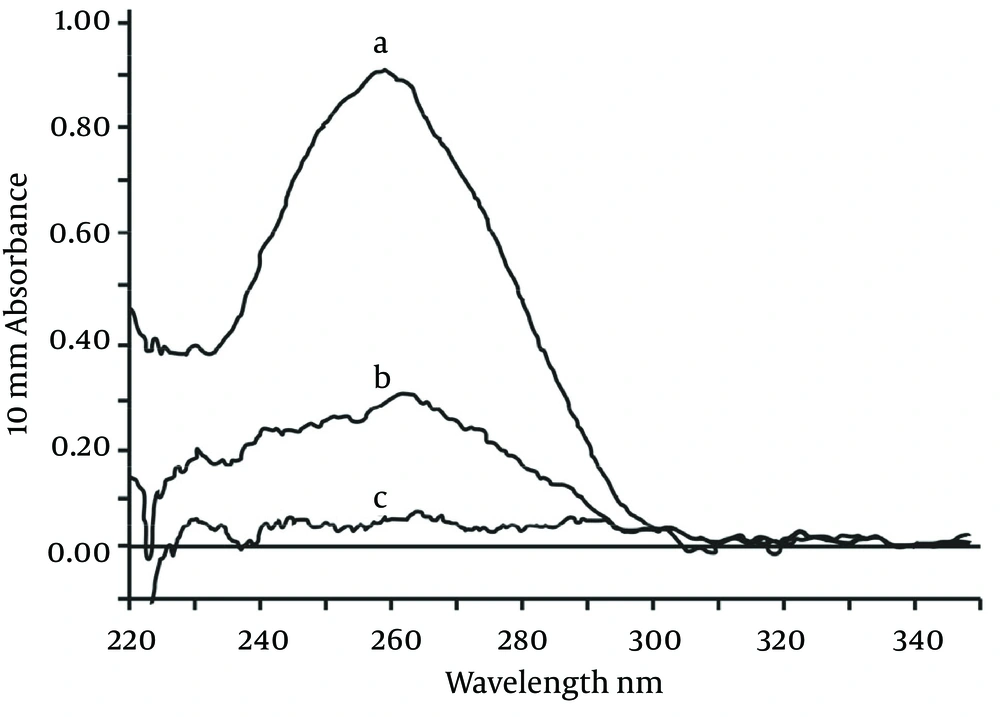
As shown in Figure 3, the characteristic absorptions at 260 nm changed significantly after the bioconjugation reaction. After coupling with the nucleic acid, nucleic acid concentrations in the supernatant were significantly decreased. Additionally, streptavidin-modified nanoparticles had a high oligonucleotide binding capacity, with an average amount of fixed nucleic acid of approximately 3 200 pmol/mg (Table 2).
4.3. Hybridization Capture of Complementary Oligonucleotides
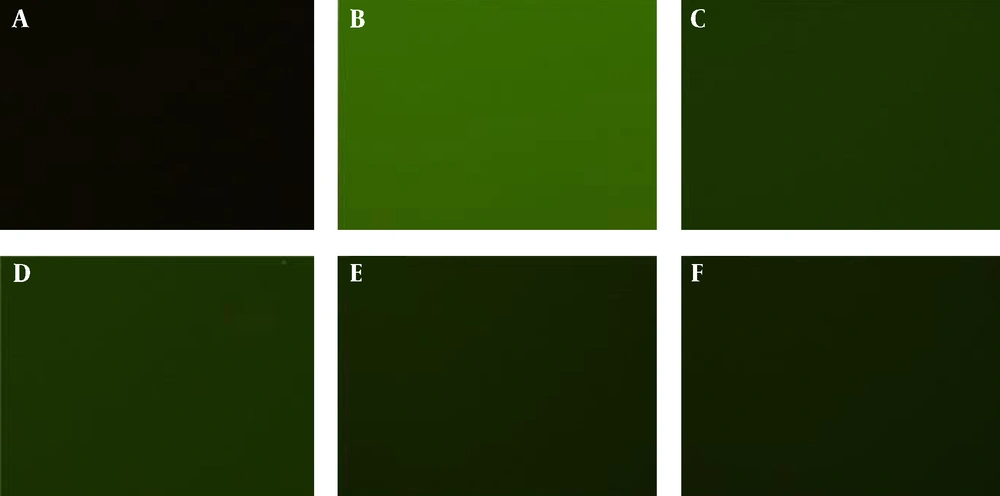
FITC-labeled sequences were added to the buffer and hybridized with functionalized nanoparticles, resulting in fluorescence intensity of the supernatant, which was obviously lower than that of the pre-hybridization supernatant (Figure 4). Moreover, the optimal proportion between functionalized nanoparticles and probes was 1:2 (50 µg: 100 pmol) and the capture capacity of the FITC-labeled sequences was approximately 2000 pmol/mg.
4.4. Optimal cccDNA Functionalized-Nanoparticles
The functionalized nanoparticles captured probes of different lengths (21-, 25-, 35- and 49-mer; Table 3), which were used to examine the effect of probe length on the recovery efficiency of the cccDNA standard. The 21-mer and 35-mer capture probes enabled detection of the expected concentration (105 IU/mL) of purified cccDNA in a hybridization time of three hours. However, the expected concentration was not detected using 25-mer capture probe even when the hybridization time was increased from 1 to 3 hours. Additionally, reducing the hybridization time from 3 hours to 1 hour did not affect the desired concentration when using the 49-mer probes. Therefore, 1 hour of hybridization time with the 49-mer capture probe was selected for all further experiments.
| Probe number | Probe Length, mer | Hybridization Time, h | Concentration of Starting cccDNA, IU/mL | Detection Concentration by MCH-qPCR, IU/mLa |
|---|---|---|---|---|
| 1 | 21 | 1 | 105 | 104 |
| 2 | 25 | 1 | 105 | 103 |
| 3 | 35 | 1 | 105 | 104 |
| 4 | 49 | 1 | 105 | 105 |
| 1 | 21 | 2 | 105 | 105 |
| 2 | 25 | 2 | 105 | 104 |
| 3 | 35 | 2 | 105 | 104 |
| 4 | 49 | 2 | 105 | 105 |
| 1 | 21 | 3 | 105 | 105 |
| 2 | 25 | 3 | 105 | 104 |
| 3 | 35 | 3 | 105 | 105 |
| 4 | 49 | 3 | 105 | 105 |
Specific Capture of cccDNA Using Magnetic Beads Functionalized With 21-49 mer Oligonucleotides
4.5. Limit of Detection for MCH-qPCR
The positive results at concentrations were greater than or equal to 100 IU/mL using serially diluted standards as samples. The rate of undetectable samples increased at concentration < 100 IU/mL, and cccDNA was completely undetectable at 1 IU/mL using the novel method. Therefore, the limit of detection (LOD) of this method for cccDNA was calculated as 90 IU/mL (Table 4) according to the literature (17).
| Samples | Concentration of cccDNA, IU/mL | Number | Positive (%) |
|---|---|---|---|
| A | 106 | 15 | 15/15 (100) |
| B | 105 | 15 | 15/15 (100) |
| C | 104 | 15 | 15/15 (100) |
| D | 103 | 15 | 15/15 (100) |
| E | 102 | 15 | 15/15 (100) a |
| F | 10 | 15 | 2/15 (13.3) |
| G | 1 | 15 | 0/15 |
Limit of Detection of MCH-qPCR
4.6. The Repeatability and Linearity of This Assay
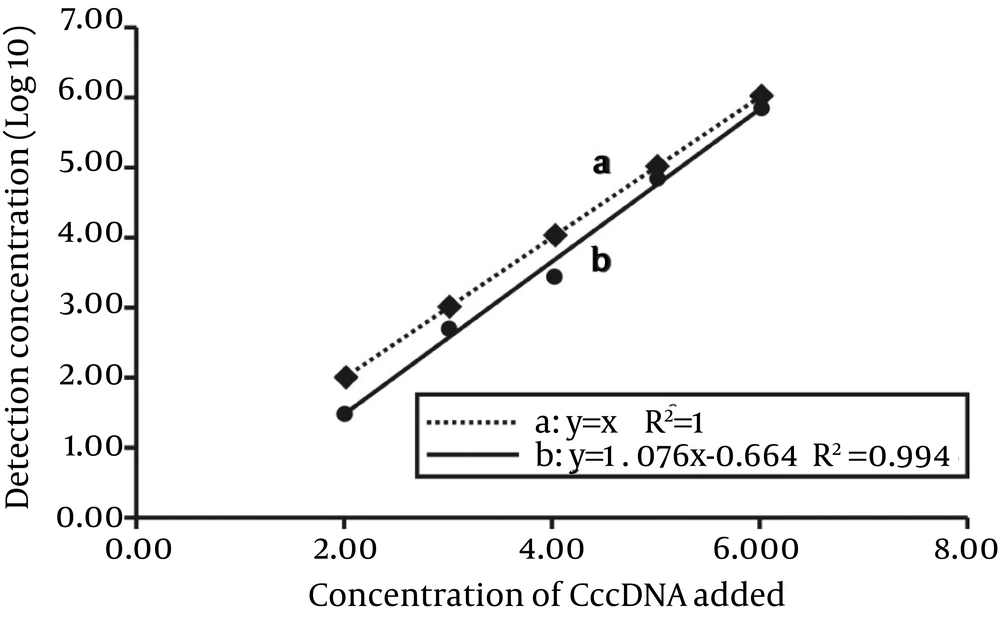
The quantitative results, standard deviations and coefficients of variation (CVs) were determined by measuring the amount of cccDNA in six serially diluted samples described above (Table 5). Based on these results, we performed a linear regression analysis between the expected cccDNA values and the values detected by MCH-qPCR. In Figure 5, line-a and line-b could be described by a linear model (r2 = 0.994), which was consistent with a strong linear relationship between the added concentration (log10) and detected concentration (log10) (F = 507.5, P < 0.01). When the parameters of the regression equation were tested, the difference between the slopes of line-a and line-b was not statistically significant (F = 2.532, P = 0.163 > 0.05). However, stationary errors were observed compared to the expected concentration. Accordingly, we used the fitted regression equation for prediction (y value). When x = 2, 3, 4, 5 and 6, the prediction value y = 1.488, 2.564, 3.64, 4.716 and 5.792, respectively. Therefore, the bias (bias = y expected-y predicted) met the evaluation criteria (18), except for the low concentration group (102 IU/mL).
| Concentration of Adding cccDNA (IU/mL) | Detected Concentration by MCH-qPCR (Log10-value) | Log SD (n = 15) | CV,% | Ct value | Mean Recovery,% b |
|---|---|---|---|---|---|
| 106 | 5.79 | 0.19 | 3.3 | 25.7 ± 0.6 | 96.5 ± 3.1 |
| 105 | 4.82 | 0.26 | 5.4 | 28.6 ± 0.8 | 96.5 ± 5.1 |
| 104 | 3.43 | 0.11 | 3.2 | 32.7 ± 0.3 | 85.8 ± 2.7 |
| 103 | 2.68 | 0.07 | 2.6 | 36.3 ± 0.2 | 89.3 ± 2.3 |
| 102 | 1.48 | 0.31 | 20.9 | 38.5 ± 1.8 | 74.0 ± 30.3 |
| 10 | Undetermined |
Efficiency of HBV cccDNA Capture and Detection by MCH-qPCR a
4.7. The Specificity of the Method
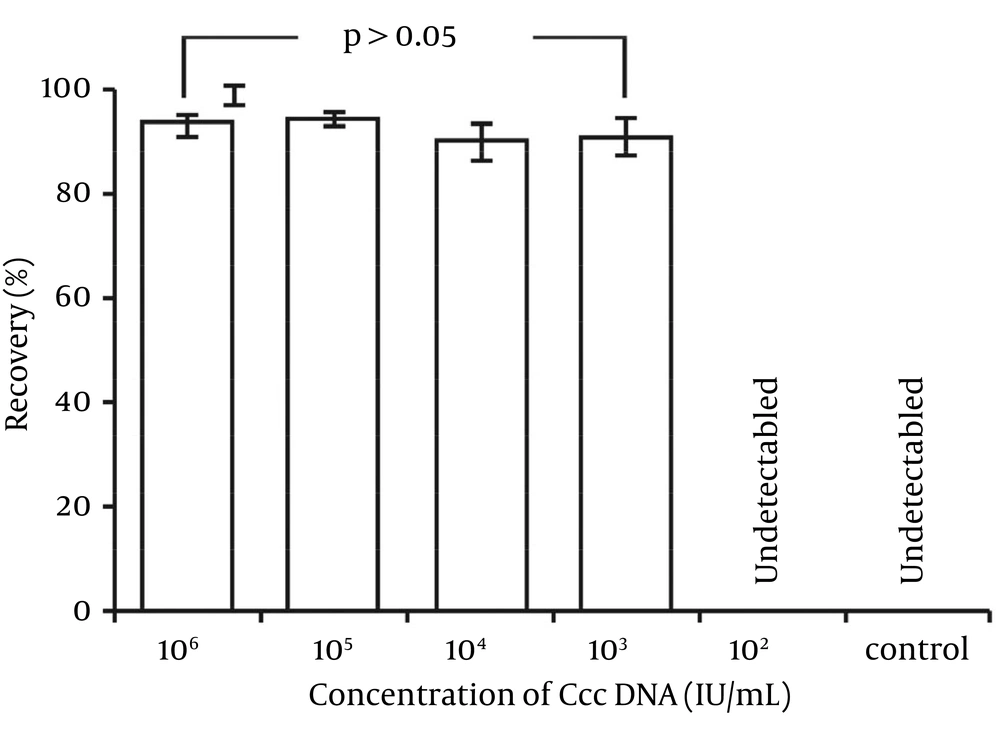
In the specificity experiment (Figure 6), cccDNA from the mixing solution was detectable in group 106, group 105, group 104 and group 103, but not group 102 and the control group (purified “interference”). Furthermore, the recovery in all groups was higher than 90% (raw data multiplied by the 10-fold dilution factor). These recovery rates were similar to those described above except for the 102 group, which might have been diluted under the LOD. Therefore, addition of interfering “HBV DNA” (mainly consisting of rcDNA) did not affect cccDNA detection, even though the concentration of HBV DNA reached 108 IU/mL. The specificity of recovery was acceptable according to the criterion for acceptable performance (30).
Recovery (%): Group 106 = (93.2 ± 2.0); Group 105 = (94.1 ± 1.2); Group 104 = (90.1 ± 3.4); Group 103 = (90.8 ± 3.8); Group 102 = not detected; control (HBV DNA) = not detected. The raw data of all groups (detected) were multiplied by the dilution factor (10-fold). The differences among groups 106, 105, 104 and 103 were not significant (P > 0.05).
4.8. Methodological Comparison
Both HBV DNA and cccDNA in hepatocytes were detectable in four liver tissue samples from CHB patients. The concentrations for HBV DNA and cccDNA were 3.23 × 10⁷, 7.16 × 10⁴, 1.52 × 10⁴, 1.79 × 10³ IU/mL and 1.18 × 10⁵, 3.24 × 10³, 7.21 × 10³, 4.56 × 10³ IU/mL, respectively. In contrast, HBV DNA and cccDNA were undetectable in hepatocytes from two liver tissue samples of uninfected HBV subjects. Compared to the real-time PCR method, introduction of MCH increased the specificity of assay with functionalized nanoparticles. As shown in Table 6, without the MCH step, there was an obvious increase of amplicon in serum cccDNA of CHB patients, the cccDNA contents of most samples were close to those of total HBV DNA respectively, which presumably resulted from non-specific amplification of incompletely double-stranded forms as the content of HBV DNA was over 105 copies/mL (12).
5. Discussion
In this study, we established the MCH-qPCR method as a novel strategy for specific HBV cccDNA enrichment and extraction using oligonucleotide capture-functionalized magnetic nanoparticles. Using this method, HBV cccDNA quantitation was achieved by real-time PCR. To the best of our knowledge, this is the first use of MCH-qPCR for cccDNA detection. Particles functioning as magnetic carriers should have the following characteristics; relatively small and uniform size, good suspension ability and contain activatable groups (31). In this study, we attempted to adjust different proportions of Fe3+ and Fe2+ and control the morphology of nanoparticles. TEM showed a uniform distribution of particles, with particle sizes between 8 and 15 nm when the proportion of Fe3+ and Fe2+ was 1.5:1 (Figure 1). The results with silica-coated nanoparticles were satisfactory when the optimal proportion of ethylsilicate (TEOS) and aqueous ammonia was 1:4; the silica-coated nanoparticles had a highly uniform size and better dispersion than single-phase nanoparticles (Figure 1). Next, functionalized nanoparticles were prepared through modification of silica-coated nanoparticles by SA and particles were coupled with biotin-labeled probes to take advantage of the extremely high-affinity interaction of SA with biotin (Figure 3). The results indicated that silica-coated magnetic particles had a high binding capacity and coupling efficiency (Table 2). Furthermore, the functionalized nanoparticles were hybridized with fluorescently-labeled oligonucleotide targets (Figure 4). The optimal particle-surface capture probe density for complementary sequence hybridization was approximately 2000 pmol/mg, which is likely higher than the density required to overcome the steric hindrance for purified cccDNA capture (14). Moreover, the length of capture probe may affect the efficiency of cccDNA capture in the same hybridization interval. Our results showed that the use of longer oligonucleotide capture probes did indeed result in better recovery in a shorter hybridization time based on subsequent qPCR amplification of the captured cccDNA. These results may be explained by a stronger interaction between cccDNA and the longer capture probes due to the formation of more hydrogen bonds (32). Another factor explaining the better capture may be the reduction of steric hindrance to hybridization by the longer capture probes (32). Using optimally functionalized particles, we could detect levels as low as 90 IU/mL cccDNA with our MCH-qPCR protocol. Therefore, the sensitivity of this assay is similar to those reported in other studies (33). In this study, different known concentrations of cccDNA standards were captured and quantified by MCH-qPCR by calculating the recovery of cccDNA using MCH-qPCR. Although the present results (Figure 5, 6 and Table 5) revealed that MCH method cannot capture all cccDNA molecules, because their recovery is less than 100%. However, the differences between the detected concentration and the expected concentration were within the acceptable range. Except for the low-concentration sample (containing 10 IU/mL cccDNA) in which the concentration could not be determined, a good linear relationship was observed between the cccDNA log10 concentrations of the other five samples detected by MCH-qPCR and the log10 value of their expected concentrations (Figure 5). Some studies reported that fluorescent quantitative PCR for cccDNA could produce false-positive results because of the high content of rcDNA when the content of HBV DNA was higher than 105 copies/mL (12). On the contrary, a literature reported that qPCR could electively amplify cccDNA when the rcDNA content was over 103 (34). In fact, the method used was not fluorescent quantitative PCR, but semi-quantitative (35). Furthermore, there was an obvious increase of amplicons in serum cccDNA of CHB patients without the MCH step (Table 6) and the cccDNA contents of most samples were close to those of total HBV DNA, respectively. As we knew, the content of cccDNA is just little part of total HBV DNA. The results of common qPCR might result from non-specific amplification of incompletely double-stranded forms as the content of HBV DNA was over 105 copies/mL (12). Therefore, the cccDNA contents detected by MCH-qPCR were much lower than that of HBV DNA. It may not result from cccDNA captured incompletely according to a good linear relationship between the expected value and the value detected by MCH-qPCR. In addition, a high content of HBV DNA was added to different concentrations of cccDNA as interference; however, a high content of HBV DNA did not affect the detection of cccDNA with MCH-qPCR and there was no cross-reactivity between HBV cccDNA and rcDNA. In the comparison test, intrahepatic HBV cccDNA could be detected by MCH-qPCR in liver tissue samples from CHB patients, but undetectable in samples of patients without HBV infection. Moreover, introduction of MCH obviously decreased the interference of rcDNA and thus increased the specificity of the method (Table 6 and Figure 6). Therefore, the probes on the surface of the functionalized nanoparticles are specific for HBV cccDNA but not HBV DNA or other DNA. We developed the MCH-qPCR method for cccDNA based on several factors, including the small size, silica-coated surface and magnetic effect of nanoparticles, the affinity properties of streptavidin-biotin, the specificity of the probes and the high sensitivity of real-time PCR. Oligonucleotide-functionalized magnetic nanoparticles have been widely used in biomedical fields, where adaptation of sample preprocessing and DNA capture to a micro-fluidic system facilitate the automation of magnetic separation. The MCH-qPCR method has a high sensitivity (90 IU/mL), good reproducibility, high specificity and high accuracy. The MCH-qPCR results and the expected concentrations had a good linear relationship for concentrations of 102–106 IU/mL. Therefore, it met the requirements for clinical sample detection. Further studies with a larger sample size are required to confirm these results. In summary, the final optimized protocol of the development assay is 49-mer functionalized-nanoparticles capturing the total DNA extracted by Hirt method at 62°C for 1 hour, denaturation at 95°C for 10 minutes and cooling on ice and supernatant being detected by qPCR. Our established MCH-qPCR method could improve the specificity and accuracy of cccDNA detection.
| Sample Number | HBV DNA, IU/mL | cccDNA Detected by qPCR a | cccDNA Detected by MCH-qPCR b |
|---|---|---|---|
| 1 | 2.64 × 10⁷ | 3.56 × 10⁴ | undetected |
| 2 | 7.12 × 10⁷ | 6.68 × 10⁷ | 1.04 × 10⁵ |
| 3 | 4.17 × 10⁷ | 2.21 × 10⁶ | 1.19 × 10³ |
| 4 | 4.06 × 10⁷ | 2.89 × 10⁷ | 1.73 × 10⁵ |
| 5 | 2.38 × 10⁶ | 8.83 × 10⁷ | 5.34 × 10⁴ |
| 6 | 9.72 × 10⁷ | 3.19 × 10⁷ | 4.92 × 10⁴ |
| 7 | 5.57 × 10⁷ | 4.50 × 10³ | undetected |
| 8 | 7.61 × 10⁸ | 3.65 × 10⁷ | 1.64 × 10⁵ |
| 9 | 1.80 × 10⁷ | 2.05 × 10⁷ | 8.00 × 10⁴ |
| 10 | 4.43 × 10⁷ | 2.93 × 10⁷ | 4.98 × 10⁴ |
| QC1 | / | 102c | 1.04 × 10² |
| QC2 | / | 103c | 8.64 × 10² |
Concentration of HBV DNA and cccDNA in 10 Serum Samples of CHB Patients
